Exploring Features for Identifying Edited Regions in Disfluent Sentences
Qi Zhang
Fuliang Weng
Department of Computer Science Research and Technology Center
Fudan University Robert Bosch Corp.
Shanghai, P.R.China 200433 Palo Alto, CA 94304
[email protected] [email protected]
Abstract
This paper describes our effort on the task of edited region identification for parsing disfluent sentences in the Switchboard corpus. We focus our attention on exploring feature spaces and selecting good features and start with analyzing the distributions of the edited regions and their components in the targeted corpus. We explore new feature spaces of a part-of-speech (POS) hierarchy and relaxed for rough copy in the experiments. These steps result in an improvement of 43.98% percent relative error reduction in F-score over an earlier best result in edited detection when punctuation is included in both training and testing data [Charniak and Johnson 2001], and 20.44% percent relative error reduction in F-score over the latest best result where punctuation is excluded from the training and testing data [Johnson and Charniak 2004].
1
Introduction
Repairs, hesitations, and restarts are common in spoken language, and understanding spoken language requires accurate methods for identifying such disfluent phenomena. Processing speech repairs properly poses a challenge to spoken dialog systems. Early work in this field is primarily based on small and proprietary corpora, which makes the comparison of the proposed methods difficult [Young and Matessa 1991, Bear et al. 1992, Heeman & Allen 1994]. Because of the availability
of the Switchboard corpus [Godfrey et al. 1992] and other conversational telephone speech (CTS) corpora, there has been an increasing interest in improving the performance of identifying the edited regions for parsing disfluent sentences [Charniak and Johnson 2001, Johnson and Charniak 2004, Ostendorf et al. 2004, Liu et al. 2005].
In this paper we describe our effort towards the task of edited region identification with the intention of parsing disfluent sentences in the Switchboard corpus. A clear benefit of having accurate edited regions for parsing has been demonstrated by a concurrent effort on parsing conversational speech [Kahn et al 2005]. Since different machine learning methods provide similar performances on many NLP tasks, in this paper, we focus our attention on exploring feature spaces and selecting good features for identifying edited regions. We start by analyzing the distributions of the edited regions and their components in the targeted corpus. We then design several feature spaces to cover the disfluent regions in the training data. In addition, we also explore new feature spaces of a part-of-speech hierarchy and extend candidate pools in the experiments. These steps result in a significant improvement in F-score over the earlier best result reported in [Charniak and Johnson 2001], where punctuation is included in both the training and testing data of the Switchboard corpus, and a significant error reduction in F-score over the latest best result [Johnson and Charniak 2004], where punctuation is ignored in both the training and testing data of the Switchboard corpus.
In this paper, we follow the definition of [Shriberg 1994] and others for speech repairs: A speech repair is divided into three parts: the reparandum, the part that is repaired; the interregnum, the part that can be either empty or fillers; and the
repair/repeat, the part that replaces or repeats the
reparandum. The definition can also be exemplified via the following utterance:
N
repeat reparanda int erregnum,
, this is a big problem.
This is you know
This paper is organized as follows. In section 2, we examine the distributions of the editing regions in Switchboard data. Section 3, then, presents the Boosting method, the baseline system and the feature spaces we want to explore. Section 4 describes, step by step, a set of experiments that lead to a large performance improvement. Section 5 concludes with discussion and future work.
2
Repair Distributions in Switchboard
We start by analyzing the speech repairs in the Switchboard corpus. Switchboard has over one million words, with telephone conversations on prescribed topics [Godfrey et al. 1992]. It is full of disfluent utterances, and [Shriberg 1994, Shriberg 1996] gives a thorough analysis and categorization of them. [Engel et al. 2002] also showed detailed distributions of the interregnum, including interjections and parentheticals. Since the majority of the disfluencies involve all the three parts (reparandum, interregnum, and repair/repeat), the distributions of all three parts will be very helpful in constructing patterns that are used to identify edited regions.
For the reparandum and repair types, we include their distributions with and without punctuation. We include the distributions with punctuation is to match with the baseline system reported in [Charniak and Johnson 2001], where punctuation is included to identify the edited regions. Resent research showed that certain punctuation/prosody marks can be produced when speech signals are available [Liu et al. 2003]. The interregnum type, by definition, does not include punctuation.
The length distributions of the reparanda in the training part of the Switchboard data with and
without punctuation are given in Fig. 1. The reparanda with lengths of less than 7 words make up 95.98% of such edited regions in the training data. When we remove the punctuation marks, those with lengths of less than 6 words reach roughly 96%. Thus, the patterns that consider only reparanda of length 6 or less will have very good coverage.
Length distribution of reparanda
0% 10% 20% 30% 40% 50%
1 2 3 4 5 6 7 8 9 10
With punctation Without punctation
Figure 1. Length distribution of reparanda in Switchboard training data.
Length distribution of repairs/repeats/restarts
0% 10% 20% 30% 40% 50%
0 1 2 3 4 5 6 7 8 9
With punctation Without punctation
Figure 2. Length distribution of
repairs/repeats/restarts in Switchboard training data.
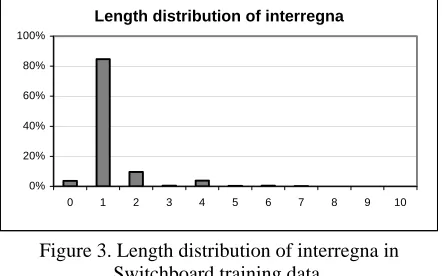
Length distribution of interregna
0% 20% 40% 60% 80% 100%
0 1 2 3 4 5 6 7 8 9 10
Figure 3. Length distribution of interregna in Switchboard training data.
make 98.86% of such instances in the training data. This gives us an excellent coverage if we use 7 as the threshold for constructing repair/repeat patterns.
The length distribution of the interregna of the training part of the Switchboard corpus is shown in Fig. 3. We see that the overwhelming majority has the length of one, which are mostly words such as “uh”, “yeah”, or “uh-huh”.
In examining the Switchboard data, we noticed that a large number of reparanda and repair/repeat pairs differ on less than two words, i.e. “as to, you know, when to”1, and the amount of the pairs differing on less than two POS tags is even bigger. There are also cases where some of the pairs have different lengths. These findings provide a good base for our feature space.
3
Feature Space Selection for Boosting
We take as our baseline system the work by [Charniak and Johnson 2001]. In their approach,
rough copy is defined to produce candidates for
any potential pairs of reparanda and repairs. A boosting algorithm [Schapire and Singer 1999] is used to detect whether a word is edited. A total of 18 variables are used in the algorithm. In the rest of the section, we first briefly introduce the boosting algorithm, then describe the method used in [Charniak and Johnson 2001], and finally we contrast our improvements with the baseline system.
3.1
Boosting Algorithm
Intuitively, the boosting algorithm is to combine a set of simple learners iteratively based on their classification results on a set of training data. Different parts of the training data are scaled at each iteration so that the parts of the data previous classifiers performed poorly on are weighted higher. The weighting factors of the learners are adjusted accordingly.
We re-implement the boosting algorithm reported by [Charniak and Johnson 2001] as our baseline system in order to clearly identify contributing
1
“as to” is the edited region. Italicized words in the examples are edited words
factors in performance. Each word token is characterized by a finite tuple of random variables
(Y,X1,...,Xm).
Y is the conditioned variables and ranges from {-1,+1}, with Y = +1 indicating that the word is edited. X1,...,Xm are the conditioning variables;
each variable Xj ranges over a finite set χj. The
goal of the classifer is to predict the value of Y
given a value for X1,...,Xm.
A boosting classifier is a linear combination of n
features to define the prediction variable Z.
∑
with X’s being conditioning variables and x’s being values.
variable-value pairs for the current position belong to φi.
The prediction made by the classifier is
|
Z
|
Z/
sign(Z)
=
. Intuitively, our goal is to adjust the vector of feature weightsα
K
=
(
α
1,....,
α
n)
to minimize the expected misclassification rate]
E[sign(Z)
≠
Y
. This function is difficult to minimize, so our boosting classifier minimizes theexpected boost loss Eˆt[(exp(-YZ)] as in [Collins
2000], where Eˆt[⋅] is the expectation on the
1500 iterations, and contains around 1350 non-zero feature weights.
3.2
Charniak-Johnson approach
In [Charniak and Johnson 2001], identifying edited regions is considered as a classification problem, where each word is classified either as edited or normal. The approach takes two steps. The first step is to find rough copy. Then, a number of variables are extracted for the boosting algorithm. In particular, a total of 18 different conditioning variables are used to predict whether the current word is an edited word or a non-edited word. The 18 different variables listed in Table 1 correspond to the 18 different dimensions/factors for the current word position. Among the 18 variables, six of them, Nm, Nu, Ni, Nl, Nr and Tf, depend on the
identification of a rough copy.
For convenience, their definition of a rough copy is repeated here. A rough copy in a string of tagged words has the form of ∂1βλ∂2, where:
1. ∂1 (the source) and ∂2 (the copy) both begin with non-punctuation,
2. the strings of non-punctuation POS tag of ∂1 and ∂2 are identical,
3. β (the free final) consists of zero or more sequences of a free final word (see below) followed by optional punctuation,
4. λ (the interregnum) consists of
sequences of an interregnum string (see below) followed by optional punctuation.
The set of free final words includes all partial words and a small set of conjunctions, adverbs and miscellanea. The set of interregnum strings
consists of a small set of expressions such as uh,
you know, I guess, I mean, etc.
3.3
New Improvements
Our improvements to the Charniak-Johnson method can be classified into three categories with the first two corresponding to the twp steps in their method. The three categories of improvements are described in details in the following subsections.
3.3.1
Relaxing Rough Copy
We relax the definition for rough copy, because more than 94% of all edits have both reparandum and repair, while the rough copy defined in [Charniak and Johnson 2001] only covers 77.66% of such instances.
Two methods are used to relax the rough copy definition. The first one is to adopt a hierarchical POS tag set: all the Switchboard POS tags are further classified into four major categories: N (noun related), V (verb related), Adj (noun modifiers), Adv (verb modifiers). Instead of requiring the exact match of two POS tag sequences, we also consider two sequences as a
Variables Name Short description X1 W0 The current orthographic word.
X2 – X5 P0,P1,P2,Pf Partial word flags for the current position, the next two to the right, and the first one
in a sequence of free-final words (partial, conjunctions, etc.) to the right of the current position.
X6 – X10 T-1,T0,T1,T2,Tf Part of speech tags for the left position, the current position, the next two positions
to the right, and the first free-final word position to the right of the current position.
X11 Nm Number of words in common in reparandum and repair
X12 Nn Number of words in reparandum but not repair
X13 Ni Number of words in interregnum
X14 Nl Number of words to the left edge of reparandum
X15 Nr Number of words to the right edge of reparandum
X16 Ct The first non-punctuation tag to the right of the current position
X17 Cw The first non-punctuation word to the right of the current position
X18 Ti The tag of the first word right after the interregnum that is right after the current
word.
rough copy if their corresponding major categories match. This relaxation increases the rough copy
coverage, (the percent of words in edited regions
found through the definition of rough copy), from 77.66% to 79.68%.
The second is to allow one mismatch in the two POS sequences. The mismatches can be an addition, deletion, or substitution. This relaxation improves the coverage from 77.66% to 85.45%. Subsequently, the combination of the two relaxations leads to a significantly higher coverage of 87.70%. Additional relaxation leads to excessive candidates and worse performance in the development set.
3.3.2
Adding New Features
We also include new features in the feature set: one is the shortest distance (the number of words) between the current word and a word of the same orthographic form to the right, if that repeated word exists; another is the words around the current position. Based on the distributional analysis in section 2, we also increase the window
sizes for POS tags (
T
−5,...,
T
5 ) and words(
W
−5,...,
W
5) to ±5 and partial words (P
−3,...,
P
3) to ±3, extending Ti and Pj.3.3.3
Post Processing Step
In addition to the two categories, we try to use contextual patterns to address the independency of variables in the features. The patterns have been extracted from development and training data, to deal with certain sequence-related errors, e.g.,
E N E Æ E E E,
which means that if the neighbors on both sides of a word are classified into EDITED, it should be classified into EDITED as well.
4
Experimental Results
We conducted a number of experiments to test the effectiveness of our feature space exploration. Since the original code from [Charniak and Johnson 2001] is not available, we conducted our first experiment to replicate the result of their baseline system described in section 3. We used the exactly same training and testing data from the Switchboard corpus as in [Charniak and Johnson
2001]. The training subset consists of all files in the sections 2 and 3 of the Switchboard corpus. Section 4 is split into three approximately equal size subsets. The first of the three, i.e., files sw4004.mrg to sw4153.mrg, is the testing corpus. The files sw4519.mrg to sw4936.mrg are the development corpus. The rest files are reserved for other purposes. When punctuation is included in both training and testing, the re-established baseline has the precision, recall, and F-score of 94.73%, 68.71% and 79.65%, respectively. These results are comparable with the results from [Charniak & Johnson 2001], i.e., 95.2%, 67.8%, and 79.2% for precision, recall, and f-score, correspondingly.
In the subsequent experiments, the set of additional feature spaces described in section 3 are added, step-by-step. The first addition includes the shortest distance to the same word and window size increases. This step gives a 2.27% improvement on F-score over the baseline. The next addition is the introduction of the POS hierarchy in finding rough copies. This also gives more than 3% absolute improvement over the baseline and 1.19% over the expanded feature set model. The addition of the feature spaces of relaxed matches for words, POS tags, and POS hierarchy tags all give additive improvements, which leads to an overall of 8.95% absolute improvement over the re-implemented baseline, or 43.98% relative error reduction on F-score.
When compared with the latest results from [Johnson and Charniak 2004], where no punctuations are used for either training or testing data, we also observe the same trend of the improved results. Our best result gives 4.15% absolute improvement over their best result, or 20.44% relative error reduction in f-scores. As a sanity check, when evaluated on the training data as a cheating experiment, we show a remarkable consistency with the results for testing data.
For error analysis, we randomly selected 100 sentences with 1673 words total from the test sentences that have at least one mistake. Errors can be divided into two types, miss (should be edited)
and false alarm (should be noraml). Among the
For example, one miss is “because of the friends
because of many other things”, an error we would have a much better chance of correct identification, if we were able to identify prepositional phrases reliably. Another example is “most of all my family”. Since it is grammatical by itself, certain prosodic information in between “most of” and “all my family” may help the identification. [Ostendorf et al. 2004] reported that interruption point could help parsers to improve results. [Kahn et al. 2005] also showed that prosody information could help parse disfluent sentences. The second major class of the misses is certain short words that are not labeled consistently in the corpus. For example, “so”, “and”, and “or”, when they occur in the beginning of a sentence, are sometimes labeled as
edited, and sometimes just as normal. The last category of the misses, about 5.3%, contains the ones where the distances between reparanda and repairs are often more than 10 words.
Among the 95 false alarms, more than three quarters of misclassified ones are related to certain grammatical constructions. Examples include cases like, “the more … the more” and “I think I should …”. These cases may be fixable if more elaborated grammar-based features are used.
5
Conclusions
This paper reports our work on identifying edited regions in the Switchboard corpus. In addition to a
Results on testing data Results on training data
with punctuation Punctuation on both No punctuation on both Method codes
Precision Recall f-score Precision Recall f-score Precision Recall f-score
CJ’01 95.2 67.8 79.2
JC’04 p 82.0 77.8 79.7
R CJ’01 94.9 71.9 81.81 94.73 68.71 79.65 91.46 64.42 75.59 +d 94.56 78.37 85.71 94.47 72.31 81.92 91.79 68.13 78.21 +d+h 94.23 81.32 87.30 94.58 74.12 83.11 91.56 71.33 80.19 +d+rh 94.12 82.61 87.99 92.61 77.15 84.18 89.92 72.68 80.39 +d+rw 96.13 82.45 88.77 94.79 75.43 84.01 92.17 70.79 80.08 +d+rw+rh 94.42 84.67 89.28 94.57 77.93 85.45 92.61 73.46 81.93 +d+rw+rt+wt 94.43 84.79 89.35 94.65 76.61 84.68 92.08 72.61 81.19 +d+rw+rh+wt 94.58 85.21 89.65 94.72 79.22 86.28 92.69 75.30 83.09 +d+rw+rh+wt+ps 93.69 88.62 91.08 93.81 83.94 88.60 89.70 78.71 83.85
Table 2. Result summary for various feature spaces.
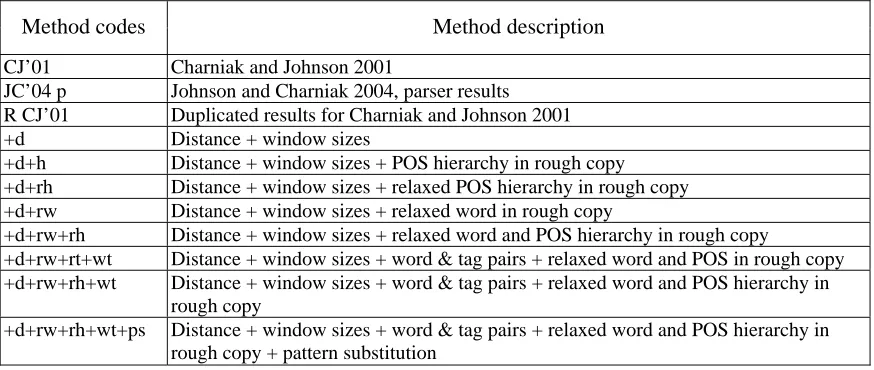
Method codes Method description
CJ’01 Charniak and Johnson 2001
JC’04 p Johnson and Charniak 2004, parser results R CJ’01 Duplicated results for Charniak and Johnson 2001 +d Distance + window sizes
+d+h Distance + window sizes + POS hierarchy in rough copy +d+rh Distance + window sizes + relaxed POS hierarchy in rough copy +d+rw Distance + window sizes + relaxed word in rough copy
+d+rw+rh Distance + window sizes + relaxed word and POS hierarchy in rough copy
+d+rw+rt+wt Distance + window sizes + word & tag pairs + relaxed word and POS in rough copy +d+rw+rh+wt Distance + window sizes + word & tag pairs + relaxed word and POS hierarchy in
rough copy
+d+rw+rh+wt+ps Distance + window sizes + word & tag pairs + relaxed word and POS hierarchy in rough copy + pattern substitution
distributional analysis for the edited regions, a number of feature spaces have been explored and tested to show their effectiveness. We observed a 43.98% relative error reduction on F-scores for the baseline with punctuation in both training and testing [Charniak and Johnson 2001]. Compared with the reported best result, the same approach produced a 20.44% of relative error reduction on F-scores when punctuation is ignored in training and testing data [Johnson and Charniak 2004]. The inclusion of both hierarchical POS tags and the relaxation for rough copy definition gives large additive improvements, and their combination has contributed to nearly half of the gain for the test set with punctuation and about 60% of the gain for the data without punctuation.
Future research would include the use of other features, such as prosody, and the integration of the edited region identification with parsing.
6
Acknowledgement
This work has been done while the first author is working at the Research and Technology Center of Robert Bosch Corp. The research is partly supported by the NIST ATP program. The authors would also like to express their thanks to Tess Hand-Bender for her proof-reading and Jeremy G. Kahn for many useful comments. Nevertheless, all the remaining errors are ours.
References
John Bear, John Dowding and Elizabeth Shriberg. 1992.
Integrating Multiple Knowledge Sources for Detection and Correction of Repairs in Human-Computer Dialog.
Proc. Annual Meeting of the Association for Computational Linguistics. 1992.
Charniak, Eugene and Mark Johnson. 2001. Edit Detection and Parsing for Transcribed Speech. Proc. of the 2nd Meeting of the North American Chapter of the Association for Computational Linguistics, pp 118-126.
Collins, M. 2000. Discriminative reranking for natural language parsing. Proc. ICML 2000.
Engel, Donald, Eugene Charniak, and Mark Johnson. 2002. Parsing and Disfluency Placement. Proc. EMNLP, pp 49-54, 2002.
Godfrey, J.J., Holliman, E.C. and McDaniel, J.
SWITCHBOARD: Telephone speech corpus for research and development, Proc. ICASSP, pp 517-520, 1992.
Heeman, Peter, and James Allen. 1994. Detecting and Correcting Speech Repairs. Proc. of the annual meeting of the Association for Computational Linguistics. Las Cruces, New Mexico, pp 295-302, 1994.
Johnson, Mark, and Eugene Charniak. 2004. A TAG-based noisy-channel model of speech repairs. Proc. of the 42nd Annual Meeting of the Association for Computational Linguistics.
Kahn, Jeremy G., Mari Ostendorf, and Ciprian Chelba. 2004. Parsing Conversational Speech Using Enhanced Segmentation. Proc. of HLT-NAACL, pp 125-138, 2004.
Kahn, Jeremy G., Matthew Lease, Eugene Charniak, Mark Johnson and Mari Ostendorf 2005. Effective Use of Prosody in Parsing Conversational Speech. Proc. EMNLP, 2005.
Liu, Yang, Elizabeth Shriberg, Andreas Stolcke, Barbara Peskin, Jeremy Ang, Dustin Hillard, Mari Ostendorf, Marcus Tomalin, Phil Woodland, Mary Harper. 2005. Structural Metadata Research in the EARS Program. Proc. ICASSP, 2005.
Liu, Yang, Elizabeth Shriberg, Andreas Stolcke. 2003.
Automatic disfluency identification in conversational speech using multiple knowledge sources Proc. Eurospeech, 2003
Ostendorf, Mari, Jeremy G. Kahn, Darby Wong, Dustin Hillard, and William McNeill. Leveraging Structural MDE in Language Processing. EARS RT04 Workshop, 2004.
Robert E. Schapire and Yoram Singer, 1999. Improved Boosting Algorithms Using Confidence-rated Predictions. Machine Learning 37(3): 297-336, 1999.
Shriberg, Elizabeth. 1994. Preliminaries to a Theory of Speech Disfluencies. Ph.D. Thesis. UC Berkeley,1994.
Shriberg, Elizabeth. 1996. Disfluencies in Switchboard. Proc. of ICSLP. 1996.