Evaluating Performance and Energy-Efficiency of a parallel
Signal Correlation Algorithm on current Multi and
Manycore Architectures
Arne Hendricks
13, Thomas Heller
13, Andreas Sch¨afer
13, Max Kasparek
2, and
Dietmar Fey
11 Department Computer Science, Department of Computer Architecture Friedrich-Alexander-Universit¨at Erlangen-N¨urnberg (FAU),
Erlangen, [email protected]
2 Fraunhofer Institut f¨ur integrierte Schaltungen (IIS), N¨urnberg, Germany
3 The STEAR Group (http://www.stellar-group.org)
Abstract
Increasing variety and affordability of multi- and many-core embedded architectures can pose both a challenge and opportunity to developers of high performance computing applications. In this paper we present a case study where we develop and evaluate a unified parallel approach to a signal-correlation algorithm,currently in-use in a commercial/industrial locating system. We utilize both HPX C++ and CUDA runtimes to achieve scalable code for current embedded multi- and many-core architectures (NVIDIA Tegra, Intel Broadwell M, Arm Cortex A-15). We also compare our approach onto traditional high-performance hardware as well as a native embedded many-core variant. To increase the accuracy of our performance analysis we introduce dedicated performance model. The results show that our ap-proach is feasible and enables us to harness the advantages of modern micro-server architectures, but also indicates that there are limitations to some of the currently existing many-core embedded architec-tures, that can lead to traditional hardware being superior both in efficiency and absolute performance.
Keywords:Programming Models, Many Core, Runtimes, User Feedback, Micro Servers, Shared Memory
1
Introduction and Related Work
Modern real-time locating systems can be used to track objects and/or persons in confined spaces to speed up logistics or increase safety on construction sites for example. These systems rely on signal du-ration of wireless radio signals between earthbound transmitters and receivers, involving a high amount of compute intensive calculations to determine the locations of targets. We present a case study in this paper, as we developed and evaluated different parallel implementations of a TOA correlation algorithm (currently commercially in use in IIS’ RedFIR System) on current embedded multi- and many-core
Volume 80, 2016, Pages 1566–1576
ICCS 2016. The International Conference on Computational Science
1566 Selection and peer-review under responsibility of the Scientific Programme Committee of ICCS 2016
shared memory architectures (NVIDIA Jetson K1, Intel Broadwell Ultra-Low-Power) used in micro servers, as well as high-performance computing servers (Intel Xeon Ivy Bridge with NVIDIA K20 GPUs as accelerators) and compare them to an existing implementation, on an Epiphany evaluation board with an accelerator core in [6].
Our implementation is based on an unified approach, involving the HPX parallel C++ runtime system, fully complying to C++ standards 2011 and 2014 (combining global address spaces with fine-grained parallelism and an active message driven computation based on work queues [5]) to achieve scalability and programmability on many-core hardware. We also used use current CUDA features such as warp-shuffling. Our contribution includes building a unified interface for testing and measuring as well as distribution of the code on different platforms and hardware, relying on C++ templates, and allowing us to mitigate overheads introduced by increased parallelism. For the evaluation of energy efficiency we use the Energy-Delay-Product [3] as a fused metric and also introduce a performance model which utilizes the known Roofline Model [8] to gain insight into the theoretical maximum performance of the algorithm on a given architecture, it can also be applied to other applications in the field of correla-tion/locating systems. Theoretically optimal results regarding runtime gained from our model, were also evaluated with respect to total running time and energy efficiency on real hardware. We also show that architectures with a reputation of being ”energy-inefficient” can outperform embedded ”low-voltage” architectures in regards of energy-efficiency under the right circumstances.
The results prove the feasibility of our approach and enable us to give practical recommendations for architecture selection, based on external constraints such as power budget and time to solution. Regarding the EDP and the Roofline model, extensive work has been done by [8] and [3]. Our work is divided into six main sections. We discuss details of the correlation algorithm in Sec. 2. In Sec.3
we introduce the performance model which we developed and discuss some of the consequences it has. We then detail our parallelization approaches for the different platforms in Sec.4. To gain insight on the energy efficiency, different measurement setups were employed, and several metrics used, which is subject of Sec.5. Having analyzed theoretical performance, parallelization and energy considerations, we discuss our results in Sec.6. Finally we conclude and give an outlook to possible future work in Sec.7
2
Locating Systems: The Correlation Algorithm
The algorithm to locate targets is currently processed in a central compute-cluster and would benefit from parallelization and, if possible, outsourcing into the antenna itself, as the system should be as portable and power efficient as possible. Reichenbach et al. already tried to shift some of the workload into the antenna by utilizing an FPGA and the Adapteva Epiphany accelerator [6], our case study focuses on embedded multi- and many-core architectures, as described Sec. 1. To track a target individual signals sent by transmitters on the target are correlated with well-known reference signals in order to compute the Time-of-Arrival (TOA) of a signal at an antenna. The TOAs of multiple antennas are then processed into Time-Difference-of-Arrivals (TDOAs) and used for an hyperbolic triangulation of the targets’ positions. Two correlation algorithms are involved in this calculation as explained in [6]. Initially an acquisition algorithm and a subsequent tracking algorithm. The transmitters are sending so-called A-Bursts which are narrow-band bursts sent with a low rate, which are followed by a series of T-Bursts, sent with a higher rate. Once an antenna picks up and detects an initial A-Burst sent by a transmitter (by correlating the continuously received stream of input data of the antenna with the reference sequence of the A-burst), it knows that there will be the event of an arriving T-Burst in the very near future. How near is determined by the geometry and the shape of the area that the transmitters are placed in.
This prediction leads to a so called prediction window: a maximum and minimum time window in which the subsequent T-Burst will most likely fall. The system then extracts a series of input signals received
typedef std::vector<std::complex<float>> signal;
signal correlation(signal const &y, signal const &x)
{
signal r(y.size() - x.size(), 0.0);
for(std::size_t l = 0; l != L; ++l){ for(std::size_t k = 0; k != K; ++k){ r[l] += y[k + l] * x[k]; } } return r; }
Figure 1:A correlation of two complex vectors. For the inner loop, 8 floating point operations are required, two for the complex addition and 6 for the complex multiplication. Resulting inK∗L∗8single precision floating point operations per correlation. Variablekis the index of the discrete sample at a timek, variablelis the offset in the prediction window.
during this predicted time window, and correlates the well-known reference signal to this window. The correlation is a sliding dot-product of what is known-to-be the ideal signal (because the pattern of an individual signal of a transmitter is known beforehand and fixed) and a signal-value actually received at the antenna. Depending of the position of the maximum peak (which will happen when the signal arrives), the system can then determine where within the time-window the exact time of arrival was. It can use this data also to predict when a future prediction window will likely be. This second correlation, used to do the high-precision tracking, is algorithmically more complex than the first and combined with its higher frequency of execution thus more computationally intensive. It is the part of the algorithm on which we base our case study. The algorithm consists of a series of multiply-accumulate operations of received complex signals, and a well-known conjugated reference sequence, sent by the transmitters.
ryx[l] =K−1
k=0
y[k+l]∗x[k]∗e2πΔF k+Φ0 (1)
A single correlationrat spotlconsists of a sum of a of a sample value of a received signalyat a discrete timestepk, which is offset by a certain amount (indicating the time offset within the window) multiplied with the well-known reference signal and a factore2πΔF k+Φ0, which is a complex rotation term used to
compensate for frequency offsets between transmitter and receiver as described in [6]. This process is being repeated for the width of the prediction window (in our Case untill= 60) and we yield an array with 60 values. The maximum of these 60 result values is retrieved. This value represents the position in the predicted time window, i.e. the time of arrival can be easyly calculated because the max and min times for the window are known.
3
Performance Analysis
We now introduce a performance model to assess the achieved performance and classify the feasibility of our implementations. The underlying algorithm of our application is a complex correlation (see Fig.1), consisting of floating point operations and memory accesses . One very effective performance model to apply can thus be derived from the Roofline Model [8]. It’s main purpose is to classify an algorithm into the categoriesMemory BoundandCompute Bound. To determine the category of a given algorithm on a specific architecture, we need to analyze it’s properties with respect to the number of floating point operations and accesses to memory. The classification happens on the basis of the flop per byte ratio. For a proper estimation we’re assuming a pessimistic flop/byte ratio and apply optimizations as well
as some assumptions known for the architecture to give an upper bound for achievable performance. Fig1outlines the algorithm, the number of floating point operations in the most inner loop is 8, which is repeated K times L resulting in the following formula:
#flop(K, L) =K∗L∗8 (2)
We assume all data per iteration to be initially loaded from main memory and complete absence of a cache. We thus require to load two single precision floating point numbers per complex number and two stores, resulting in 6 loads and 2 stores leading to 32 bytes that need to be transfered:
#bytemax(K, L) =K∗L∗32 (3) A first optimization is to store the result of the inner loop temporary in a register. This ensures no data movement is taken place and reduces the number of required bytes by 8 to from 32 to 24. When considering potential SIMD capabilities of modern CPUs, it is important to consider the layout of the input data. In the na¨ıve implementation shown in Fig.1we have an Array of Structure (AoS) layout which is considered to be unsuitable for vectorization [7] and a Structure of Arrays (SoA) is to be preferred. In our algorithm, this results in saving the real and imaginary part of our complex vector in two distinct vectors leading to the effect that we are now able to load N (where N is the width of our vector unit) floating point numbers in parallel without additional shuffle instructions and perform a potentially supported fused multiply and add (FMA) instruction. While a trivial vectorization, this also leads to a potentially better cache utilization: From the 4 input streams, we are able to use 4 distinct cache lines, instead of 2 when having a single vector of complex numbers. The majority of modern CPU designs employ 64 byte cache lines. That is, each cache line can hold 16 single precision floating point values. Thus we can assume to access main memory at every 16th iteration. This reduces the number of bytes needed per iteration by a factor of1/16, leading to a required average number of bytes of 1.5:
#bytemin(K, L) =K∗L∗1.5 (4) To better evaluate the performance in the context of our application, we use the derived metric of cor-relations per second (corrs) which in addition considers the SIMD capabilites and frequency of our processor:
#corrscompute(K, L, f, F C) =
f ∗F C
#flop(K, L) (5)
Wheref is the frequency of the processor andF C the number of floating point operations per cycle, which are usually vectorized FMA instructions. The roofline model for our application can be derived by determining the minimum of the maximal achievableCompute Boundperformance and the obtainable memory bandwidth multiplied with the flop/byte ratio for theMemory Boundregion. This function can be used to give an approximation of the expected performance of a given architecture:
#corrs(K, L, f, F C, BW, x) =min( f∗F C
#flop(K, L), BW∗x) (6) WhereBW is the STREAM bandwidth andxthe flop/byte ratio. The concrete RedFIR application of the algorithm is implemented in a way that it requires 8 partial correlations of the input data with K= 183andL= 60to apply our perfomance model:
#corrsTOA(K, L, f, F C, BW, x) =min(
f∗F C
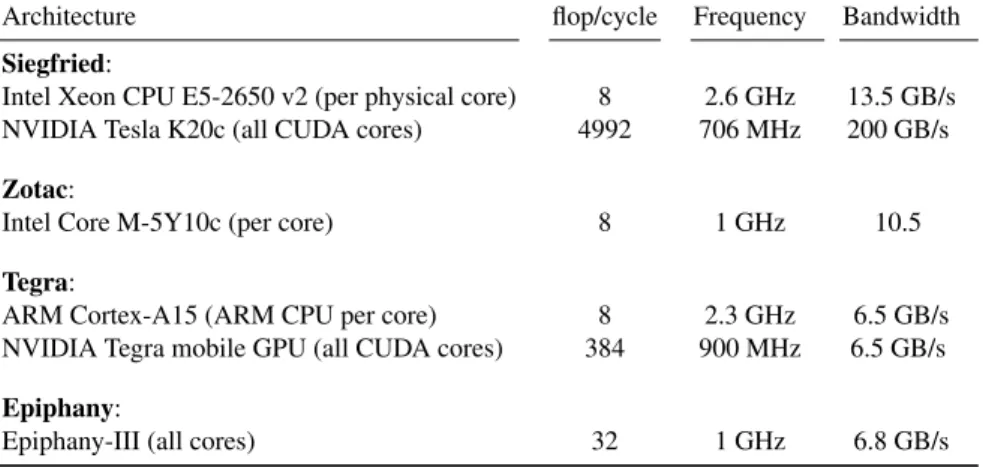
Architecture flop/cycle Frequency Bandwidth Siegfried:
Intel Xeon CPU E5-2650 v2 (per physical core) 8 2.6 GHz 13.5 GB/s NVIDIA Tesla K20c (all CUDA cores) 4992 706 MHz 200 GB/s Zotac:
Intel Core M-5Y10c (per core) 8 1 GHz 10.5
Tegra:
ARM Cortex-A15 (ARM CPU per core) 8 2.3 GHz 6.5 GB/s NVIDIA Tegra mobile GPU (all CUDA cores) 384 900 MHz 6.5 GB/s Epiphany:
Epiphany-III (all cores) 32 1 GHz 6.8 GB/s
Table 1: The Heterogeneous Architectures used for performance evaluation: Intel Xeon Processor E5-2650 v2 with NVIDIA Tesla K20c, Zotac ZBOX CI521 with Intel Core M-5Y10c Broadwell, NVIDIA Tegra K1 with ARM Cortex A-15 on Jetson Eval. Board. We also listed the Epiphany-II 16 Core on Parallella Eval. Board for completion as there exists an implemenation of the algorithm for it.
In addition, the minimal flop/byte ratio is 0.25 and the optimistic estimate leads to a ratio of 5.33. The performance model is then evaluated with a heterogeneous mix of architectures. Tab.1gives an overview of the architectural properties of the investigated processing architecture along with a code-name which will be used throughout the remainder of this paper for reference. All of our evaluated architectures support SIMD instructions. Except for the Siegfried CPU, which is Ivy Bridge, we can rely on native FMA instructions. The Ivy Bridge architecture features, however, two pipelines with the ability of having two floating point vector operations scheduled per cycle, which is, for our algorithm, equivalent to a FMA instruction. With the exception of the Epiphany, 64 byte cache lines are available. The optimizations described in this section which should lead to a optimal flop/byte ratio, have been tested on all our evaluated platforms. They were not tested for the reference implementation on the Epiphany, as the results for that platform have been extracted from Reichenbach et. al. [6].
Fig.2shows the roofline for the CPU architectures. The Intel based processors are performing at∼90% (Siegfried) and∼83% and are very close to the estimated theoretical maximum. The discrepancy can be explained through the relatively small loop limits, which lead to additional pipeline stalls and less cache efficiency. This effect can be observed to a higher degree on the embedded ARM Cortex A15 processor. Running correlation algorithms on the evaluated CPU Architectures, is alwaysCompute Bound. The roofline for the evaluated accelerators can be seen in Fig.3. The Kepler GPU built into the Tegra-K1 SoC shows the best hardware utilization, while the more powerful NVIDIA K20 GPU is struggling with the relatively low parallelism compared to its massively parallel compute capabilities. Due to not having applied any of the above mentioned high level optimizations, there is little surprise that the performance of the Epiphany only lies within∼35% of its capabilities, is alwaysMemory Bound, with respect to the local memory.
4
Parallelization
This section discusses the impact of parallelization. By adding concurrency, an important factor is the ability of the application to cope with the necessary overheads introduced. Each parallelization tech-nique adds inevitable overhead related to intra thread synchronization, latency of creating the parallel work and potentially moving data to and from parallel devices. In order to overcome these overheads, the grain size, aka the amount of work to be executed by one parallel task, needs to be chosen
appropri-0.25 5.33 0 10 20 30 Maximum:29599Corr/s 26675.9 Corr./sec(90.13%) Maximum:10815.09Corr/s 6815.51 Corr./sec(63.02%) Maximum:22769Corr/s 18978 Corr./sec(83.35%) flops/byte thousand corrs
Siegfried (CPU) Tegra (CPU) Zotac
Figure 2: Roofline Model [8] for the evaluated CPUs 0.25 5.33 0 200 400 600 540777 Corr./sec(10.78%) Maximum:4.92·105Corr/s 91719.9 Corr./sec(18.65%) Maximum:45537Corr/s 16000 Corr./sec(35.14%) flops/byte thousand corrs
Siegfried (GPU) Tegra (GPU) Epiph.
Figure 3:Roofline Model [8] for Accelarators
ately to dominate the runtime [1].
When looking at our concrete algorithm from Fig.1and the derived performance metric, it is con-ceivable that the parallel overheads will dominate the useful work when we subidivide one of the loops into smaller chunks.
Fig.4gives a summary on the cycles needed for a TOA calculation. This is the traditional approach one would persue with OpenMP by adding a#pragma omp for. In addition, this will unnecessarily create an upper bound on the achievable scalability.
Architecture Corr/Sec Time/Correlation ARM Cortex A15 14,230 1.59μs NVIDIA Tegra K1/ShaderCore 2,705 3.16μs Intel Core M-5Y10c 9,107.5 4.98μs Xeon EP 29,599 11.38μs NVIDIA K20c/ShaderCore 1,992 2.64μs
Figure 4:Importance of grain size
In order to parallelize our application on a CPU we chose the HPX runtime system [5]. The HPX runtime system is a parallel C++ runtime system of any scale. Its close adherence to the C++ Standard [5] makes it both approachable by a large number of programmers and a future proof solution. By implementing the higher level C++ parallelism constructs and seamlessly extending them to distributed computing, the API is a perfect target for our parallelization strategies. As already laid out in the beginning, we cannot afford to parallelize a single correlation. Instead, one correlation operation will be grouped along with subsequent ones leading to a batch of a configurable size of batch iterations (see Fig.5). By using the HPX API, this formulation allows us to easily extend this embarassingly parallel algorithm into a distributed data structure likehpx::partitioned_vectorwhich allows us, by combining it with hpx::futurefor synchronization to implement a scalable and easy algorithm for processing any number of incoming signals in a distributed and loosely coupled computing system. The importance of the chosen number of batch iterations to control the grain size can be observed in Fig.6 and Fig.7. On the left end of the graph, it can be examined that we have too little parallelism to keep our CPU busy. while on the right end, the impact of too much parallelism can be observed. Once the number of batch iterations passes a certain threshold, the pervailing factor of the runtime are the overheads. The middle part completes the bathtub curve and a plateau of optimal performance can be detected which represents a range for possible numbers of grain sizes. After having determined the
while(!done) { std::vector<signal_t> x, y; do { x.push_back(read_x()); y.push_back(read_y()); }
while (x.size() < batches || done); hpx::apply(
[x, y](){
for(auto && vs: zip(x, y))
{
auto result = correlate(get<0>(x), get<1>(y));
store(result); }
}); }
// wait for stored results
Figure 5:Sketch of the parallelization strategy (batches of correlations). The execution of a batch is delayed until a threshold of vectors has been read. Once happened, the correlation of such a batch is being asynchronously computed. Once the algorithm is marked as finished, The stored results are waited upon.
4096 16384 65536 262144 1.04858x10⁶ 1000000 100000 10000 1000 100 50 10 1 Performance [Corr/Sec]
Grainsize as number of batch iterations Influence of Grainsize on CPU Implementation for 1,000,000 Correlations
Zotac Tegra Siegfried
Figure 6: Influence of Grainsize on CPU Imple-mentations for a run of 1,000,000 Correlations.
4096 16384 65536 262144 1.04858x10⁶ 1000000 100000 10000 1000 100 50 10 1 Performance [Corr/Sec]
Grainsize as number of batch iterations Influence of Grainsize on CPU Implementation for 1,000,000 Correlations
Zotac Tegra Siegfried
Figure 7: Influence of Grainsize on GPU Imple-mentations for a run of 1,000,000 Correlations
optimal grain size for a given architecture, Fig.8explores the achiveable speedup one can expect on a single system. Our implementation reaches a parallel efficiency of around 87% on Siegfried, and 85% on the ARM Cortex-A15 as well as above 80% on the Broadwell M (see Fig.9). This results highlights the performance portability of the HPX runtime system and its efficiency on embedded hardware.
4.1
CUDA Implementation
The correlation algorithm at hand lends itself to an implementation on GPGPUs: memory access patterns are regular and the majority of the calculations is represented by fused multiply-accumulate (FMACC) operations. Two specific challenges were face however: First, GPUs have a lower memory bandwidth to FLOPS ratio compared to CPUs. And second, the degree of parallelism exhibited by the problem may, depending on the problem size, not fully saturate the device. The key question when parallelizing with CUDA is how the workload is distributed among the thread-blocks and threads within a block. After evaluating different strategies we settled for the following: each thread computes the
0 2 4 6 8 10 12 14
PARALLEL SERIALGPUNO PARALLEL SERIAL PARALLEL SERIAL
Speedup
Speedup of Parallelization on CPU
Zotac Siegfried Tegra
Figure 8:Speedup of Parallelized Implementations
0 0.5 1 1.5 2 2.5 3 3.5
CPU GPU CPU GPU CPU GPU
Parallel Efficiency
Parallel Efficiency of Implementations
Zotac Siegfried Tegra
Figure 9:Parallel efficiency of Implementations
Shaders ... ... Signal Array Beacon Array ...
(a)Na¨ıve Access Pattern
Shaders ... ... Signal Array Beacon Array ...
(b)Warp-shuffle-based Access Pattern
Figure 10:Comparison of memory access patterns for CUDA-capable GPUs. In the na¨ıve pattern all threads of a warp will fetch the same element from the beacons array. While these can be efficiently cached, this still implies a high load on the GPU’s load/store units as this procedure implies one load per one FMACC. The shuffle-based algorithm performs more operations, but fewer memory transfers: all threads of a warp together load a consecutive part of the beacon array (e.g. elements 0...31). In the following 32 iterations each thread will then, one after another, broadcast its own beacon value via the new warp shuffle instructions (e.g. shfl()). This reduces the number of load instructions performed on the beacon array to321 of the original amount.
complete correlation for a unique pair of indices in the signal and beacon arrays. To reduce setup-costs of kernel start overheads each thread handles multiple iterations (i.e. different data sets). The grid size is determined by the total number of data sets: if higher numbers of iterations are calculated in parallel, this will increase device saturation (and hence efficiency), but also the latency with which the results will become available.
to Kepler- and Maxwell-based GPUs which leverages the so called warp-shuffle instructions, illustrated in Fig.10. These enable communication between different threads of a warp without taking a detour through shared or global memory. This is possible because threads of a warp are essentially just differ-ent lanes of a short-vector CPU. So, instead of loading the same data elemdiffer-ent via 32 threads of a warp, for every element of the beacons vector, we load 32 elements of the beacons vector via a single, consec-utive load operation. As each thread will then end up with just a single element of the beacons vector, we use the operation shfl()to broadcast elements to all vector lanes. This procedure implies that we had to unroll the inner loop by 32x, but that’s an optimization we already had in place anyway to increase intra-thread instruction-level-parallelism (ILP). This is possible by using different registers for accumu-lation and only doing the final accumuaccumu-lation at the end of the correaccumu-lation loop. We use eight different sets (result real0,result imagl0, . . . ,result real7,result imag7). The reason why this optimization is beneficial is that register write back latencies on GPUs are generally higher than on CPUs and the problem sizes we evaluated did not exhibit a high-enough degree of parallelism to hide these latencies through overlapping with other threads.
5
Energy and Performance Considerations
This section analyzes data that was achieved from iterative measurements of the correlation algorithm on the three different platforms, with a fixed problem size of 1,000,000 iterations. Since our application is constrained by requirements regarding portability and form factor, the energy characteristics of the different implementations different platforms are of interest, as can be seen in Fig.11. To no surprise a serial execution on the clusternode Siegfried clearly uses the most energy, which can be explained with respect to Fig.12: long runtime combined with high power dissipation means high energy usage. Zotac Zbox (Broadwell ULV) and Nvidia Tegra K1 (ARM Cortex A-15) have similar energy usages.
Obviously the Siegfried implementation achieves better performance than the low-power cpu
0 0.1 0.2 0.3 0.4 0.5
CPU GPU NO-HPX CPU GPU NO-HPX CPU GPU NO-HPX
2.22[Wh]
Energy in [Wh]
Energy to Solution for 1,000,000 Correlations on different Platforms
Zotac Siegfried Tegra
Figure 11:Energy to Solution in [Wh] for the cor-relation algorithm for 1,000,000 corcor-relations with an external device. 0 10 20 30 40 50 60
CPU GPU NO-HPX CPU GPU NO-HPX CPU GPU NO-HPX
150[s]
Time in [sec]
Time to Solution for 1,000,000 Correlations on different Platforms
Zotac Siegfried Tegra
Figure 12:Time to Solution in [s] for the three dif-ferent platforms for 1,000,000 correlations
mentations, both single core and parallel. The best overall performance is achieved with the Nvidia Tesla K20 of the Siegfried System, the Nvidia Tegra K1 does perform reasonably well with its GPU im-plementation, making it the fastest implementation of the embedded variants of the algorithm. Energy consumption and runtime do unfortunately lack information when it comes to comparing the different platforms regarding their energy efficiency. This becomes clear when considering results of the paral-lel version of the algorithm on the ARM Cortex A-15, which consumes the least energy but also has a very high runtime, introduced by the clock throttling and the low supply voltage of the A-15 when ran in multi-core mode. This effect was already stated in [3], and shows the necessity of another
met-ric to judge performance and energy-efficiency in one, as a sole observation of only one property is not enough. Horowitz et. al therefore introduce a fused metric called Energy Delay Product (EDP) in [3], built by multiplying the value of energy consumption of a given application with the runtime. An optimal platform would achieve a very low number if its EDP was compared to other platforms. The EDP facilitates identifying if a design or implementation or change of one of them is a trading off power for performance or vice versa or actually increasing the energy efficiency [2]. To evaluate our platforms we utilized EDP with two different weights, as has been stated by [4], WhereT =Runtime andW =W eight= 1,2:
E∗TW, E=Energy (8)
Fig.13shows the EDP when W equals one, which means that a low energy usage is prioritized. The GPU implementations of the algorithm perform best, with the Nvidia Tegra variant leading the score. It benefits from the floating point intensive algorithm as well as the low-power profile of its 192 CUDA cores. Closely after follows the parallelized CPU version on the Siegfried system. If, however, runtime is a priority, the results are different as Fig.14clearly indicates: Utilized with three or two as weight of the runtime, the Siegfried system achieves the best results for the EDP. While this shows how the EDP can be adapted by changing weights of the factors, to represent different constraint of real-world situations, it also demonstrates how these pre-made decisions can influence decisions regarding antenna size and portability, and helps ruling out inefficient solutions such as the Zotac system.
1 10 100 1000
CPU GPU NO-HPX CPU GPU NO-HPX CPU GPU NO-HPX
Energy Delay Product W=1
Energy Delay Product with W=1 for 1,000,000 Correlations on different Platforms
Zotac Siegfried Tegra
Figure 13:Energy Delay Product with W = 1 for a fixed problem size of 1,000,000 correlations.
1 10 100 1000 10000
CPU GPU NO-HPX CPU GPU NO-HPX CPU GPU NO-HPX
Energy Delay Product W=2
Energy Delay Product with W=2 for 1,000,000 Correlations on different Platforms
Zotac Siegfried Tegra
Figure 14:Energy Delay Product with W = 2 for a fixed problem size of 1,000,000 correlations.
6
Evaluation
The results of the Broadwell M and the ARM Cortex-A15 regarding TTS, ETS and EDP of both the serial and parallel are very similar in shape, with less efficiency than one would expect from a low-power architecture. In order to explain this, one has to consider section3, where we found that the parallel efficiency of the implementation was high. Because our application shows high parallel efficiency, an increase in energy consumption due to an increase of the number of active cores is still less than the increase of energy would be due to longer serial execution. As long as parallel efficiency is high the runtime of the application will roughly directly proportional decrease with the number of cores, while power dissipation on the other hand does not increase directly proportionally with the number of cores. But this favorable effect diminishes when the number of active cores is only one or two, which is true for the Broadwell ULV processor which consists of only 2 cores. Additional Speed throttling when under full load (due to its thermal budget), is also increasing the runtime of a parallel program compared to a serial implementation. Benefits through Hyperthreading could not be established, this can be explained by the very few number of pipeline stalls in the optimized code. The same observation can be made
for the CPU implementation on the Nvidia Tegra K1, although the benefit in runtime is here more significant. Better characteristics were found on the Tegra K1 or the Siegfried, which expose the lowest EDPs, thus being the implementations with the highest energy efficiency. The CUDA implementation is the implementation with the best performance for the embedded architectures. This can be explained due to the Kepler Architecture that is very well suited to the floating point intensive correlation algorithm, as well as our optimization steps employed in Sec.4.
7
Conclusion
In conclusion, we have shown that our approach can help existing systems which are not primarily de-signed for energy-efficiency, to achieve energy efficiency as well as take advantage of current multi- and many-core architectures. After discussion of the results and efficiency of the parallelization in Sec.4we can state that employing runtimes such as HPX on embedded architectures is feasible, and will likely expect growth, as the number of multi-core embedded processor will likely rise. Heterogeneous archi-tectures promise some interesting work in the future, where combined systems featuring smart antennas with energy efficient solutions such as the Tegra K1 might further shrink the profile of locating systems such as the RedFIR.
AcknowledgmentThis work was developed in the context of Leistungszentrum Elektroniksysteme, funded by the Bayrisches Staatsministerium f¨ur Wirtschaft und Medien, Energie und Technologie.
References
[1] Patricia Grubel, Hartmut Kaiser, Jeanine Cook, and Adrian Serio. The Performance Implication of Task Size for Applications on the HPX Runtime System. InWorkshop on Monitoring and Analysis for High Performance
Computing Systems Plus Applications (HPCMASPA 2015), IEEE Cluster 2015, September 2015.
[2] Gonzales Horowitz, Indermaur. Low-power digital design. pages 8–11, October 1994.
[3] Gonzalez Horowitz. Energy dissipation in general purpose microprocessors. IEEE Journal of solid-state
circuits, 31(9):1277–1284, September 1996.
[4] H Laros James III, Courtenay Vaughan, Kurt Ferreira, Wei Shu, Sue Kelly, John Vandyke, and Kevin Pedretti. Energy-efficient high performance computing. 2012.
[5] Hartmut Kaiser, Thomas Heller, Bryce Adelstein-Lelbach, Adrian Serio, and Dietmar Fey. HPX: A task based programming model in a global address space. InProceedings of the 8th International Conference on
Parti-tioned Global Address Space Programming Models, PGAS ’14, pages 6:1–6:11, New York, NY, USA, 2014.
ACM.
[6] Marc Reichenbach, Max Kasparek, Mohammad Alawieh, Konrad Hublein, and Dietmar Fey. Real-time cor-relation for locating systems utilizing heterogeneous computing architectures. InElectronic Chips and System design initiative (ECSI) (Org.): Proceedings of the 2015 Conference on Design an Architectures for Signal an
Image Processing, pages 1–8, 2015.
[7] Andreas Schafer and Dietmar Fey. Zero-overhead interfaces for high-performance computing libraries and kernels. InHigh Performance Computing, Networking, Storage and Analysis (SCC), 2012 SC Companion:, pages 1139–1146. IEEE, 2012.
[8] Samuel Williams, Andrew Waterman, and David Patterson. Roofline: An insightful visual performance model for multicore architectures.Commun. ACM, 52(4):65–76, April 2009.

![Figure 3: Roofline Model [8] for Accelarators](https://thumb-us.123doks.com/thumbv2/123dok_us/10113547.2911915/6.816.106.342.112.326/figure-roofline-model-for-accelarators.webp)

![Figure 11: Energy to Solution in [Wh] for the cor- cor-relation algorithm for 1,000,000 corcor-relations with an external device](https://thumb-us.123doks.com/thumbv2/123dok_us/10113547.2911915/9.816.433.707.592.773/figure-energy-solution-relation-algorithm-corcor-relations-external.webp)

