Student Satisfaction Survey
Student Satisfaction Survey
Student Satisfaction Survey
Student Satisfaction Survey
REPORT
Department of Institutional Research
KIMEP UNIVERSITY 2013
KEY MESSAGE
The regular Student Satisfaction Survey, measuring the level of students’ satisfaction with their experiences at
KIMEP, was conducted during March 15 – April 7.
The total number of survey participants in Spring 2013 comprised 1659 persons. Among them, 712 students
answered all sections of the questionnaire, 750 - answered at least one section of the questionnaire and the
rest 197 - refused to answer. The respondents’ pool (1462 students) is mainly presented by: undergraduates
(83%), females (~61%) and residents of Kazakhstan (88%). In current year results, KIMEP-wide level of
satisfaction is 4.02 out of 5, in previous year it was 3.79.
Majority of respondents are satisfied with implementation of University’s main responsibilities: provision of
good academic programs; adherence to the principles of academic integrity; professional management and
fulfillment of mission - 79%; 76%; 74% and 75% accordingly. Also students feel confident about their future
employment and recommend KIMEP to their friends: 77% and 78% respectively. Current year’s assessments of
all above aspects are higher than those demonstrated in 2012: 72%; 69%; 69%, 68% and 71%; 74% accordingly.
Among the various KIMEP services, students are most satisfied with the work of
Recruitment
and
Admission
(4.14 each), as well as
Registration
and
Medical Center
(4.11 each). The least satisfactory areas are
Catering
(3.60),
KIMEP Student Association
(3.78),
Dormitory
(3.91) and
Financial Aid
(3.93).
Bachelors’ satisfaction (4.04) with KIMEP services is higher than that of masters (3.94). Students from
Kazakhstan (4.04) and CIS countries (3.95) give higher grades than those from far abroad (3.83).
About quarter of respondents (326; 22%) provided answers to open ended questions on KIMEP strengths (471
messages in 313 comments) and weaknesses (356 messages in 265 comments).
Review of messages on KIMEP strengths revealed that
‘Good quality of teaching’
(17%),
‘High quality of
education’
(13%) and
‘English language of instruction’
(
~
8%) were considered as the main strengths.
Among messages on KIMEP weaknesses,
‘High tuition and other payments’
(25%),
‘Inconsistent quality of
teaching’
(
~
10%) and
‘Weak financial aid’
(
~
6%) were the most frequently mentioned ones.
Comparison of 2009-13 results shows that during this period students mostly continued appreciating and
criticizing the same things.
Top-10 items. Aspects, repeatedly appreciated during the five-year period, include:
‘On-line registration’,
‘Web-accessible student information’, ‘Library and information resources’, ‘Appreciation for own academic
program’, ‘Library staff’, ‘Admission information’, ‘Ability to meet challenges of employment and future life’,
‘Willingness to recommend KIMEP’.
Two other items from this year’s top-list - friendliness and helpfulness of
‘Recruitment team’
and
‘Advising
offices' staff’
- have been indicated for the first time during the observed period.
Bottom-10 items. From 2009 to 2013 students were frequently most critical about KIMEP Grill’s
‘Quality of
food’, ‘Prices’ acceptability’, ‘Environment’, ‘Staff’
and
‘Menu variety’,
as well as about KSA’s
‘Commitment to
students’ interests’
,
‘Honesty and integrity’, ‘Readiness to inform students on progress’
and
‘Willingness to
understand and represent students views’
.
This year’s list of bottom-10 items also includes
‘Number of catering services on campus’
, which is the first case
during the observed five-year period.
Analysis of comments provided between 2009-13 demonstrates that during the last five years, KIMEP students
continually indicate
‘Quality of teaching’
,
‘Quality of education’
and
‘English language of instruction’
as the
strengths of KIMEP.
‘
High tuition and other payments’
and ‘
Weak quality of teaching by some faculty members’
are continually
indicated as the weaknesses.
To further enhance KIMEP services to students and, thus, to increase the level of student satisfaction, the
following suggestions could be made:
•
building on above mentioned existing strengths
•
reviewing the issues of continued concern: level of tuition and other payments, inconsistent quality of
teaching by some faculty members, services of KIMEP Grill, KSA effectiveness and dormitory conditions.
CONTENT
KEY MESSAGE
SURVEY BACKGROUND
Purpose
4
Technique
4
Data treatment
4
RESULTS
Response rate
4
Overall satisfaction
4
Main trends
4
Areas of appreciation
5
Areas of concern
5
Comments analysis
5
COMPARISON OF SSS RESULTS 2009-12
Purpose
6
Technique
6
Numerical results analysis
6
Comments analysis
6
Attachment 1. Questionnaire
17
Attachment 2. Tables
18
SURVEY BACKGROUND
Purpose.
The Student Satisfaction Survey aims to measure the level of students’ satisfaction with their
experiences at KIMEP to support strategic planning and decision-making for further improvement of University
services to students.
Technique.
The online survey was conducted during March 15 – April 7 on an anonymous and voluntary basis.
Technical support in data gathering and treatment was rendered by the CISC. The survey employed a slightly
revised instrument approved by AVPAA in March 2013: due to lost relevance, Q15 ‘Form of payment’ was
removed from previously employed questionnaire. The current instrument includes 2 open questions and 65
multiple-choice ones (based on 5-point Likert scale;
att. 1
).
To allow greater flexibility in survey participation and, thus, stimulate students’ involvement, this year’s survey
introduced the option to formally ‘refuse’ filling selected sections of the questionnaire, instead of previous
option to ‘skip’ the entire survey.
The standard information campaign ran under the slogan “Take your opportunity to be heard”, employing
announcements on website, in social networks and in Student Portal; e-mails to students and LCD
presentations.
Data treatment.
Students’ inputs to online survey were stored in SQL server and further processed and
analyzed using Excel Pivot Tables tools. Average grades were counted according to the principle of weighed
averages.
RESULTS
Respondents’ pool.
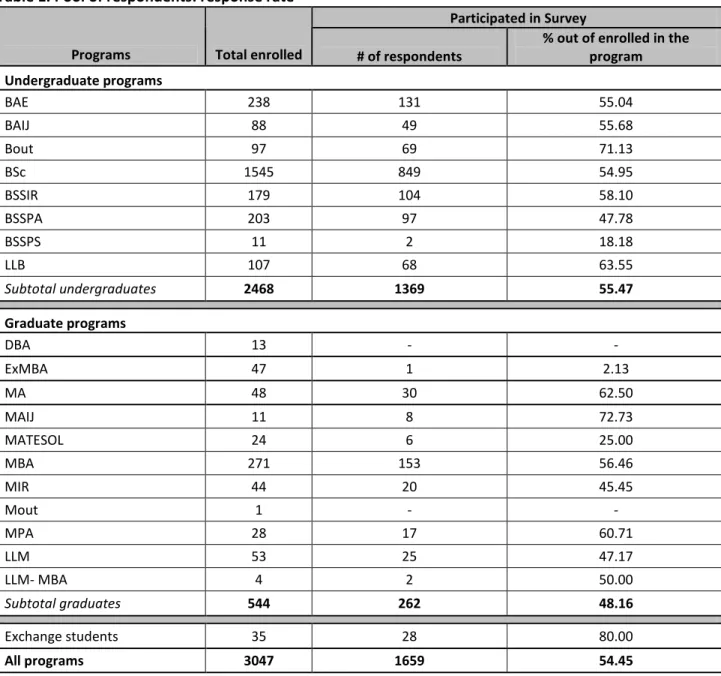
The survey participation rate comprised 54.45%: 1659 students accessed the survey page
out of total 3047 students registered in Spring 2013 (
att. 2, table 1
).
Among 1659 participated persons, 197 students (~12%) entirely refused to answer questionnaire.
The rest 1462 participants answered at least one section of the questionnaire and will further be referred to as
the total pool of respondents (
att. 2, table 2
).
By number of respondents, sections
Form of Payment,
Registration
and
Admission
received the largest
feedback - 1341, 1335 and 1287 respondents correspondingly. The smallest feedback was provided with
regard to sections
Dormitory
and
KIMEP Student Association -
952 and 990 respondents correspondingly (
att.
2, table 4
)
Three hundred twenty six respondents (22% of 1462) provided comments on two open-ended questions (
att.
2, table 14
).
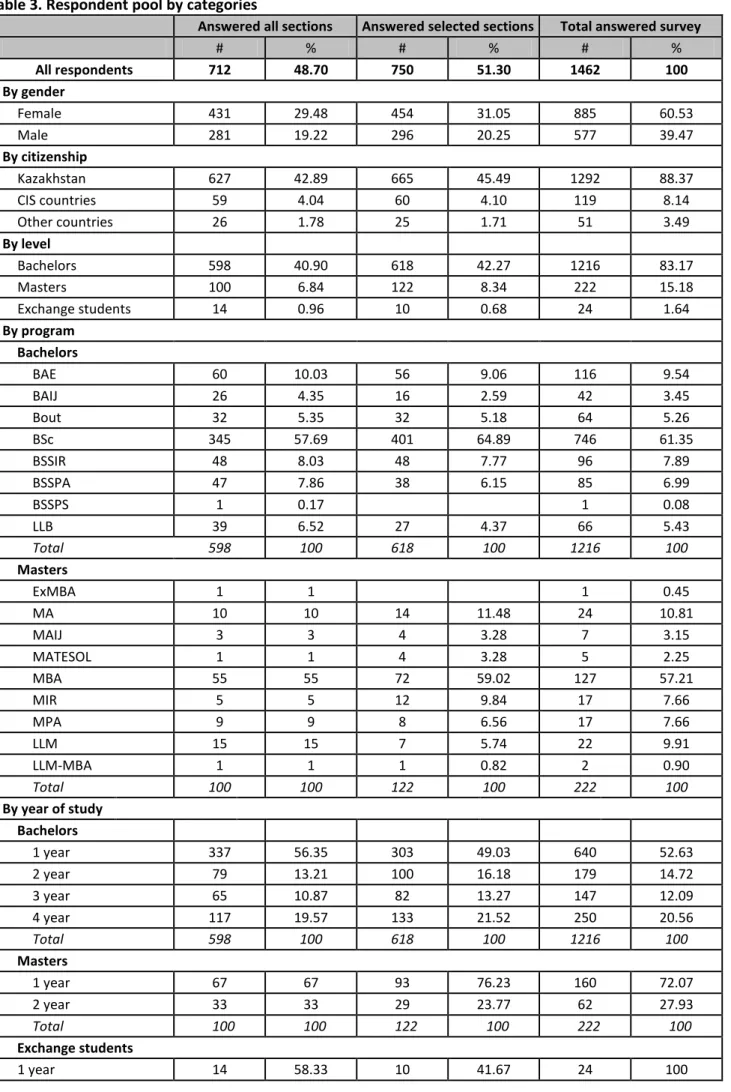
The respondents’ pool is mainly represented by undergraduates (83%), females (~61%) and residents of
Kazakhstan (88%). Among students of undergraduate programs, BSc students present the larger share (61%);
among graduates - MBA students (57%). Majority of respondents on both levels are freshmen (~53% on
undergraduate level and 72% - on graduate one;
att. 2, table 3
).
Overall satisfaction.
KIMEP-wide level of satisfaction comprises 4.02 out of 5 (
att. 2, table 5
). It is relatively
higher compared to last year’s result of 3.79.
Majority of respondents are satisfied with fulfillment of University’s main responsibilities outlined in cluster
General assessment
(Qs60-65)
.
These include provision of good academic programs (Q60, ~79%) and
adherence to the principles of academic integrity, professional management and fulfillment of mission
(Qs62-64, ~76%, 74% and 75% correspondingly). Students feel confident about employment and future life (Q61,
77%) and recommend KIMEP to their friends (Q65, 78%;
graph 1; att. 2, table 5
).
Main trends
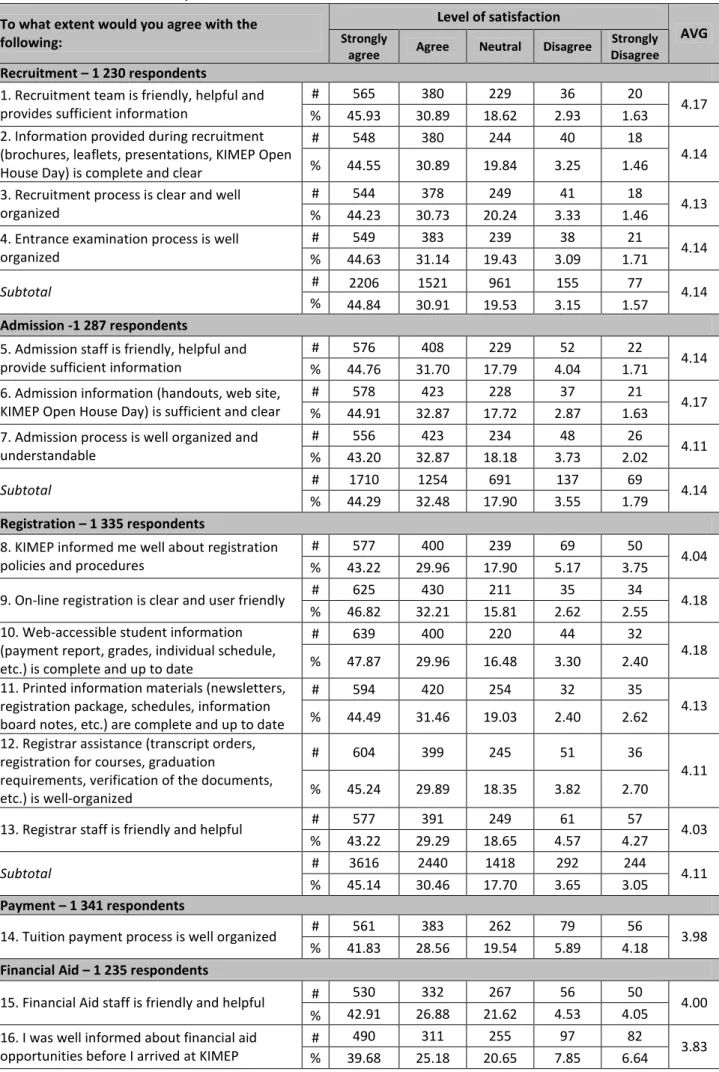
The most appreciated KIMEP services are
Recruitment
(4.14)
,
Admission
(4.14),
Registration
(4.11) and
Medical
Center Facilities
(4.11). The least appreciated ones are
Catering
(3.60),
KIMEP Student Association
(3.78),
Dormitory
(3.91) and
Financial Aid
(3.93). The evaluations of the rest of services -
Study and Support Facilities,
Academic Programs/Units, Advising/Internship, Sports Complex, Learning Environment, Student Center
and
Payment
services - range between 4.10-3.98 (
graph 2; att. 2, table 5)
.
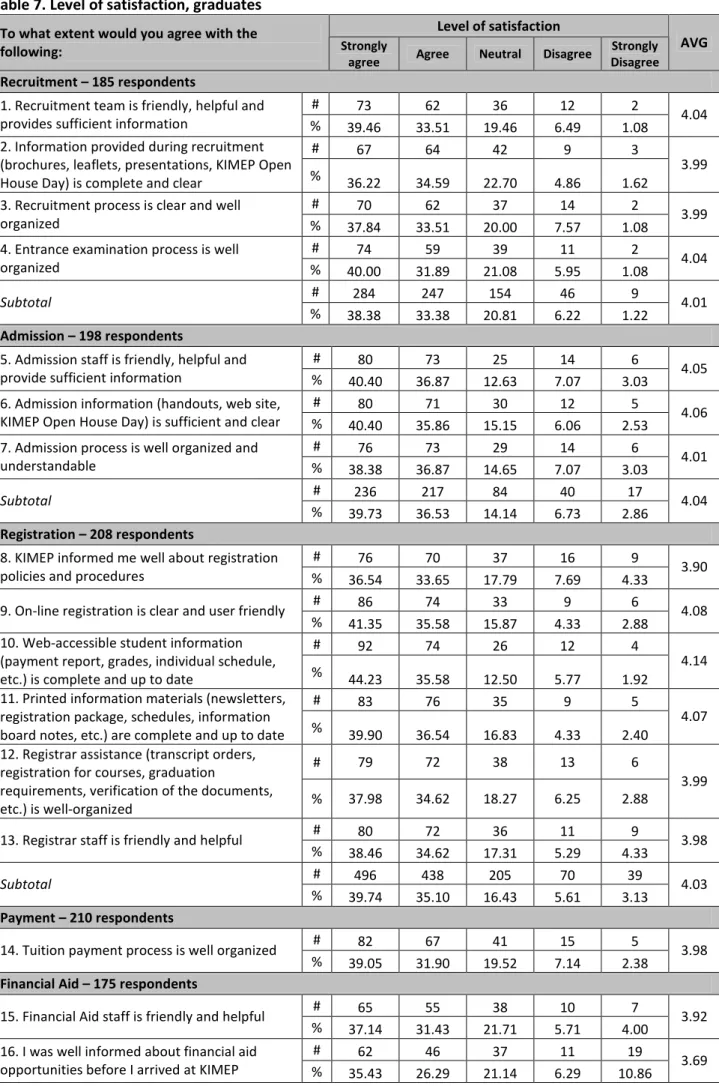
By levels, both bachelors and masters express appreciation and concern with the same services as KIMEP-wide
trend discussed above. Exception is the lower level of satisfaction with
Medical Center Facilities
(3.94)
by
graduates. In general, bachelors are more satisfied with KIMEP academic and non-academic services than
masters are (
graph 2; att. 2, tables 6-7).
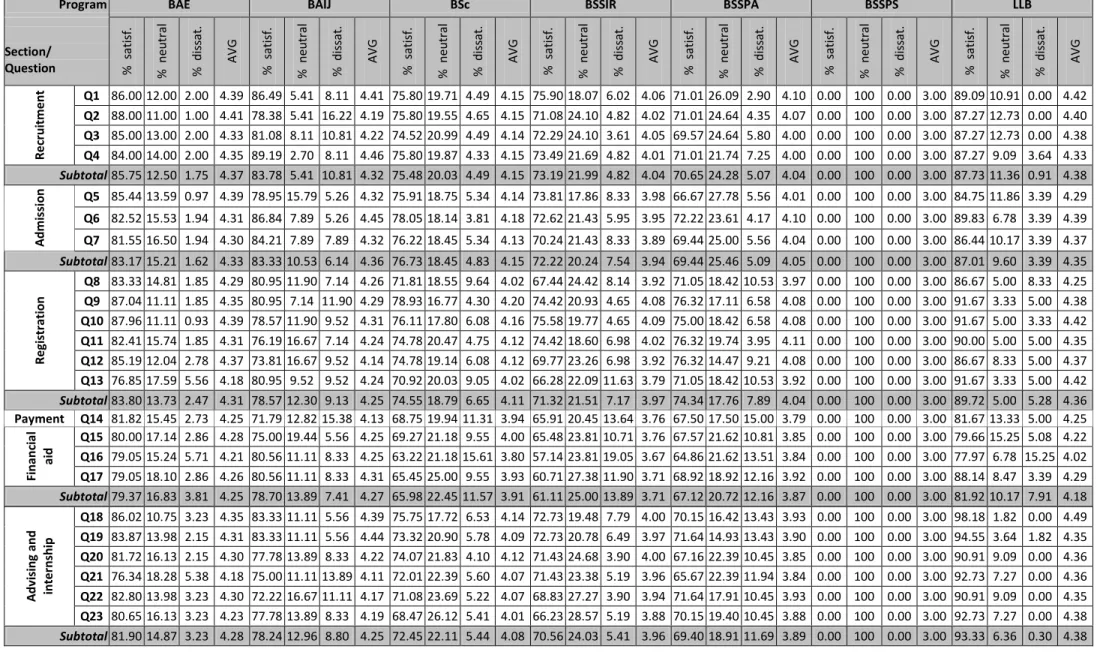
Among undergraduate programs, the highest level of overall satisfaction is demonstrated by LLB students
(4.29) and the lowest – by BSSPS ones (3.00;
att. 2, table 8
).
Regarding separate services, the assessment of KIMEP U services by BCB and CSS undergraduates follows the
KIMEP-wide trend, while the assessments by LLB students are relatively higher than the general trend. In
addition to the services appreciated by students of all undergraduate programs, LLB students also appreciate
Study and Support Facilities, Student Center, Advising/Internship
and
Learning Environment
(
graphs 3-4
;
att. 2,
table 8
).
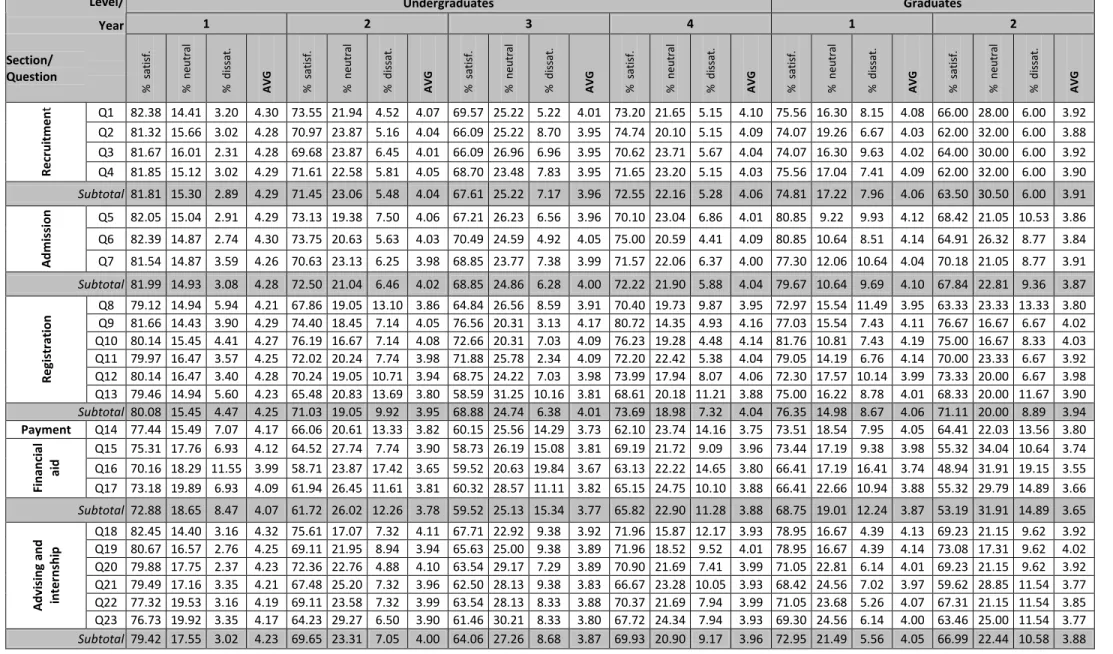
By year of study, first year bachelors demonstrate highest overall satisfaction (4.16) among undergraduates.
Third year bachelors are the least satisfied ones (3.84;
graph 5; att. 2, table 10
).
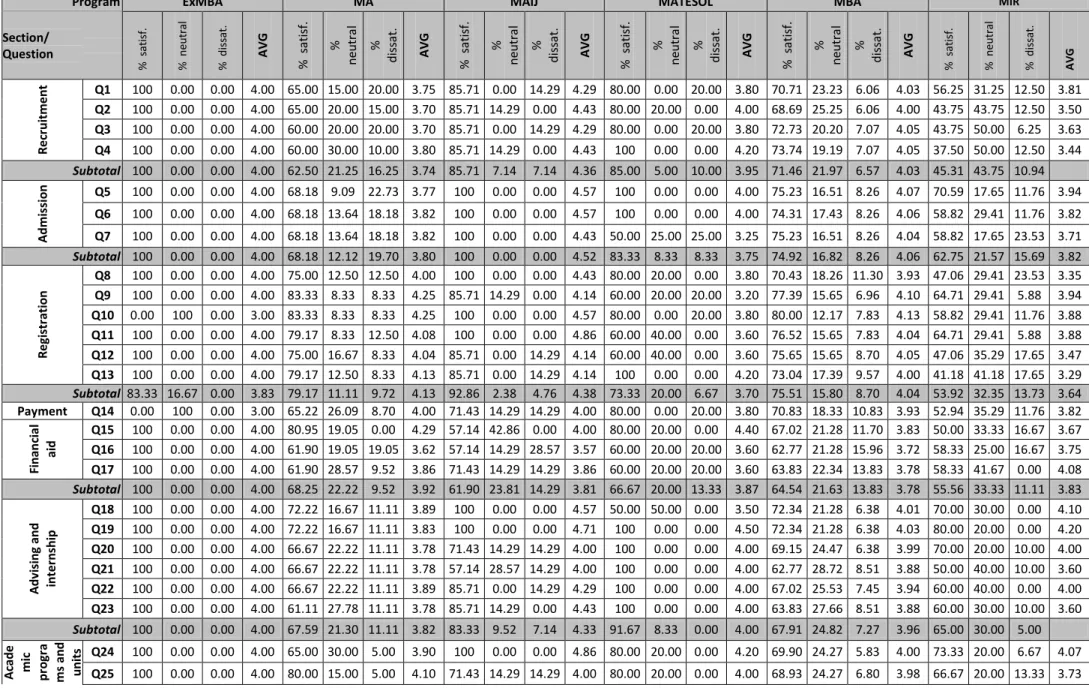
As for graduate programs, MAIJ students show highest overall satisfaction rate (4.36), while MIR – the lowest
one (3.58,
graph 6; att. 2, tables 9a-9b)
. First year masters (4.01) are more satisfied than the second year ones
(3.77;
graph 7; att. 2, table 10
).
Grouped according to permanent residence, students from Kazakhstan are more satisfied with KIMEP U
services, compared to students from CIS and students from other countries (4.04, 3.95 and 3.83;
graph 8; att.
2, table 11
).
Areas of appreciation
Within four services most appreciated by students KIMEP-wide, the following features are especially valued:
‘
Web-accessible student information’
and ‘
On-line registration’
(4.18 each, Qs9-10 within
Registration
),
‘
Recruitment team’
(4.17, Q1 within
Recruitment
), ‘
Admission information’
(4.17, Q6 within
Admission
), and
‘
Medical center staff’
(4.12, Q41 within
Medical center; graph 9
).
Areas of concern
Among the services indicated as the weaker ones, respondents are particularly displeased with the following
features:
‘The quality of food in KIMEP Grill’
(3.48, Q52 within
Catering
), ‘
Regularly
informing about KSA’s
progress in key areas’
(3.77, Q58 within
KIMEP Student Association
), and
‘Cleanliness, furnishing and
renovation of dormitory’
(3.82, Q37 within
Dormitory; graph 10
).
Comments analysis
The respondents provide 471 messages on KIMEP strengths (313 comments) and 356 messages on
weaknesses (265 comments). Comments with no opinion (like ‘don’t know’, ‘no’ ‘nothing’, etc – 51) are not
included into analysis.
Among 471 messages on KIMEP strengths,
Good quality of teaching
,
High quality of education
and
English
language of instruction
are mentioned most often (17%, 13% and 8% messages accordingly;
graph 11
;
att. 2,
table 12
;
att. 3, table 1
).
Among indicated 356 weaknesses
High tuition and other payments
,
Contested quality of teaching
and
Weak
financial aid
are named most frequently (25%, 10% and 6% messages respectively;
graph 12
;
att. 2, table 12;
att. 3, table 2
).
COMPARISON OF SSS RESULTS 2009-13
Purpose
To identify the dynamics of students’ satisfaction during the last five years
*.
Numerical results analysis
Comparison of 2009-13 results (
att. 2, table 13
) shows that during this period students continued appreciating
and criticizing the same aspects of the KIMEP U student life.
Top-10 items
•
‘On-line registration’, ‘Web-accessible student information’, ‘Library and information resources’
and
‘Appreciation for own academic program’
have been among 10 most satisfactory aspects throughout the
five-year period observed (
att. 2, table 13
).
•
‘Library staff’
and
‘Admission information’
entered the list of top-10 items four times during the last five
years (
att. 2, table 13
).
•
Students’ confidence in own
‘Ability to meet challenges of employment and future life’
and their
‘Willingness to recommend KIMEP’
were indicated among 10 most appreciated aspects in three surveys
out of five (
att. 2, table 13
).
•
Friendliness and helpfulness of
‘Recruitment team’
and
‘Advising offices' staff’
entered this year’s list of
top-10 items for the first time during the observed period (
att. 2, table 13
).
Bottom-10 items
•
KIMEP Grill’s
‘Quality of food’, ‘Prices’ acceptability’
and
‘Environment’
have been among the least
satisfactory aspects throughout the five-year period, while its’
Staff’
and
‘Menu variety’
– throughout the
last four years (
att. 2, table 13
).
•
KSA’s
‘Commitment to students’ interests’
,
‘Honesty and integrity’
and
‘Readiness to inform students on
progress’
were indicated as the weak items four times during the last five years, while KSA’s
‘Willingness to
understand and represent students views’
– three times (
att. 2, table 13
).
•
This year’s list of bottom-10 items also includes
‘Number of catering services on campus’
, which is the first
case during the observed five-year period (
att. 2, table 13
).
Comments analysis
The content of student comments received in 2009-13 were compared according to traditional distribution of
themes and topics.
During the observed period, KIMEP students continuously indicated the following items as the strengths of
KIMEP:
‘Quality of teaching’
,
‘Quality of education’
and
‘English language of instruction’
(
graph 14
;
att. 2, table
15
).
As for weaknesses, students continuously regard ‘
High tuition and other payments’
as well as ‘
Quality of
teaching’
as the weaker aspects of KIMEP University (
graph 15
;
att. 2, table 16
).
Quality of teaching
mostly
refers to low professionalism of particular faculty members, lack of faculty commitment to student’s learning
and weakness of knowledge received.
The issue of
‘Corruption and lack of academic integrity’
in 2013 was not named at all. During 2009-2012 its
share of mentioning fluctuated from 0.97% up to 5.47% with the highest peak in 2010 and lowest - in 2011
(
att. 2, table 16
).
*
Graph 1. Satisfaction with main KIMEP features
77.99 75.00 74.43 75.73 77.10 78.88 16.99 18.93 19.01 18.85 17.80 15.94 5.02 6.07 6.55 5.42 5.10 5.18 0% 100%Satisf ied Neutral Dissatisf ied
Q 60. I enjoy my academic program Q61. I am confident that I can meet the challenges of employment and future life Q62. KIM EP encourages academic integrity
Q63. KIM EP is managed profes s ionally Q64. KIM EP fulfills its mis s ion
Q65. I would recommend KIM EP to a friend
Graph 2. Satisfaction levels KIMEP-wide and by study levels
3.50 4.20 R e c ru itm e n t A d m is s io n R e g is tr a tio n P a y m e n t F in a n c ia l A id A d v is in g a n d I n te rn s h ip A c a d e m ic p ro g ra m s a n d u n its S tu d y a n d S u p p o rt F a c ili tie s L e a rn in g E n v ir o n m e n t D o rm ito ry M e d ic a l C e n te r F a c ili tie s S p o rt s C o m p le x F a c ili tie s S tu d e n t C e n te r C a te ri n g K IM E P S tu d e n t A s s o c ia tio n G e n e ra l Undergraduates Graduates KIMEP-w ide
Graph 3. Satisfaction levels by undergraduate programs, KIMEP-wide and by Colleges
3.50 3.85 4.20 R e c ru it m e n t A d m is s io n R e g is tr a tio n P a y m e n t F in a n c ia l A id A d v is in g a n d In te rn s h ip A c a d e m ic P ro g ra m s a n d U n it s S tu d y a n d S u p p o rt F a c ili ti e s L e a rn in g E n v ir o n m e n t D o rm it o ry M e d ic a l C e n te r F a c ili tie s S p o rt s C o m p le x F a c ili tie s S tu d e n t C e n te r C a te ri n g K IM E P S tu d e n t A s s o c ia ti o n G e n e ra l CSS BCB KIMEP-wideGraph 4. Satisfaction levels by undergraduate programs, KIMEP-wide vs. LLB
3.50 4.00 4.50 R e c ru it m e n t A d m is s io n R e g is tr a tio n P a y m e n t F in a n c ia l A id A d v is in g a n d In te rn s h ip A c a d e m ic P ro g ra m s a n d U n it s S tu d y a n d S u p p o rt F a c ili ti e s L e a rn in g E n v ir o n m e n t D o rm it o ry M e d ic a l C e n te r F a c ili tie s S p o rt s C o m p le x F a c ili tie s S tu d e n t C e n te r C a te ri n g K IM E P S tu d e n t A s s o c ia ti o n G e n e ra l LLB KIMEP-wide
Graph 5. Undergraduates’ levels of satisfaction by years of study
3.20 3.75 4.30 R e c ru itm e n t A d m is s io n R e g is tr a tio n P a y m e n t F in a n c ia l A id A d v is in g a n d I n te rn s h ip A c a d e m ic p ro g ra m s a n d u n its S tu d y a n d S u p p o rt F a c ili tie s L e a rn in g E n v ir o n m e n t D o rm ito ry M e d ic a l C e n te r F a c ili tie s S p o rt s C o m p le x F a c ili tie s S tu d e n t C e n te r C a te ri n g K IM E P S tu d e n t A s s o c ia tio n G e n e ra l 1 2 3 4Graph 6. Satisfaction levels of graduate programs
2.50 3.75 5.00 R e c ru it m e n t A d m is s io n R e g is tr a tio n P a y m e n t F in a n c ia l A id A d v is in g a n d In te rn s h ip A c a d e m ic p ro g ra m s a n d u n it s S tu d y a n d S u p p o rt F a c il it ie s L e a rn in g E n v ir o n m e n t D o rm it o ry M e d ic a l C e n te r F a c ili tie s S p o rt s C o m p le x F a c ili tie s S tu d e n t C e n te r C a te ri n g K IM E P S tu d e n t A s s o c ia ti o n G e n e ra l
MA MAIJ MIR MPA
3.10 3.75 4.40 R e c ru it m e n t A d m is s io n R e g is tr a tio n P a y m e n t F in a n c ia l A id A d v is in g a n d In te rn s h ip A c a d e m ic p ro g ra m s a n d u n it s S tu d y a n d S u p p o rt F a c il it ie s L e a rn in g E n v ir o n m e n t D o rm it o ry M e d ic a l C e n te r F a c ili tie s S p o rt s C o m p le x F a c ili tie s S tu d e n t C e n te r C a te ri n g K IM E P S tu d e n t A s s o c ia ti o n G e n e ra l CSS MBA LLM
Graph 7. Graduates’ level of satisfaction by years of study
3.30 3.75 4.20 R e c ru it m e n t A d m is s io n R e g is tr a tio n P a y m e n t F in a n c ia l A id A d v is in g a n d In te rn s h ip A c a d e m ic p ro g ra m s a n d u n it s S tu d y a n d S u p p o rt F a c il it ie s L e a rn in g E n v ir o n m e n t D o rm it o ry M e d ic a l C e n te r F a c ili tie s S p o rt s C o m p le x F a c ili tie s S tu d e n t C e n te r C a te ri n g K IM E P S tu d e n t A s s o c ia ti o n G e n e ra l 1 2Graph 8. Satisfaction levels by permanent residence
3.30 3.75 4.20 R e c ru it m e n t A d m is s io n R e g is tr a tio n P a y m e n t F in a n c ia l A id A d v is in g a n d In te rn s h ip A c a d e m ic p ro g ra m s a n d u n it s S tu d y a n d S u p p o rt F a c il it ie s L e a rn in g E n v ir o n m e n t D o rm it o ry M e d ic a l C e n te r F a c ili tie s S p o rt s C o m p le x F a c ili tie s S tu d e n t C e n te r C a te ri n g K IM E P S tu d e n t A s s o c ia ti o n G e n e ra l
Graph 9. KIMEP-wide areas of appreciation
4.10 4.11 4.12 4.03 4.04 4.11 4.13 4.18 4.18 4.11 4.14 4.17 4.13 4.14 4.14 4.17 4.00 4.20Timely medical support Timely processing of medical documents Medical Center staff Registrar staff KIMEP informed about registration policies Registrar assistance Printed information materials On-line registration Web-accessible student information Admission process Admission staff Admission information Recruitment process Information provided during recruitment Entrance examination process Recruitment team M e d ic a l C e n te r R e g is tr a ti o n A d m is s io n R e c ru it m e n t
Service Aspect Average grade
Graph 10. KIMEP-wide areas of concern
3.97 3.94 3.93 3.82 3.79 3.79 3.78 3.77 3.81 3.66 3.59 3.53 3.51 3.48 3.40 4.00
Living in the dormitory is secure and safe The costs of living Dormitory staff Dormitory is clean, well furnished and renovated KSA shows strong commitment to student interests KSA willingness to understand and represent views KSA behaves honestly and with integrity KSA regularly informs on progress in key areas There are enough catering services on campus KIMEP Grill staff The environment in KIMEP Grill is pleasant KIMEP Grill has appropriate menu variety The prices in KIMEP Grill are acceptable The quality of food in KIMEP Grill is good
D o rm it o ry K IM E P S tu d e n t A s s o c ia ti o n C a te ri n g
Graph 11. SSS 2013 messages on KIMEP strengths
1.49% 2.55% 2.34% 3.40% 6.16% 2.34% 2.76% 3.18% 3.61% 17.41% 0.85% 2.97% 7.64% 7.86% 2.76% 4.46% 4.67% 5.10% 5.10% 13.38% Quality of education Image of KIM EP Overall positive opinion Administration and management General opinion Career and other perspectives English language of instruction Western style of education Individual scheduling Credit system Quality of teaching Academic integrity and absence of corruption Academic/exchange programs and internship opportunities Library Courses and Course M anagement Pleasant environment Students Student organizations Learning facilities Other facilities G en er al o p in io n W es te rn s ty le o f ed u ca ti o n A ca d em ic i ss u es S tu d en ts ’ li fe F ac il it ie sGraph 12. SSS 2013 messages on KIMEP weaknesses
5.62% 0.84% 1.12% 1.12% 2.25% 3.09% 4.21% 4.49% 1.12% 1.12% 1.69% 1.12% 1.12% 1.12% 2.25% 2.53% 4.49% 5.06% 9.55% 0.84% 1.97% 0.84% 1.40% 2.53% 3.09% 4.21% 4.49% 25.28% Overall disappointmentAdministration and management Staff KIMEP image/ visibility Bureaucracy Quality of education English language Flexibility of scheduling Quality of teaching Other academic issues Courses and Course Management Computer equipment, laboratories and Wi-Fi Library Lack of (foreign) faculty members Office of the Registrar Academic Advising KIMEP Students Association Students Other student organizations Catering Dormitory Other facilities Learning facilities Security Heating Sport Center Tuition and other payments Financial Aid G e n e ra l o p in io n W e st e rn st y le o f e d u c a ti o n A c a d e m ic i ss u e s S tu d e n ts ' l if e F a c il it ie s F in a n c ia l is su e s
Graph 13. SSS 2009-13 satisfaction levels
3 4.3 Q1 Q2 Q3 Q4 Q5 Q6 Q7 Q8 Q9 Q10 Q11 Q12 Q13 Q14 Q15 Q16 Q17 Q18 Q19 Q20 Q21 Q22 Q23 Q24 Q25 Q26 Q27 Q28 Q29 Q30 Q31 Q32 Q33 Q34 Q35 Q36 Q37 Q38 Q39 Q40 Q41 Q42 Q43 Q44 Q45 Q46 Q47 Q48 Q49 Q50 Q51 Q52 Q53 Q54 Q55 Q56 Q57 Q58 Q59 Q60Q61 Q62Q63 Q64Q65 2009 2010 2011 2012 2013Graph 14. SSS 2009-13 comments on strengths
0 6 11 17 22 Q u a lit y o f te a c h in g L ib ra ry A c a d e m ic in te g ri ty a n d a b s e n c e o f c o rr u p tio n O th e r a c a d e m ic is s u e s C o u rs e s a n d c o u rs e m a n a g e m e n t E n g lis h la n g u a g e o f in s tr u c tio n In d iv id u a l s c h e d u lin g O th e r C re d it s y s te m O n lin e re g is tr a tio n s y s te m G ra d in g s y s te mAcademic issues Western style of education
% o u t o f a ll m e s s a g e s o n s tr e n g th s 2009 2010 2011 2012 2013 0 5 10 15 Q u a lit y o f e d u c a tio n Im a g e o f K IM E P C a re e r a n d o th e r p e rs p e c tiv e s A d m in is tr a tio n a n d m a n a g e m e n t O v e ra ll p o s iti v e o p in io n P le a s a n t e n v ir o n m e n t S tu d e n ts S tu d e n t o rg a n iz a tio n s L e a rn in g fa c ili tie s O th e r fa c ili tie s
General opinion Student life Facilities
Graph 15. SSS 2009-13 comments on weaknesses
0 5 10 15 20 Q u a lit y o f te a c h in g C o u rs e s a n d c o u rs e m a n a g e m e n t C o rr u p tio n a n d la c k o f a c a d e m ic in te g ri ty O th e r a c a d e m ic is s u e s A d m is s io n re q u ir e m e n ts L ib ra ry A c a d e m ic A d v is in g C o m p u te r la b o ra to ri e s a n d W i-F i O n lin e re g is tr a tio n s y s te m E n g lis h la n g u a g e F le x ib ili ty o f s c h e d u lin gAcademic issues Western style of education
% o u t o f a ll m e s s a g e s o n w e a k n e s s e s 2009 2010 2011 2012 2013 0 5 10 15 20 25 30 35 T u it io n a n d f e e s F in a n c ia l A id S ta ff K IM E P s e rv ic e s O v e ra ll d is a p p o in tm e n t Q u a li ty o f e d u c a ti o n A d m in is tr a ti o n a n d m a n a g e m e n t K IM E P im a g e /v is ib il it y C a re e r p e rs p e c ti v e s L e a rn in g fa c il it ie s P a rk in g z o n e D o rm it o ry O th e r n o n -a c a d e m ic fa c il it ie s C a te ri n g S e c u ri ty H e a ti n g S p o rt C e n te r S tu d e n ts K IM E P S tu d e n ts A s s o c ia ti o n O th e r s tu d e n ts ' is s u e s O th e r s tu d e n t o rg a n iz a ti o n s Financial issues
General Facilities Students' life
ATTACHMENT 1
QUESTIONNAIRE
To what extent you are satisfied/agree with the following:
What you think is a particular STRENGTH at KIMEP?_______________________________________________________ What you think is a particular WEAKNESS at KIMEP?_______________________________________________________
Recruitment
1. Recruitment team is friendly, helpful and provides
sufficient information
2. Information provided during recruitment (brochures,
leaflets, presentations, KIMEP Open House Day) is complete and clear
3. Recruitment process is clear and well organized
4. Entrance examination process is well organized
Admission
5. Admission staff is friendly, helpful and provides
sufficient information
6. Admission information (handouts, web site, KIMEP
Open House Day) is sufficient and clear
7. Admission process is well organized and
understandable
Registration
8. KIMEP informed me well about registration policies
and procedures
9. On-line registration is clear and user friendly
10. Web-accessible student information (payment
report, grades, individual schedule, etc.) is complete and up to date
11. Printed information materials (newsletters,
registration package, schedules, information board notes, etc.) are complete and up to date
12. Registrar assistance (transcript orders, registration
for courses, graduation requirements, verification of the documents, etc.) is well-organized
13. Registrar staff is friendly and helpful
Form of Payment
14. Tuition payment process is well organized
Financial Aid
15. Financial Aid staff is friendly and helpful
16. I was well informed about financial aid opportunities
before I arrived at KIMEP
17. When I received financial aid, the process worked
well
Advising and Internship
18. Advising offices’ staff is friendly and helpful
19. My faculty advisor is friendly and helpful
20. Career and employment staff is friendly and helpful
21. I am satisfied with provided career and employment
opportunities
22. Internship Coordinator is friendly and helpful
23. I am satisfied with internship in companies
Academic Programs and Units
24. Tutoring or academic assistance is helpful
25. My course timetable / schedule is appropriate
26. Support staff and administrators are accessible and
helpful
27. Language Lab is helpful in studying foreign languages
Study and Support Facilities
28. KIMEP’s library and information resources are
sufficient to support me in attaining my degree
29. KIMEP provides sufficient training on effective use of
library and information resources
30. Library staff is friendly, helpful and provides
sufficient information
31. KIMEP uses an appropriate technology (computers,
Internet, software programs) to support students in their degree studies
32. KIMEP provides competent training on effective use
of technology at KIMEP
33. Computer Lab assistants are friendly and technical
advice / support is helpful
Learning Environment
34. Spaces for team work (discussion) outside
classrooms are sufficient
35. Campus security system is well-organized
Dormitory
36. Living in the dormitory is secure and safe
37. Dormitory is clean, well furnished and renovated
38. The costs of living are acceptable
39. Dormitory staff are helpful and provide effective
services
Medical Center Facilities
40. Medical support is available in right time
41. Medical Center staff are friendly and supportive
42. Medical documents are processed in appropriate
time
Sports Complex Facilities
43. Sports facilities meet my interests
44. Quality of equipment is appropriate
45. Spaces/ clothes changing facilities/ shower cubicles
are suitable
46. Sports Complex staff is friendly and helpful
Student Center
47. Social events are attractive and varied
48. Quality of Student Center facilities is appropriate
49. I am aware about the services provided by the
Center
Catering
50. There are enough catering services on campus
51. KIMEP Grill has an appropriate menu variety
52. The quality of food in KIMEP Grill is good
53. The prices in KIMEP Grill are acceptable
54. The environment in KIMEP Grill is pleasant
55. The KIMEP Grill staff is friendly
KIMEP Student Association
56. KSA shows willingness to understand and represent
my views
57. KSA shows strong commitment to student interests
58. KSA regularly informs students on its progress in key
areas
59. KSA behaves honestly and with integrity
General
60. I enjoy my academic program
61. I am confident that I can meet the challenges of
employment and future life
62. KIMEP encourages academic integrity
63. KIMEP is managed professionally
64. KIMEP fulfills its mission
ATTACHMENT 2
Table 1. Pool of respondents: response rate
Participated in Survey
Programs Total enrolled # of respondents
% out of enrolled in the program Undergraduate programs BAE 238 131 55.04 BAIJ 88 49 55.68 Bout 97 69 71.13 BSc 1545 849 54.95 BSSIR 179 104 58.10 BSSPA 203 97 47.78 BSSPS 11 2 18.18 LLB 107 68 63.55 Subtotal undergraduates 2468 1369 55.47 Graduate programs DBA 13 - - ExMBA 47 1 2.13 MA 48 30 62.50 MAIJ 11 8 72.73 MATESOL 24 6 25.00 MBA 271 153 56.46 MIR 44 20 45.45 Mout 1 - - MPA 28 17 60.71 LLM 53 25 47.17 LLM- MBA 4 2 50.00 Subtotal graduates 544 262 48.16 Exchange students 35 28 80.00 All programs 3047 1659 54.45
Table 2. Respondent pool by level of participation
Answered all sections Answered selected sections Total answered survey Chose to refuse
all sections Total
# % # % # % # % # %
Table 3. Respondent pool by categories
Answered all sections Answered selected sections Total answered survey
# % # % # % All respondents 712 48.70 750 51.30 1462 100 By gender Female 431 29.48 454 31.05 885 60.53 Male 281 19.22 296 20.25 577 39.47 By citizenship Kazakhstan 627 42.89 665 45.49 1292 88.37 CIS countries 59 4.04 60 4.10 119 8.14 Other countries 26 1.78 25 1.71 51 3.49 By level Bachelors 598 40.90 618 42.27 1216 83.17 Masters 100 6.84 122 8.34 222 15.18 Exchange students 14 0.96 10 0.68 24 1.64 By program Bachelors BAE 60 10.03 56 9.06 116 9.54 BAIJ 26 4.35 16 2.59 42 3.45 Bout 32 5.35 32 5.18 64 5.26 BSc 345 57.69 401 64.89 746 61.35 BSSIR 48 8.03 48 7.77 96 7.89 BSSPA 47 7.86 38 6.15 85 6.99 BSSPS 1 0.17 1 0.08 LLB 39 6.52 27 4.37 66 5.43 Total 598 100 618 100 1216 100 Masters ExMBA 1 1 1 0.45 MA 10 10 14 11.48 24 10.81 MAIJ 3 3 4 3.28 7 3.15 MATESOL 1 1 4 3.28 5 2.25 MBA 55 55 72 59.02 127 57.21 MIR 5 5 12 9.84 17 7.66 MPA 9 9 8 6.56 17 7.66 LLM 15 15 7 5.74 22 9.91 LLM-MBA 1 1 1 0.82 2 0.90 Total 100 100 122 100 222 100 By year of study Bachelors 1 year 337 56.35 303 49.03 640 52.63 2 year 79 13.21 100 16.18 179 14.72 3 year 65 10.87 82 13.27 147 12.09 4 year 117 19.57 133 21.52 250 20.56 Total 598 100 618 100 1216 100 Masters 1 year 67 67 93 76.23 160 72.07 2 year 33 33 29 23.77 62 27.93 Total 100 100 122 100 222 100 Exchange students 1 year 14 58.33 10 41.67 24 100
Table 4. KIMEP-wide pool of respondents
Sections # of responses R e cr u it -m e n t A d m is si o n R e g is tr a -ti o n F o rm o f P a y m e n t F in a n ci a l A id A d v is in g & In te rn sh ip A ca d e m ic P ro g ra m s & U n it s S tu d y a n d S u p p o rt F a ci li ti e s Le a rn in g E n v ir o n -m e n t D o rm it o ry M e d ic a l C e n te r F a ci li ti e s S p o rt s C o m p le x F a ci li ti e s S tu d e n t C e n te r C a te ri n g K IM E P S tu d e n t A ss o ci a ti o n G e n e ra l T o ta l a n sw e re d su rv e y By program Bachelors # 100 103 108 110 105 93 95 96 97 76 89 78 86 91 79 97 116 BAE % 8.13 8.00 8.09 8.20 8.50 8.48 7.92 7.79 7.69 7.98 7.90 7.77 7.97 8.14 7.98 7.85 7.93 # 37 38 42 39 36 36 39 38 40 32 40 34 36 40 35 41 42 BAIJ % 3.01 2.95 3.15 2.91 2.91 3.28 3.25 3.08 3.17 3.36 3.55 3.39 3.34 3.58 3.54 3.32 2.87 # 57 58 61 61 55 50 56 57 58 44 53 52 52 50 47 56 64 Bout % 4.63 4.51 4.57 4.55 4.45 4.56 4.67 4.63 4.60 4.62 4.71 5.18 4.82 4.47 4.75 4.53 4.38 # 624 656 674 672 628 536 595 613 637 481 562 503 542 563 500 622 746 BSc % 50.73 50.97 50.49 50.11 50.85 48.86 49.58 49.76 50.48 50.53 49.91 50.10 50.23 50.36 50.51 50.32 51.03 # 83 84 86 88 84 77 81 83 87 71 76 67 75 75 68 80 96 BSSIR % 6.75 6.53 6.44 6.56 6.80 7.02 6.75 6.74 6.89 7.46 6.75 6.67 6.95 6.71 6.87 6.47 6.57 # 69 72 76 80 74 67 69 73 79 57 70 61 70 67 64 71 85 BSSPA % 5.61 5.59 5.69 5.97 5.99 6.11 5.75 5.93 6.26 5.99 6.22 6.08 6.49 5.99 6.46 5.74 5.81 # 1 1 1 1 1 1 1 1 1 1 1 1 1 1 1 1 1 BSSPS % 0.08 0.08 0.07 0.07 0.08 0.09 0.08 0.08 0.08 0.11 0.09 0.10 0.09 0.09 0.10 0.08 0.07 # 55 59 60 60 59 55 55 56 57 50 53 53 54 54 50 54 66 LLB % 4.47 4.58 4.49 4.47 4.78 5.01 4.58 4.55 4.52 5.25 4.71 5.28 5.00 4.83 5.05 4.37 4.51 # 1026 1071 1108 1111 1042 915 991 1017 1056 812 944 849 916 941 844 1022 1216 All bachelors % 83.41 83.22 83.00 82.85 84.37 83.41 82.58 82.55 83.68 85.29 83.84 84.56 84.89 84.17 85.25 82.69 83.17 Masters # 1 1 1 1 1 1 1 1 1 1 1 1 1 1 1 1 1 ExMBA % 0.08 0.08 0.07 0.07 0.08 0.09 0.08 0.08 0.08 0.11 0.09 0.10 0.09 0.09 0.10 0.08 0.07 # 20 22 24 23 21 18 20 22 19 12 18 15 16 18 12 22 24 MA % 1.63 1.71 1.80 1.72 1.70 1.64 1.67 1.79 1.51 1.26 1.60 1.49 1.48 1.61 1.21 1.78 1.64 # 7 7 7 7 7 7 7 7 7 4 5 5 6 6 6 6 7 MAIJ % 0.57 0.54 0.52 0.52 0.57 0.64 0.58 0.57 0.55 0.42 0.44 0.50 0.56 0.54 0.61 0.49 0.48 # 5 4 5 5 5 2 5 4 4 2 3 2 2 2 1 3 5 MATESOL % 0.41 0.31 0.37 0.37 0.40 0.18 0.42 0.32 0.32 0.21 0.27 0.20 0.19 0.18 0.10 0.24 0.34 # 99 109 115 120 94 94 103 109 106 67 89 73 78 83 70 109 127 MBA % 8.05 8.47 8.61 8.95 7.61 8.57 8.58 8.85 8.40 7.04 7.90 7.27 7.23 7.42 7.07 8.82 8.69 # 16 17 17 17 12 10 15 16 14 6 12 9 11 14 9 16 17 MIR % 1.30 1.32 1.27 1.27 0.97 0.91 1.25 1.30 1.11 0.63 1.07 0.90 1.02 1.25 0.91 1.29 1.16 # 16 15 15 14 14 14 15 14 15 10 13 12 13 14 11 14 17 MPA % 1.30 1.17 1.12 1.04 1.13 1.28 1.25 1.14 1.19 1.05 1.15 1.20 1.20 1.25 1.11 1.13 1.16 # 19 21 22 21 19 18 20 20 18 16 19 17 17 17 17 21 22 LLM % 1.54 1.63 1.65 1.57 1.54 1.64 1.67 1.62 1.43 1.68 1.69 1.69 1.58 1.52 1.72 1.70 1.50Sections # of responses R e cr u it -m e n t A d m is si o n R e g is tr a -ti o n F o rm o f P a y m e n t F in a n ci a l A id A d v is in g & In te rn sh ip A ca d e m ic P ro g ra m s & U n it s S tu d y a n d S u p p o rt F a ci li ti e s Le a rn in g E n v ir o n -m e n t D o rm it o ry M e d ic a l C e n te r F a ci li ti e s S p o rt s C o m p le x F a ci li ti e s S tu d e n t C e n te r C a te ri n g K IM E P S tu d e n t A ss o ci a ti o n G e n e ra l T o ta l a n sw e re d su rv e y # 2 2 2 2 2 2 2 2 2 1 2 2 2 1 1 2 2 LLM-MBA % 0.16 0.16 0.15 0.15 0.16 0.18 0.17 0.16 0.16 0.11 0.18 0.20 0.19 0.09 0.10 0.16 0.14 # 185 198 208 210 175 166 188 195 186 119 162 136 146 156 128 194 222 All masters % 15.04 15.38 15.58 15.66 14.17 15.13 15.67 15.83 14.74 12.50 14.39 13.55 13.53 13.95 12.93 15.70 15.18 # 19 18 19 20 18 16 21 20 20 21 20 19 17 21 18 20 24 Exchange students % 1.54 1.40 1.42 1.49 1.46 1.46 1.75 1.62 1.58 2.21 1.78 1.89 1.58 1.88 1.82 1.62 1.64 By year of study Bachelors # 562 585 589 594 563 507 549 549 567 466 518 478 515 520 462 553 640 1 % 45.69 45.45 44.12 44.30 45.59 46.22 45.75 44.56 44.93 48.95 46.00 47.61 47.73 46.51 46.67 44.74 43.78 # 155 160 168 165 155 123 143 147 152 107 139 127 133 136 127 149 179 2 % 12.60 12.43 12.58 12.30 12.55 11.21 11.92 11.93 12.04 11.24 12.34 12.65 12.33 12.16 12.83 12.06 12.24 # 115 122 128 133 126 96 108 116 125 87 107 85 96 103 92 120 147 3 % 9.35 9.48 9.59 9.92 10.20 8.75 9.00 9.42 9.90 9.14 9.50 8.47 8.90 9.21 9.29 9.71 10.05 # 194 204 223 219 198 189 191 205 212 152 180 159 172 182 163 200 250 4 % 15.77 15.85 16.70 16.33 16.03 17.23 15.92 16.64 16.80 15.97 15.99 15.84 15.94 16.28 16.46 16.18 17.10 # 1026 1071 1108 1111 1042 915 991 1017 1056 812 944 849 916 941 844 1022 1216 All bachelors % 83.41 83.22 83.00 82.85 84.37 83.41 82.58 82.55 83.68 85.29 83.84 84.56 84.89 84.17 85.25 82.69 83.17 Masters # 135 141 148 151 128 114 132 137 129 80 111 92 102 110 89 136 160 1 % 10.98 10.96 11.09 11.26 10.36 10.39 11.00 11.12 10.22 8.40 9.86 9.16 9.45 9.84 8.99 11.00 10.94 # 50 57 60 59 47 52 56 58 57 39 51 44 44 46 39 58 62 2 % 4.07 4.43 4.49 4.40 3.81 4.74 4.67 4.71 4.52 4.10 4.53 4.38 4.08 4.11 3.94 4.69 4.24 # 185 198 208 210 175 166 188 195 186 119 162 136 146 156 128 194 222 All masters % 15.04 15.38 15.58 15.66 14.17 15.13 15.67 15.83 14.74 12.50 14.39 13.55 13.53 13.95 12.93 15.70 15.18 # 19 18 19 20 18 16 21 20 20 21 20 19 17 21 18 20 24 Exchange students 1 % 1.54 1.40 1.42 1.49 1.46 1.46 1.75 1.62 1.58 2.21 1.78 1.89 1.58 1.88 1.82 1.62 1.64 By citizenship # 1084 1138 1181 1198 1092 975 1053 1085 1115 812 987 864 950 987 877 1092 1292 Kazakhstan % 88.13 88.42 88.46 89.34 88.42 88.88 87.75 88.07 88.35 85.29 87.66 86.06 88.04 88.28 88.59 88.35 88.37 # 105 105 108 99 108 87 104 101 103 101 95 97 94 88 79 97 119 CIS countries % 8.54 8.16 8.09 7.38 8.74 7.93 8.67 8.20 8.16 10.61 8.44 9.66 8.71 7.87 7.98 7.85 8.14 # 41 44 46 44 35 35 43 46 44 39 44 43 35 43 34 47 51 Other countries % 3.33 3.42 3.45 3.28 2.83 3.19 3.58 3.73 3.49 4.10 3.91 4.28 3.24 3.85 3.43 3.80 3.49 # 1230 1287 1335 1341 1235 1097 1200 1232 1262 952 1126 1004 1079 1118 990 1236 1462 All respondents provided answers % 100 100 100 100 100 100 100 100 100 100 100 100 100 100 100 100 100
Table 5. Level of satisfaction, KIMEP-wide
Level of satisfaction To what extent would you agree with the
following: Strongly
agree Agree Neutral Disagree
Strongly Disagree
AVG Recruitment – 1 230 respondents
# 565 380 229 36 20
1. Recruitment team is friendly, helpful and
provides sufficient information % 45.93 30.89 18.62 2.93 1.63 4.17
# 548 380 244 40 18
2. Information provided during recruitment (brochures, leaflets, presentations, KIMEP Open
House Day) is complete and clear % 44.55 30.89 19.84 3.25 1.46
4.14
# 544 378 249 41 18
3. Recruitment process is clear and well
organized % 44.23 30.73 20.24 3.33 1.46 4.13
# 549 383 239 38 21
4. Entrance examination process is well
organized % 44.63 31.14 19.43 3.09 1.71 4.14 # 2206 1521 961 155 77 Subtotal % 44.84 30.91 19.53 3.15 1.57 4.14 Admission -1 287 respondents # 576 408 229 52 22
5. Admission staff is friendly, helpful and
provide sufficient information % 44.76 31.70 17.79 4.04 1.71 4.14
# 578 423 228 37 21
6. Admission information (handouts, web site,
KIMEP Open House Day) is sufficient and clear % 44.91 32.87 17.72 2.87 1.63 4.17
# 556 423 234 48 26
7. Admission process is well organized and
understandable % 43.20 32.87 18.18 3.73 2.02 4.11 # 1710 1254 691 137 69 Subtotal % 44.29 32.48 17.90 3.55 1.79 4.14 Registration – 1 335 respondents # 577 400 239 69 50
8. KIMEP informed me well about registration
policies and procedures % 43.22 29.96 17.90 5.17 3.75 4.04
# 625 430 211 35 34
9. On-line registration is clear and user friendly
% 46.82 32.21 15.81 2.62 2.55 4.18
# 639 400 220 44 32
10. Web-accessible student information (payment report, grades, individual schedule,
etc.) is complete and up to date % 47.87 29.96 16.48 3.30 2.40
4.18
# 594 420 254 32 35
11. Printed information materials (newsletters, registration package, schedules, information
board notes, etc.) are complete and up to date % 44.49 31.46 19.03 2.40 2.62
4.13
# 604 399 245 51 36
12. Registrar assistance (transcript orders, registration for courses, graduation
requirements, verification of the documents,
etc.) is well-organized % 45.24 29.89 18.35 3.82 2.70
4.11
# 577 391 249 61 57
13. Registrar staff is friendly and helpful
% 43.22 29.29 18.65 4.57 4.27 4.03 # 3616 2440 1418 292 244 Subtotal % 45.14 30.46 17.70 3.65 3.05 4.11 Payment – 1 341 respondents # 561 383 262 79 56
14. Tuition payment process is well organized
% 41.83 28.56 19.54 5.89 4.18 3.98
Financial Aid – 1 235 respondents
# 530 332 267 56 50
15. Financial Aid staff is friendly and helpful
% 42.91 26.88 21.62 4.53 4.05 4.00
# 490 311 255 97 82
16. I was well informed about financial aid
Level of satisfaction To what extent would you agree with the
following: Strongly
agree Agree Neutral Disagree
Strongly Disagree
AVG
# 513 319 290 54 59
17. When I received financial aid, the process
worked well % 41.54 25.83 23.48 4.37 4.78 3.95
# 1533 962 812 207 191
Subtotal
% 41.38 25.96 21.92 5.59 5.16 3.93
Advising and Internship – 1 097 respondents
# 512 334 183 38 30
18. Advising offices' staff is friendly and helpful
% 46.67 30.45 16.68 3.46 2.73 4.15
# 482 347 205 33 30
19. My faculty adviser is friendly and helpful
% 43.94 31.63 18.69 3.01 2.73 4.11
# 470 344 231 29 23
20. Career and employment staff is friendly and
helpful % 42.84 31.36 21.06 2.64 2.10 4.10
# 458 331 239 39 30
21. I am satisfied with provided career and
employment opportunities % 41.75 30.17 21.79 3.56 2.73 4.05
# 467 327 242 35 26
22. Internship Coordinator is friendly and
helpful % 42.57 29.81 22.06 3.19 2.37 4.07
# 439 336 260 31 31
23. I am satisfied with Internship in companies
% 40.02 30.63 23.70 2.83 2.83 4.02
# 2828 2019 1360 205 170
Subtotal
% 42.97 30.67 20.66 3.11 2.58 4.08
Academic Programs and Units – 1 200 respondents
# 501 394 255 25 25
24. Tutoring or academic assistance is helpful
% 41.75 32.83 21.25 2.08 2.08 4.10
# 517 398 219 43 23
25. My course timetable / schedule is
appropriate % 43.08 33.17 18.25 3.58 1.92 4.12
# 501 388 249 35 27
26. Support staff and administrators are
accessible and helpful % 41.75 32.33 20.75 2.92 2.25 4.08
# 495 355 287 34 29
27. Language Lab is helpful in studying foreign
languages % 41.25 29.58 23.92 2.83 2.42 4.04
# 2014 1535 1010 137 104
Subtotal
% 41.96 31.98 21.04 2.85 2.17 4.09
Study and Support Facilities – 1 232 respondents
# 580 396 201 32 23
28. KIMEP’s library and information resources are sufficient to support me in attaining my
degree % 47.08 32.14 16.31 2.60 1.87
4.20
# 538 389 236 47 22
29. KIMEP provides sufficient training on effective use of library and information
resources % 43.67 31.57 19.16 3.81 1.79
4.12
# 592 379 203 34 24
30. Library staff is friendly, helpful and provide
sufficient information % 48.05 30.76 16.48 2.76 1.95 4.20
# 540 383 214 57 38
31. KIMEP uses an appropriate technology (computers, Internet, software programs) to
support students in their degree studies % 43.83 31.09 17.37 4.63 3.08
4.08
# 526 373 247 55 31
32. KIMEP provides competent training on
effective use of technology at KIMEP % 42.69 30.28 20.05 4.46 2.52 4.06
# 493 368 241 71 59
33. Computer Lab assistants are friendly and
technical advice / support is helpful % 40.02 29.87 19.56 5.76 4.79 3.95
# 3269 2288 1342 296 197
Subtotal
Level of satisfaction To what extent would you agree with the
following: Strongly
agree Agree Neutral Disagree
Strongly Disagree
AVG Learning Environment – 1 262 respondents
# 542 402 235 53 30
34. Spaces for team work (discussion) outside
classrooms are sufficient % 42.95 31.85 18.62 4.20 2.38 4.09
# 527 379 252 60 44
35. Campus security system is well-organized
% 41.76 30.03 19.97 4.75 3.49 4.02 # 1069 781 487 113 74 Subtotal % 42.35 30.94 19.29 4.48 2.93 4.05 Dormitory – 952 respondents # 382 265 232 40 33
36. Living in the dormitory is secure and safe
% 40.13 27.84 24.37 4.20 3.47 3.97
# 353 247 235 65 52
37. Dormitory is clean, well furnished and
renovated % 37.08 25.95 24.68 6.83 5.46 3.82
# 377 253 244 41 37
38. The costs of living are acceptable
% 39.60 26.58 25.63 4.31 3.89 3.94
# 371 257 245 42 37
39. Dormitory staff is helpful and provide
effective services % 38.97 27.00 25.74 4.41 3.89 3.93
# 1483 1022 956 188 159
Subtotal
% 38.94 26.84 25.11 4.94 4.18 3.91
Medical Center Facilities – 1 126 respondents
# 499 330 232 42 23
40. Medical support is available in right time
% 44.32 29.31 20.60 3.73 2.04 4.10
# 518 326 215 38 29
41. Medical Center staff is friendly and
supportive % 46.00 28.95 19.09 3.37 2.58 4.12
# 506 329 228 40 23
42. Medical documents are processed in
appropriate time % 44.94 29.22 20.25 3.55 2.04 4.11
# 1523 985 675 120 75
Subtotal
% 45.09 29.16 19.98 3.55 2.22 4.11
Sports Complex Facilities – 1004 respondents
# 442 302 209 34 17
43. Sports facilities meet my interests
% 44.02 30.08 20.82 3.39 1.69 4.11
# 438 309 209 29 19
44. Quality of equipment is appropriate
% 43.63 30.78 20.82 2.89 1.89 4.11
# 425 285 226 43 25
45. Spaces/ clothes changing facilities/ shower
cubicles are suitable % 42.33 28.39 22.51 4.28 2.49 4.04
# 432 280 216 39 37
46. Sports Complex staff is friendly and helpful
% 43.03 27.89 21.51 3.88 3.69 4.03
# 1737 1176 860 145 98
Subtotal
% 43.25 29.28 21.41 3.61 2.44 4.07
Student Center – 1 079 respondents
# 461 320 226 42 30
47. Social events are attractive and varied
% 42.72 29.66 20.95 3.89 2.78 4.06
# 455 316 241 36 31
48. Quality of Student Center facilities is
appropriate % 42.17 29.29 22.34 3.34 2.87 4.05
# 439 297 247 57 39
49. I am aware about the services provided by
Level of satisfaction To what extent would you agree with the
following: Strongly
agree Agree Neutral Disagree
Strongly Disagree AVG # 1355 933 714 135 100 Subtotal % 41.86 28.82 22.06 4.17 3.09 4.02 Catering– 1 118 respondents # 399 318 256 83 62
50. There are enough catering services on
campus % 35.69 28.44 22.90 7.42 5.55 3.81
# 347 250 282 127 112
51. KIMEP Grill has an appropriate menu variety
% 31.04 22.36 25.22 11.36 10.02 3.53
# 335 253 277 119 134
52. The quality of food in KIMEP Grill is good
% 29.96 22.63 24.78 10.64 11.99 3.48
# 339 262 270 121 126
53. The prices in KIMEP Grill are acceptable
% 30.32 23.43 24.15 10.82 11.27 3.51
# 356 261 287 114 100
54. The environment in KIMEP Grill is pleasant
% 31.84 23.35 25.67 10.20 8.94 3.59
# 358 288 297 85 90
55. The KIMEP Grill staff is friendly
% 32.02 25.76 26.57 7.60 8.05 3.66
# 2134 1632 1669 649 624
Subtotal
% 31.81 24.33 24.88 9.68 9.30 3.60
KIMEP Student Association – 990 respondents
# 352 266 243 68 61
56. KSA shows willingness to understand and
represent my views % 35.56 26.87 24.55 6.87 6.16 3.79
# 358 254 249 70 59
57. KSA shows strong commitment to student
interests % 36.16 25.66 25.15 7.07 5.96 3.79
# 355 256 244 67 68
58. KSA regularly informs students on its
progress in key areas % 35.86 25.86 24.65 6.77 6.87 3.77
# 358 245 262 61 64
59. KSA behaves honestly and with integrity
% 36.16 24.75 26.46 6.16 6.46 3.78 # 1423 1021 998 266 252 Subtotal % 35.93 25.78 25.20 6.72 6.36 3.78 General – 1 236 respondents # 567 408 197 37 27
60. I enjoy my academic program
% 45.87 33.01 15.94 2.99 2.18 4.17
# 565 388 220 38 25
61. I am confident that I can meet the
challenges of employment and future life % 45.71 31.39 17.80 3.07 2.02 4.16
# 569 367 233 38 29
62. KIMEP encourages academic integrity
% 46.04 29.69 18.85 3.07 2.35 4.14
# 561 359 235 48 33
63. KIMEP is managed professionally
% 45.39 29.05 19.01 3.88 2.67 4.11
# 554 373 234 48 27
64. KIMEP fulfills its mission
% 44.82 30.18 18.93 3.88 2.18 4.12
# 630 334 210 30 32
65. I would recommend KIMEP to a friend
% 50.97 27.02 16.99 2.43 2.59 4.21 # 3446 2229 1329 239 173 Subtotal % 46.47 30.06 17.92 3.22 2.33 4.15 # 31907 22181 15544 3363 2663 All questions % 42.17 29.32 20.55 4.45 3.52 4.02
Table 6. Level of satisfaction, undergraduates
Level of satisfaction To what extent would you agree with the
following: Strongly
agree Agree Neutral Disagree
Strongly Disagree
AVG Recruitment – 1 026 respondents
# 485 314 186 23 18
1. Recruitment team is friendly, helpful and
provides sufficient information % 47.27 30.60 18.13 2.24 1.75 4.19
# 474 314 193 30 15
2. Information provided during recruitment (brochures, leaflets, presentations, KIMEP Open
House Day) is complete and clear % 46.20 30.60 18.81 2.92 1.46
4.17
# 467 313 204 26 16
3. Recruitment process is clear and well
organized % 45.52 30.51 19.88 2.53 1.56 4.16
# 469 320 192 26 19
4. Entrance examination process is well
organized % 45.71 31.19 18.71 2.53 1.85 4.16 # 1895 1261 775 105 68 Subtotal % 46.17 30.73 18.88 2.56 1.66 4.17 Admission – 1 071 respondents # 491 331 198 35 16
5. Admission staff is friendly, helpful and
provide sufficient information % 45.85 30.91 18.49 3.27 1.49 4.16
# 493 346 192 24 16
6. Admission information (handouts, web site,
KIMEP Open House Day) is sufficient and clear % 46.03 32.31 17.93 2.24 1.49 4.19
# 475 345 198 33 20
7. Admission process is well organized and
understandable % 44.35 32.21 18.49 3.08 1.87 4.14 # 1459 1022 588 92 52 Subtotal % 45.41 31.81 18.30 2.86 1.62 4.17 Registration– 1 108 respondents # 496 324 198 52 38
8. KIMEP informed me well about registration
policies and procedures % 44.77 29.24 17.87 4.69 3.43 4.07
# 534 350 174 25 25
9. On-line registration is clear and user friendly
% 48.19 31.59 15.70 2.26 2.26 4.21
# 542 321 188 31 26
10. Web-accessible student information (payment report, grades, individual schedule,
etc.) is complete and up to date % 48.92 28.97 16.97 2.80 2.35
4.19
# 506 339 214 21 28
11. Printed information materials (newsletters, registration package, schedules, information
board notes, etc.) are complete and up to date % 45.67 30.60 19.31 1.90 2.53
4.15
# 520 323 200 37 28
12. Registrar assistance (transcript orders, registration for courses, graduation
requirements, verification of the documents,
etc.) is well-organized % 46.93 29.15 18.05 3.34 2.53
4.15
# 492 314 208 48 46
13. Registrar staff is friendly and helpful
% 44.40 28.34 18.77 4.33 4.15 4.05 # 3090 1971 1182 214 191 Subtotal % 46.48 29.65 17.78 3.22 2.87 4.14 Payment - 1 111 respondents # 472 313 212 63 51
14. Tuition payment process is well organized
% 42.48 28.17 19.08 5.67 4.59 3.98
Financial Aid -1 042 respondents
# 460 275 219 45 43
15 Financial Aid staff is friendly and helpful
% 44.15 26.39 21.02 4.32 4.13 4.02
# 423 263 210 83 63
16. I was well informed about financial aid
Level of satisfaction To what extent would you agree with the
following: Strongly
agree Agree Neutral Disagree
Strongly Disagree
AVG
# 444 269 238 42 49
17. When I received financial aid, the process
worked well % 42.61 25.82 22.84 4.03 4.70 3.98
# 1327 807 667 170 155
Subtotal
% 42.45 25.82 21.34 5.44 4.96 3.95
Advising and Internship -915 respondents
# 441 271 146 32 25
18. Advising offices' staff is friendly and helpful
% 48.20 29.62 15.96 3.50 2.73 4.17
# 409 284 170 25 27
19. My faculty adviser is friendly and helpful
% 44.70 31.04 18.58 2.73 2.95 4.12
# 403 286 187 20 19
20. Career and employment staff is friendly and
helpful % 44.04 31.26 20.44 2.19 2.08 4.13
# 392 280 189 29 25
21. I am satisfied with provided career and
employment opportunities % 42.84 30.60 20.66 3.17 2.73 4.08
# 395 276 196 27 21
22. Internship Coordinator is friendly and
helpful % 43.17 30.16 21.42 2.95 2.30 4.09
# 373 282 212 23 25
23. I am satisfied with Internship in companies
% 40.77 30.82 23.17 2.51 2.73 4.04
# 2413 1679 1100 156 142
Subtotal
% 43.95 30.58 20.04 2.84 2.59 4.10
Academic Programs and Units - 991 respondents
# 420 326 208 17 20
24. Tutoring or academic assistance is helpful
% 42.38 32.90 20.99 1.72 2.02 4.12
# 438 326 176 32 19
25. My course timetable / schedule is
appropriate % 44.20 32.90 17.76 3.23 1.92 4.14
# 419 317 209 23 23
26. Support staff and administrators are
accessible and helpful % 42.28 31.99 21.09 2.32 2.32 4.10
# 418 291 234 25 23
27. Language Lab is helpful in studying foreign
languages % 42.18 29.36 23.61 2.52 2.32 4.07
# 1695 1260 827 97 85
Subtotal
% 42.76 31.79 20.86 2.45 2.14 4.11
Study and Support Facilities – 1 017 respondents
# 490 329 160 22 16
28. KIMEP’s library and information resources are sufficient to support me in attaining my
degree % 48.18 32.35 15.73 2.16 1.57
4.23
# 456 324 189 31 17
29. KIMEP provides sufficient training on effective use of library and information
resources % 44.84 31.86 18.58 3.05 1.67
4.15
# 496 315 164 25 17
30. Library staff is friendly, helpful and provide
sufficient information % 48.77 30.97 16.13 2.46 1.67 4.23
# 461 314 168 42 32
31. KIMEP uses an appropriate technology (computers, Internet, software programs) to
support students in their degree studies % 45.33 30.88 16.52 4.13 3.15
4.11
# 450 302 198 41 26
32. KIMEP provides competent training on
effective use of technology at KIMEP % 44.25 29.70 19.47 4.03 2.56 4.09
# 417 300 189 61 50
33. Computer Lab assistants are friendly and
technical advice / support is helpful % 41.00 29.50 18.58 6.00 4.92 3.96
# 2770 1884 1068 222 158
Subtotal