HELSINKI UNIVERSITY OF TECHNOLOGY
Department of Communications and NetworkingAntti Riikonen
MOBILE INTERNET USAGE - NETWORK TRAFFIC MEASUREMENTS
Thesis submitted in partial fulfillment of the requirements for the degree of Master of Science in Technology.
Espoo, September 1st, 2009
Supervisor: Heikki Hämmäinen
Professor, Networking Business
Instructor: Antero Kivi
Abstract of the Master’s Thesis Author: Antti Riikonen
Title: Mobile Internet Usage - Network Traffic Measurements
Date: 1.9.2009 Number of pages: 9+92
Department: Department of Communications and Networking
Professorship: S-38 Networking Technology
Supervisor: Prof. Heikki Hämmäinen
Instructor: Antero Kivi M.Sc. (Tech)
Fundamental transformations are taking place in the telecommunication domain as the Internet and mobile industries are converging. Mobile phones are developing into multimedia computers and laptops are getting smaller with cellular connectivity, increasing the amount of mobile Internet capable devices. Furthermore, as mobile broadband prices have decreased and offered bandwidths increased, also the usage of mobile Internet has been increasing rapidly during the past couple of years. In search for new revenue sources, various industry stakeholders are interested in measurements that can help understanding the mobile Internet usage patterns. This thesis focuses on mobile network traffic measurements and studies their applicability for providing market understanding for the different stakeholders. First, measurements from operational Finnish mobile networks are analyzed to provide factual statistics on the usage patterns of the Finnish market. Second, the properties of the existing measurement organization are analyzed, possible measurement design and development areas are classified, and
recommendations are provided for further development of the measurements.
The factual statistics showed that most of the Finnish mobile Internet usage traffic volume is generated by computers, whereas the share of mobile handset generated traffic is less than one percent. Symbian operating system dominates the web oriented mobile handset usage.
Traditional Finnish media houses, social media sites, and Nokia are among the most popular content providers for web usage. In addition, also other web traffic classes than web browsing, such as email and synchronization, were observed to be used by mobile handsets.
As different measurement points in a mobile network provide different data granularity, the choices related to the measurement have to be made according to the objectives of the measurement. If advanced analysis is needed, the measurements are recommended to be conducted at a point in the mobile network where user identification is possible, whereas total traffic level patterns from IP traffic are adequate for general market description. From a mobile operator viewpoint, automated and continuous data collection and analysis could enable utilization of the results in multiple corporate functions. In general, the possibilities of traffic measurements are vast. On the other hand, they may require a lot of resources to succeed in their full potential. Nevertheless, mobile network traffic measurements can provide intelligence and support for operators in their decision making and business development.
Diplomityön tiivistelmä Tekijä: Antti Riikonen
Työn nimi: Mobiilin Internetin käyttö - verkon liikennemittaukset
Päivämäärä: 1.9.2009 Sivumäärä: 9+92
Laitos: Tietoliikenne- ja tietoverkkotekniikan laitos
Professuuri: S-38 Tietoverkkotekniikka
Työn valvoja: Prof.Heikki Hämmäinen
Työn ohjaaja: DI Antero Kivi
Perustavanlaatuisia muutoksia on tapahtumassa tietoliikennetoimialalla kun Internet ja mobiili konvergoituvat. Matkapuhelimet ovat kehittymässä multimediatietokoneiksi ja kannettavat tietokoneet muuttuvat pienemmiksi ja sisältävät kasvavissa määrin liitettävyyden
matkapuhelinverkkoon. Kun samaan aikaan mobiililaajakaistojen hinnat ovat laskeneet ja tarjotut kaistannopeudet kasvaneet, mobiilin Internetin käyttö on lisääntynyt nopeasti viimeisten parin vuoden aikana. Uusia tulonlähteitä etsiessä teollisuuden eri sidosryhmät ovat kiinnostuneita mittauksista jotka voivat auttaa ymmärtämään mobiilin Internetin käyttöä. Tämä diplomityö keskittyy mobiiliverkon liikennemittauksiin ja niiden soveltuvuuden
tutkimiseen markkinatiedon tuottamisessa eri sidosryhmille. Työssä analysoidaan suomalaisissa mobiiliverkoissa tehtyjä liikennemittauksia ja tuotetaan statistiikkaa mobiilin Internetin
käytöstä. Lisäksi nykyisen mittausjärjestelyn ominaisuuksia analysoidaan, mahdolliset mittausten kehittämisalueet luokitellaan ja suosituksia esitetään mittausten kehittämiseksi. Statistiikat Suomen mobiilii-Internetin käytöstä osoittivat että tietokoneet generoivat
suurimman osan Suomen liikennevolyymistä, kun taas matkapuhelinten tuottaman liikenteen osuus on alle prosentti. Symbian-käyttöjärjestelmä dominoi matkapuhelinten käyttöä joka on web-orientoitunutta. Muitakin web-liikenteen luokkia kuin web-selailua, kuten email- ja muuta synkronointiliikennettä, huomattiin käytettävän matkapuhelimilla. Perinteiset kotimaiset mediatalot, sosiaalisen median sivustot ja Nokia ovat suosituimpien web-sisällöntuottajien joukossa.
Koska eri mittauspisteet mobiiliverkossa tuottavat eri tarkkuustason tietoa, täytyy mittausprosessiin liittyvät valinnat tehdä mittauksen tavoitteiden mukaan. Jos kehittynyt analyysi on tarpeen, mittausten olisi suositeltavaa suoritettavan pisteessä jossa käyttäjien tunnistaminen on mahdollista, kun taas pelkästä IP-liikenteestä saatavat tulokset ovat riittäviä yleisempään markkinan kuvaamiseen. Mobiilioperaattorin kannalta yhtäjaksoiset ja
automatisoidut mittaukset mahdollistaisivat tulosten hyväksikäyttämisen useissa eri yrityksen toiminnoissa. Yleisesti liikennemittausten mahdollisuudet ovat laajat, mutta toisaalta täyden hyödyn saavuttamiseksi resurssivaateet saattavat olla suuria. Liikennemittaukset voivat kuitenkin tuottaa tietoa ja tukea operaattoreita päätöksenteossa ja liiketoiminnan kehittämisessä.
This Master’s Thesis has been written as a partial fulfillment for the Master of Science degree in Helsinki University of Technology. The work has been conducted as a deliverable for the MoMI project in the Department of Communications and Networking. Without the contribution of the project’s industrial partners this research would not have been possible.
I wish to express my gratitude to the people that have supported me in this work. First, I would like to thank Professor Heikki Hämmäinen for the opportunity to work in the team and to write the thesis under his guidance. I am grateful to Antero Kivi for his extensive assistance and support throughout the whole research process.
I would also like to express my gratitude to Markus Peuhkuri for the assistance and advice during the measurements. In addition, I would like to thank the other co-workers in the Networking Business -team for the comments and discussion regarding my work. I especially wish to thank Juuso Karikoski for reviewing the Thesis and Timo Smura for reviewing the project report from the measurements.
I would like to thank my family, friends, and fellow students for the support during my studies. To my dearest, Emppu, thank you for the strength and wisdom you gave me during the course of my work. Finally, I want to thank my parents, Aila and Raimo, for all the support they have provided me.
Espoo, September 1st, 2009
i
Table of Contents
Table of figures ... iv
List of tables ... v
Acronyms and terms ... vi
1 Introduction ... 1
1.1 Motivation & background ... 1
1.2 Research questions & objectives ... 2
1.3 Scope of the research ... 3
1.4 Research methods ... 5
1.5 Structure of the thesis ... 6
2 Background ... 8
2.1 IP traffic ... 8
2.1.1 Protocol layers ... 8
2.1.2 Structural levels of traffic ... 11
2.1.3 Web traffic ... 12
2.2 Mobile network ... 14
2.2.1 Mobile device & subscriber ... 14
2.2.2 Access network ... 15
2.2.3 Core network ... 16
2.2.4 Data transmission in mobile networks ... 18
3 Internet traffic measurements... 21
3.1 Measurement types ... 21
3.1.1 Active & passive measurements ... 22
3.1.2 Trace data & post-processing ... 23
3.2 Identification of users & devices ... 24
3.2.1 Operating system identification ... 24
ii
3.3.1 Port based method ... 26
3.3.2 Payload inspection ... 27
3.3.3 Advanced statistical and machine learning methods ... 28
3.3.4 Other advanced methods ... 31
3.3.5 Comparison of the application identification methods ... 32
3.4 Traffic measurements in mobile networks ... 34
3.4.1 Measurement points and tools ... 35
3.4.2 Extractable information from different interfaces ... 37
3.5 Issues with traffic measurements ... 40
3.5.1 Operational issues ... 40
3.5.1 Privacy ... 41
4 Measurement description ... 43
4.1 Measurement organization & specification ... 43
4.2 Measurement process ... 45
4.2.1 Phases of the measurement process... 48
4.2.2 TCP fingerprint collection ... 49
4.3 Data analysis ... 50
4.3.1 Preservation of data ... 51
4.3.2 Classification of operating systems ... 52
4.3.3 Application identification ... 52
4.3.4 Mobile handset web traffic identification ... 53
5 Descriptive statistics on mobile Internet usage ... 54
5.1 Overview on the Finnish mobile market ... 54
5.1.1 Total traffic volume in the Finnish mobile networks ... 55
5.2 General traffic patterns ... 57
5.2.1 Traffic by operating system... 58
5.2.2 Traffic by day and hour ... 59
5.2.3 Computer usage of applications ... 61
iii
5.3 Mobile handset web traffic results ... 64
5.3.1 Mobile handset web browsing ... 64
5.3.2 Mobile handset “secure web” traffic ... 65
5.3.3 Mobile handset optimized web traffic ... 66
5.4 Summary of the descriptive statistics ... 68
6 Development of mobile network traffic measurements ... 69
6.1 Limitations ... 69 6.1.1 Preliminary planning ... 69 6.1.2 Research design ... 70 6.1.3 Data collection ... 70 6.1.4 Data analysis ... 71 6.1.5 Reporting ... 72
6.2 Design & development areas ... 72
6.2.1 General areas ... 74
6.2.2 Measurement phase specific areas ... 74
6.3 Recommendations ... 75
6.3.1 Case MoMI project ... 76
6.3.2 Case mobile operator ... 78
7 Conclusions ... 80
7.1 Summary of findings... 80
7.2 Discussion ... 82
7.3 Further research ... 83
iv
Table of figures
Figure 1 Structure of the thesis ... 6
Figure 2 Internet model and encapsulation of traffic (adapted from Forouzan et al., 2002) ... 9
Figure 3 Levels of structure in Internet traffic (adapted from Crovella & Krishnamurthy, 2006) ... 11
Figure 4 GPRS/UMTS architecture with the main interfaces (adapted from Kivi, 2006) . 16 Figure 5 Simplified GPRS attach & PDP context creation procedures (adapted from Svoboda, 2008) ... 19
Figure 6 Main measurement interfaces in a mobile network (adapted from Ricciato et al., 2006)... 35
Figure 7 Measurement point (adapted from Riikonen & Kivi, 2009) ... 44
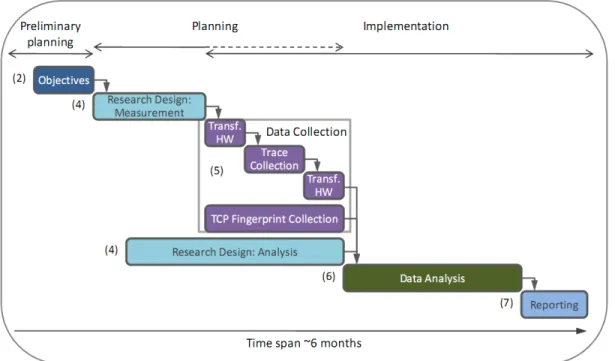
Figure 8 Measurement process ... 47
Figure 9 Data analysis phases and tools ... 51
Figure 10 Total traffic volumes in mobile networks 2005-2008 (Kivi, 2009c) ... 56
Figure 11 Traffic in mobile networks by operating system ... 58
Figure 12 Traffic by day and hour ... 60
Figure 13 Computer traffic by application ... 61
Figure 14 Computer applications by day and hour ... 62
Figure 15 Handset traffic by application ... 63
Figure 16 Handset applications by day and hour ... 64
Figure 17 Design & development areas of traffic measurements ... 73
v
List of tables
Table 1 Web traffic classification categories (adapted from Canini et al., 2009) ... 32
Table 2 Comparison of application identification methods (adapted from Nguyen et al., 2008) ... 33
Table 3 Exemplary Ports Used in Application Identification ... 53
Table 4 Ranking list of top handset traffic HTTP domain names ... 65
Table 5 Ranking list of top handset HTTPS domain names... 66
vi
Acronyms and terms
2G 2nd 3G 3 Generation rd 3GPP 3 Generation rd
API Application Programming Interface Generation Partnership Project APN Access Point Name
ARPU Average Revenue per User AuC Authentication Center
BG Border Gateway
BLINC Blind Classification BSS Base Station Subsystem
COIN Dynamics of Competition and Innovation in the Converging Internet and Mobile Network
CS Circuit Switched
DAG Data Acquisition and Generation DNS Domain Name System
DPI Deep Packet Inspection
Econ@Tel Telecommunications Economics COST Network, COST605 EDGE Enhanced Data rates for Global Evolution
ESP Encapsulated Security Payload FTP File Transfer Protocol
Gb Gb interface is a GPRS interface between a BSS and a SGSN GERAN GSM EDGE Radio Access Networks
GGSN Gateway GPRS Support Node
Gi Gi Interface is a GPRS interface which is located between the GGSN and the external PDN (Public Data Network)
GMM/SM GPRS Mobility Management and Session Management
vii
Gp Gp interface is a GPRS interface between GSNs within different PLMN GPRS General Packet Radio Service
GPS Global Positioning System
Gs Gs interface is an interface between a SGSN and a MSC GSM Global System for Mobile communications
GSN GPRS Support node GTP GPRS Tunneling Protocol GTP-C GTP control traffic (see GTP) GTP-U GTP user traffic (see GTP)
GTVS Ground Truth Verification System HLR Home Location Register
HSDPA High-Speed Downlink Packet Access HSPA High speed packet data access HSUPA High-Speed Uplink Packet Access HTML Hypertext Markup Language HTTP Hypertext Transfer Protocol IMAP Internet Message Access Protocol
IMEI International Mobile station Equipment Identity
IMEISV International Mobile station Equipment Identity and Software Version number
IMS IP Multimedia Subsystem
IMSI International Mobile Subscriber Identification IP Internet Protocol
IuPS IuPS interface is a UMTS interface which links the RNC with a SGSN LEAD Optimal Rules for a Leading Mobile Data Market
LTE Long Term Evolution
ME Mobile Equipment
MIME Multipurpose Internet Mail Extensions
viii MNO Mobile Network Operator
MoMI Modeling of Mobile Internet Usage and Business MSC Mobile Switching Center
MSS Maximum Segment Size
MVNO Mobile Virtual Network Operator NDA Non-Disclosure Agreement NOP No Operation
NSAPI Network Layer Service Access Point Identifier NTP Network Time Protocol
OS Operating System
P2P Peer-to-Peer
PC Personal Computer
PCAP Packet Capture
PDA Personal Digital Assistant PDN Packet Data Network PDP Packet Data Protocol
PLMN Public Land Mobile Network POP3 Post Office Protocol version 3
PS Packet Switched
P-TMSI Packet-Temporary Mobile Subscriber Identity
RA Routing Area
RADIUS Remote Authentication Dial In User Service RAT Radio Access Technology
RNC Radio Network Controller RTSP Real Time Streaming Protocol RTT Round Trip Time
SackOK Selective Acknowledgment Permitted SAE Service Architecture Evolution
ix SMTP Simple Mail Transfer Protocol
SNDCP SubNetwork Dependent Convergence Protocol SP Service Provider
SPSS Statistical Package for the Social Sciences TCP Transmission Control Protocol
TEID Tunnel Endpoint Identifier
TEKES Finnish Funding Agency for Technology and Innovation TKK Helsinki University of Technology
TTL Time To Live
UDP User Datagram Protocol
UE User Equipment
UMTS Universal Mobile Telecommunications System URI Uniform Resource Identifier
URL Uniform Resource Locator USB Universal Serial Bus
USIM User Subscriber Identity Module
UTRAN UMTS Terrestrial Radio Access Network WAP Wireless Application Protocol
WiMAX Worldwide Interoperability for Microwave Access WLAN Wireless Local Area Network
VOIP Voice over IP
1
1
Introduction
1.1
Background
Fundamental transformations are taking place in the telecommunication domain as the Internet and mobile industries are converging. Increasing competition is forcing traditional players to rethink their strategies as new entrants are emerging and there are new products and services increasingly offered. On one hand, mobile phones are developing into multimedia computers including advanced features, functionality, and connectivity. On the other hand, computers are getting smaller and more portable, which is another reason why the distinction between different mobile devices is blurring. In addition, as mobile access technologies are developing, mobile internet access is both, substituting and complementing the traditional fixed Internet connectivity and thus increasing traffic volumes in mobile networks.
The increase in the usage of mobile data services provides companies an opportunity to look for new revenue sources and improve profitability. Industry players, including mobile operators, device manufacturers, application or content producers, as well as consulting companies, academia, and regulators, are all keen on understanding the mobile Internet usage patterns and market characteristics.
There are different ways to measure mobile Internet usage and different stakeholders have access to different data, as mobile Internet usage is dispersed between devices and networks (Smura et al., 2009). Mobile core network provides one centralized measurement point to provide objective information about the mobile Internet usage patterns. However, network traffic measurements are an emerging method and previously they have been conducted mainly for technical purposes. Such large scale
2
measurements have been rarely used to uncover mobile service usage level information, or even basic mobile traffic characteristics (Dahmouni, 2005).
The focus of this thesis is to study network traffic measurements and their applicability to complement the traditional market research approaches. This thesis analyzes usage data that has been gathered from Finnish mobile operators in the MoMI1 project and its predecessors2
1.2
Research questions & objectives
at Helsinki University of Technology (TKK) since 2005. In addition to providing empirical data on the Finnish mobile Internet usage characteristics, this thesis gives suggestions on how the existing measurements should be developed to provide enhanced understanding of the market. Furthermore, recommendations are given for mobile operators on how to implement network traffic measurements to support business intelligence and decision making.
Although the usage of mobile Internet has been growing all over the world, little empirical data about the usage is available. Nevertheless, industry players are interested on such data due to the high value of the mobile Internet domain and the transformation that is forcing the players to adapt and look for new revenue sources. As mobile network traffic measurements have traditionally been conducted to research
1 This thesis has been conducted in the MoMI project and Econ@Tel context. MoMI (Modeling of Mobile Internet Usage and Business) is a national research project (2008-2009) funded by the Finnish Funding Agency for Technology and Innovation (TEKES), Nokia, Elisa, DNA Finland, AinaCom, Yle, Accenture, MINTC, Sanoma, and TKK Comnet. Econ@Tel (Telecommunications Economics COST Network, COST605) is a European research network consisting of research units in 20 countries.
2Predecessors of the MoMI project were LEAD (Optimal Rules for a Leading Mobile Data Market) and COIN (Dynamics of Competition and Innovation in the Converging Internet and Mobile Networks) projects between 2004-2005 and 2006-2007, respectively.
3
technical issues, few generally known methods or tools are available to analyze network from a service usage and user behavior perspective. As the MoMI project has been conducting such measurements annually and the possibilities of the method have been found promising, further development alternatives needed to be classified and concrete recommendations provided.
The main research question of this thesis is:
Q1: How should mobile network traffic measurement and analysis be designed and
developed
a) to provide understanding on mobile Internet usage patterns and user behavior
The following research objectives were set in order to answer the research questions and to provide concrete objectives for the thesis:
b) to support a mobile operator’s strategic decision making and business planning
O1: Provide factual statistics of the mobile Internet usage in Finland
O2: Classify the design and development areas of network traffic measurements
O3
a) From the MoMI project viewpoint
: Provide recommendations for the development of IP traffic measurements conducted at mobile operator core network
b) From a mobile operator viewpoint
1.3
Scope of the research
The term “mobile Internet” can be defined in multiple ways as mobile Internet usage has been dispersed between different devices and access network technologies. Smura
4
et al. (2009) have classified mobile devices and networks for analyzing mobile service usage. Their categorization of mobile devices is based on the physical size of the device, the capability to make 2G/3G (2nd/3rd Generation) voice calls, and the operating system (OS) of the device. According to these criteria, there are five types of mobile devices, namely mobile phones, smartphones and PDAs (Personal Digital Assistant), ultra-mobile PCs (Personal Computer), laptops and tablet PCs, and other devices such as iPods and digital cameras. Furthermore, Smura et al. (2009) divide wireless and mobile networks based on their geographical coverage. In addition to cellular based nationwide mobile networks, such as GSM/UMTS (Global System for Mobile communications/Universal Mobile Telecommunications System), also wireless access networks, such as WiMAX (Worldwide Interoperability for Microwave Access) and WLAN (Wireless Local Area Network), can be used to access the Internet.
In this thesis network access technologies are limited to mobile, i.e., cellular network technologies, as the centralized measurement point has been chosen from the 2G/3G core network. Thus, connectivity to the Internet via other wireless access networks, such as WLAN, is out of the scope of this thesis. However, in practice the same measurement setup used in this thesis could also be utilized with other wireless access networks. Mobile devices are not limited by any means, as long as they are mobile network capable devices, or using mobile network capable data terminals in connecting to the Internet. Thus, all devices from basic mobile phones to computers are in the scope of the thesis.
As Finnish mobile network operators were measured in this thesis, the scope is restricted to the Finnish mobile market and Finnish mobile subscribers. However, no geographical limitations exist, as also the roaming data of the measured operators’ home subscribers is transferred via the home core network and the measurement point.
5
1.4
Research methods
First, a literature review is carried out to give an overview on the underlying technologies. In addition, previous research in the areas operating mobile network traffic measurements and IP traffic measurement analysis is reviewed.
Second, an analysis of operating mobile network IP traffic measurements is conducted to provide descriptive statistics on the mobile Internet usage in Finland. The analysis includes multiple methods and tools, varying from statistical tools, such as SPSS (Statistical Package for the Social Sciences) and Excel, to proprietary Perl scripts.
Last, the literature review and experiences from the measurements are utilized in a
qualitative case analysis, classifying the development and design areas for the measurements, as well as providing concrete recommendations. Two viewpoints are taken, one concentrating on the measurements conducted in the MoMI project and the other considering a mobile operator point of view.
6
1.5
Structure of the thesis
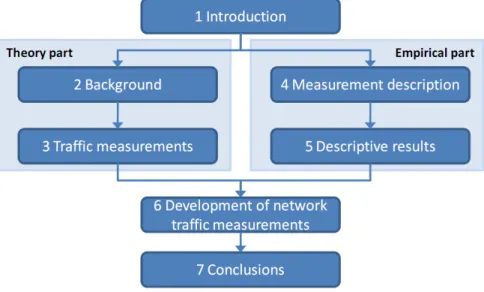
This thesis consists of seven chapters. The structure is presented in Figure 1.
Figure 1 Structure of the thesis
Chapter 2 provides background information about mobile network architecture and the basics of data transmission in mobile networks and the Internet. It describes the mobile network entities, data transmission procedures, and the TCP/IP (Transmission Control Protocol/Internet Protocol) suite.
Chapter 3 provides information about IP traffic measurements in general, as well as in the context of mobile domain. A holistic comparison of different measurement analysis methods is also presented.
Chapter 4 includes the measurement organization and analysis description from fall 2008 and spring 2009, respectively. The chapter discusses the objectives, measurement setup, trace data, analysis methods, and the measurement and analysis processes.
7
Chapter 5 provides descriptive statistics about mobile internet usage in Finland. The results include information about general mobile internet traffic patterns, as well as more detailed application and mobile web browsing usage patterns.
Chapter 6 classifies the main development and design areas of IP traffic measurements used in operating mobile networks. In addition, concrete recommendations about future development are provided.
Chapter 7 provides a summary of the main findings. In addition, the results are discussed and further research suggestions are presented.
8
2
Background
IP based traffic has dominated the fixed Internet for basically its whole lifetime and it has also been adapted to the mobile Internet. On the other hand, mobile Internet access requires enhanced features from the access network. Thus, data transmission in mobile networks requires also proprietary protocols used with Internet traffic, and measurement traffic at different points provide also different trace data.
First, this chapter gives overview on IP traffic characteristics. Second, mobile network architecture is described from a mobile Internet point of view.
2.1
IP traffic
The objective of IP is to enable an interconnection between heterogeneous networks and their interoperation (Comer, 2000). IP is based on a layered model where multiple protocols handle different level of connectivity between two hosts.
2.1.1 Protocol layers
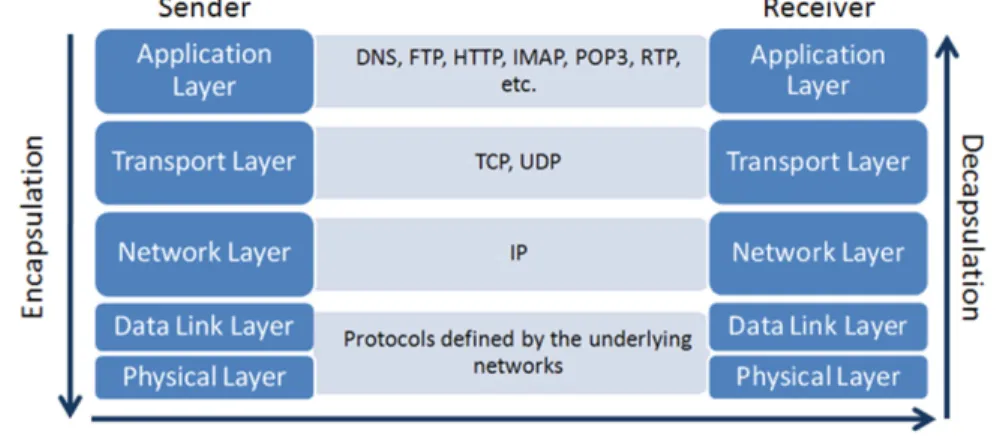
TCP/IP suite describes the different layers of Internet traffic. The layers from bottom-up are the physical layer, data-link layer, network layer, transport layer, and application layer, each including their own protocols that are used for the interconnectivity (Forouzan, 2002). The protocols in different layers encapsulate and decapsulate the traffic when it is being transmitted from a sender to a receiver. Encapsulation means that at the sender side a lower level protocol takes a higher level protocol packet and without changing it adds a standardized header of its own to the beginning. In decapsulation at the receiver end the headers at each layer are removed and the original application layer packet stays untouched. The TCP/IP suite and exemplary
9
protocols are presented in Figure 2. The figure also demonstrates the encapsulation and decapsulation process.
Figure 2 Internet model and encapsulation of traffic (adapted from Forouzan et al., 2002)
On the data-link and physical layers there are no specific protocols defined. These layers support the proprietary protocols of the underlying networks and take care of the link- and physical level connectivity.
The IP on the network layer handles the host-to-host traffic by mainly offering the addressing for it. It uses IP-addresses, which are fixed length of 32 bits, and transmits the data unreliably over one or several networks in IP-datagrams. Unreliability means that the protocol does not include error checking or tracking of the datagrams, for instance. As the maximum packet sizes in different network links may vary, the IP-datagram may have to be split into smaller packets, which is why IP protocol also offers fragmentation and reassembly (Postel, 1981a).
The transport layer on top of IP layer handles the delivery of messages from an application to another, whereas IP protocol handles the delivery of messages from a host to another. There are two main protocols on the transport layer, the User
10
Datagram Protocol (UDP) and the Transmission Control Protocol (TCP), from which the latter is more used in the Internet.
UDP is a connectionless protocol, which does not include any reliability, flow control, or error recovery, meaning that segments are sent to the network without any guarantees. UDP is a straightforward and light protocol, which is why its header is also small, carrying only the obligatory information, as a lot of responsibility is given to the applications. UDP and its header format are described in the RFC 768 (Postel, 1980). TCP is a connection-oriented and reliable protocol. It identifies every connection uniquely, retransmits packets if needed, and has a flow control method. TCP header includes source and destination ports, as well as a checksum field like UDP does. In addition, there are other fields, such as sequence and acknowledgment numbers and different flags, which take care of the reliability and connectivity of the protocol. TCP protocol header description is provided in the RFC 793 (Postel, 1981b).
The highest layer of TCP/IP suite, called the application layer, is the most visible part for the end user. Its function is to enable users to access the network by providing user interfaces, support for services, and file access, for instance (Forouzan et al., 2002). The applications then access services across the Internet by invoking the transport layer protocol, which then handles the delivery from that on as described earlier. In comparison to the network layer with one main protocol (IP) and the transport layer with two main protocols (TCP and UDP), the application layer includes a variety of different protocols serving a variety of applications, which is why Internet traffic, in general, is rather heterogeneous.
Examples of widely used protocols on the application layer are the Hypertext Transfer Protocol (HTTP) used by browsers and web servers, and the Domain Name System (DNS)
11
for mapping IP addresses and readable domain names. In addition, application layer protocols include mail protocols, e.g. SMTP (Simple Mail Transfer Protocol), POP3 (Post Office Protocol version 3), and IMAP (Internet Message Access Protocol), the File Transfer Protocol (FTP), and protocols involved with media streaming, for instance, RTSP (Real Time Streaming Protocol).
2.1.2 Structural levels of traffic
In addition to the different layers of traffic protocols, there are three principal structural levels of traffic in the Internet (Crovella & Krishnamurthy, 2006). From lowest to highest they are the packet level, train or flow level, and session level, as presented in Figure 3.
Figure 3 Levels of structure in Internet traffic (adapted from Crovella & Krishnamurthy, 2006)
The lowest level includes packets that are either transferred in the network or not. The second level includes trains of packets, often called as flows, as rather rarely only one packet is sent between a source and destination. A flow or a packet train can, for example, represent a download of one file or a web page. At its simplest a packet train or a flow is a burst of packets from a certain source arriving to a certain destination. If a timeout between two packets exceeds a certain interval, the packets belong to a different packet train or flow (Jain & Routhier, 1986). One of the most popular ways of defining a flow is a five-tuple, which includes source and destination IP addresses, source and destination port numbers, and the protocol number (Ilvesmäki et al., 1998).
12
Thus all the packets having the same characteristics of the five-tuple and arriving inside a certain interval belong into the same flow. One popular time-out in studies recently has been 60 seconds (see, e.g., Claffy, 1995; Zhang, 2002), but also longer or shorter timeouts ranging from a few seconds to half an hour have been used. In addition to the unidirectional flow defined above, sometimes a more appropriate way with client-server traffic is to use bidirectional flow, in which traffic to both ways between the two hosts is included into a single flow.
The highest structural level of IP traffic is the session level (Crovella & Krishnamurthy, 2006), which describes a single execution of an application by including a set of flows. Often traffic in the Internet has a clear beginning and an end that correspond with the usage time that a human is spending with the application. However, the increased P2P (peer-to-peer) traffic, for instance, has changed this behavior during the last years, as many P2P applications are used also while the end user himself or herself is inactive. In these cases the application session times last longer and do not represent a user session anymore.
2.1.3 Web traffic
Web content is one of the major traffic generators in the Internet, including mobile Internet. Web traffic can include variety of content, such as web pages, pictures, video, web applications (e.g., java), and so on. HTTP traffic is based on a client-server relationship where a client, usually a web browser, initiates (HTTP) requests that the web server responds to, offering different resources for the client. These web resources can be static files, such as HTML (Hypertext Markup Language) pages, or dynamic content resources. Dynamic content can be, for instance, a live web camera gateway, an online web store, or an internet search engine. Due to the variety of possible data transferred over HTTP the type of the content is tagged in a data format label called
13
MIME (Multipurpose Internet Mail Extensions), originally used with electronic mail systems, hence the name. (Gourley & Totty, 2002)
The client can make a request to a certain web resource by using URIs (uniform resource identifier) which point out the exact domain name (server), and the location of the resource in the server. The most common URI is a Uniform Resource Locator (URL), consisting of three parts, the scheme (e.g., http://), the server internet address (e.g., www.example.fi), and the resource location (e.g., /pictures/example.jpg). This exemplary URL for a picture resource would thus be http://www.example.fi/pics/pic.jpg. A more detailed URI description can be seen in Berners-Lee et al. (1998).
Nowadays it is common that requesting a single web page involves multiple transactions with multiple servers. An exemplary HTTP request of a web page can include only the frame and text of the web page from the requested server and the client may have to fetch pictures included in the page from content distribution network (CDN) servers, and advertisement banners from advertisement servers. Furthermore, these servers can be chosen dynamically through load balancing or DNS lookups. (Crovella & Krishnamurthy, 2006) For example, Smith et al. (2001) studied web traffic and noticed that 35% of web pages included resources from multiple servers. In addition, they noticed that 70% of consecutive top level page references go to a different server than the previous reference, due to load balancing.
Redirection is nowadays used in HTTP with device identification adapting content according to the device. Every HTTP response includes a status code which can also be a redirect code for the client to look for the resource from a given alternative address. For instance, mobile handsets can be identified from their user agent field in the HTTP request and redirected to a mobile optimized web page with the equivalent content. An
14
example would be a mobile handset trying to get a web page from http://www.example.fi and being redirected to a mobile optimized site http://m.example.fi. In addition, sometimes redirecting can be conducted on other levels also, such as DNS, TCP, or even lower levels (Crovella & Krishnamurthy, 2006). This makes web traffic complex of nature, as requesting one resource or a web page can include data from multiple servers and via multiple redirections. One feature of the newer HTTP version 1.1, called pipelining, enables more simple traffic on a transportation level. It allows one TCP connection to be used for multiple HTTP requests and responses, thus reducing the amount of TCP connections needed in HTTP transactions.
2.2
Mobile network
A mobile network (PLMN, Public Land Mobile Network) offers telecommunication services to the public and consists of multiple logical and physical parts and interfaces. There are two main logical domains in a mobile network, a core network and an access network. (3GPP TS 23.002) The core network consists of a packet switched domain, a circuit switched domain, and an IP Multimedia Subsystem (IMS) concentrating on multimedia specific IP services, such as video, audio, and chat. However, as this chapter describes the basics of mobile networks, IMS is not discussed further. The rest of the network entities are presented in Figure 4.
2.2.1 Mobile device & subscriber
A subscriber has a physical (mobile) device with variety of functionalities to take a radio connection to the access network. The device can be a mobile handset or a laptop, for instance. In UMTS terms the device is called a User Equipment (UE), which consists of a Mobile Equipment (ME) and a User Subscriber Identity Module (USIM). The mobile
15
equipment, which can be further divided into subcategories, includes applications and handles the radio transmission, for instance. (3GPP TS 23.002, 3GPP TS 23.101).
The USIM, often referred in spoken language as a SIM card, is a possibly removable smart card that can be used in different kind of equipments. The SIM card allows the subscriber to be securely identified independent of the equipment, by providing data and procedures for it. In more detail, a number called an International Mobile Subscriber Identification (IMSI) number is used in the subscriber identification procedure. For subscriber identity confidentiality purposes also temporary subscriber identification methods are used in the mobile network, such as P-TMSI (Packet-Temporary Mobile Subscriber Identity) in the packet switched domain. In mobile networks also the user equipment can be uniquely identified from the International Mobile station Equipment Identity (IMEI) or the International Mobile station Equipment Identity and Software Version number (IMEISV), identifying the manufacturer, the model, and uniquely the device. More detailed description of the subscriber and device identifiers in mobile networks is provided in 3GPP (3rd Generation Partnership Project) specifications (see 3GPP TS 23.003)
2.2.2 Access network
Via the access network a mobile device may take connection to both, circuit switched and packet switched core networks one at a time or both simultaneously. There are two possible access networks used widely in operational mobile networks at the moment in Western Europe, a GSM EDGE (Enhanced Data rates for Global Evolution) Radio Access Networks (GERAN) and an UMTS Terrestrial Radio Access Network (UTRAN), both of which can be deployed in parallel in practice. In addition, High speed packet data access (HSPA) can be implemented into UMTS, including enhanced protocols to provide faster data transfer rates.
16
2.2.3 Core network
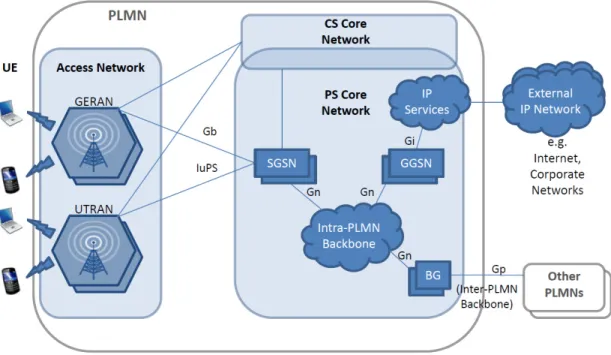
The core network consists of two main domains, packet switched (PS) and circuit switched (CS). They share some entities handling general information such as mobility management and subscriber information, as well as have certain domain specific entities. There are three main interfaces in the packet switched core network; one to access network, one to other PLMN’s, and one to external packet data (or other) networks. External packet data networks are usually either private corporate networks or public networks, i.e., the Internet. The logical architecture of GPRS (General Packet Radio Service)/UMTS networks is presented in Figure 4, including the main interfaces and network entities.
Figure 4 GPRS/UMTS architecture with the main interfaces (adapted from Kivi, 2006)
The packet switched core network consists mainly of GPRS Support nodes (GSN), including Serving GPRS Support Nodes (SGSN) and Gateway GPRS Support Nodes
17
(GGSN), which handle the packet transmissions between the main interfaces. The GSNs are interconnected via a GPRS backbone network usually based on IP.
As a central part of the packet switched core network, SGSN has multiple tasks. It takes care of routing traffic, session and location management, as well as includes authentication and charging functions, for instance. It is connected to the access network via Gb (GERAN) or IuPS (UTRAN) interfaces, forwarding traffic from a mobile device to the right GGSN (Gn interface) through the core network backbone (3GPP TS 23.060). Thus, information that SGSN needs to store include both, subscriber data, including subscription information such as IMSI and PDP (Packet Data Protocol) addresses (usually IP), as well as location information, for example, routing area information and addresses of GGSNs with active PDP contexts. (3GPP TS 23.002)
GGSN’s main function is to provide interworking with external PS networks. Also GGSN stores both, subscriber and location data, including IMSI, possible PDP addresses, and the SGSN addresses where UEs are registered. GGSN and SGSN functions can be in separate physical entities, or it is also possible to integrate them into a single physical entity. (3GPP TS 23.060) In reality there is often a many-to-many relationship between SGSNs and GGSNs, meaning that a SGSN may provide service to many GGSNs and one GGSN can be in contact with many SGSN’s to route traffic to all the geographically dispersed mobile stations. (3GPP TS 29.060)
In addition, there is a third component called a border gateway, which is an entity connecting PLMNs in the GPRS/UMTS architecture. In practice, border gateways (BG) are SGSNs or GGSN, and the Gp interface includes the same functionalities as the Gn, except that some security needed for inter-PLMN transmission is added (3GPP TS 23.060).
18
2.2.4 Data transmission in mobile networks
Data transmission via a mobile network to outside IP networks, such as the Internet, is more complex than in fixed Internet access networks where, for instance, no session or mobility management functions exist. Even though mobile devices can nowadays use the TCP/IP protocol suite, the process of transmitting the data to external networks requires also protocols specified by 3GPP. The basics of data transmission in mobile networks are described next.
First, before data transmission can take place a mobile device has to make it available by doing a GPRS attach to a SGSN, which checks that the user, and possibly the device, is authorized and assigns a P-TMSI for the user. After this, the mobile device applies for a PDP address, which is allocated by a GGSN chosen by the SGSN. After the creation of the PDP context, the mobile subscriber is visible to external networks via the PDP address. (Bettstetter, 1999) It is possible for a user to have multiple simultaneous PDP contexts active, meaning that every application can have its own PDP context attached to a different GGSN. This is why there are two kinds of PDP contexts possible; primary and secondary. The primary PDP context has a unique IP address and other context information, whereas secondary PDP contexts adopt the IP address and context information from the primary PDP context. Simplified GPRS attach and PDP context activation procedures are presented in Figure 5.
19
Figure 5 Simplified GPRS attach & PDP context creation procedures (adapted from Svoboda, 2008)
Inside the GPRS/UMTS backbone, between the GSNs (Gn interface), traffic is tunneled with a GPRS Tunneling Protocol (GTP). In practice it means that the traffic is encapsulated with a GTP header between SGSNs and GGSNs. Thus the backbone network is transparent to the user, as the tunnel is decapsulated in the GGSN after which the traffic continues as plain IP traffic. GTP is transmitted on top of UDP and is used with both, control (GTP-C) and user traffic (GTP-U). Control plane provides functionality to create, delete, and modify GTP tunnels, whereas user plane only transfers user data and takes care of routing it. (Bannister et al., 2004)
From a subscriber viewpoint, an Access Point Name (APN) is used in a PDP context as a reference to a GGSN, meaning that a user does not have to care about which SGSN and GGSN to use. The APN selection is handled by DNS functionality in the core network, which returns the IP address of a correct GGSN for the SGSN, which handles a certain
20
geographical area. The APN is in a readable format including two parts, an APN Network Identifier and an APN Operator Identifier. They identify the external network that the GGSN is connected to, and in which PLMN GPRS backbone the GGSN is located in, respectively. From these the latter is optional. (3GPP TS 23.003) Thus, often Internet APN is in readable form, such as “internet” or “internet.operator”, providing a simple access point name for the subscriber to be used. Also other access points, such as WAP (Wireless Application Protocol), act in a similar manner and only the access point name differs for the end user in connecting to operator on-portal services.
21
3
Internet traffic measurements
Internet traffic measurements are conducted for a variety of reasons and objectives. They are often performed to characterize, to monitor, or to control the network. For a network operator, monitoring and controlling the network are essential parts of its operation and maintenance. On the other hand, longer time-scale traffic characterization is often related to network research activities. (Peuhkuri, 2003) These characterizations canbring both, technical and commercial information on how to run the network and what kind of traffic is transferred in the network. User behavior and usage characteristics interest many entities, including academic, regulative, as well as corporate entities, but these issues have not been studied academically as much as the more technical aspects.
First in this chapter, different measurement methods are classified. Second, different user, device, and application identification approaches are discussed. Third, traffic measurement research in the mobile context is reviewed and measurement points in mobile networks are discussed. In addition, extractable information from each measurement point is described.
3.1
Measurement types
The measurement type or setup is mainly affected by the measurement objectives. As traffic measurements can be conducted in multiple parts of a network, the measured trace data has to be representative for the phenomenon that is studied. Thus, the choices of the measurement location and granularity of the data are important.
22
Location describes the part of the network and the traffic that is measured. In general, measurements can be conducted at different nodes or links in the network and in single or multiple locations. On the other hand, granularity of the data, i.e., the level of detail, defines the metrics that can be used. (Peuhkuri, 2003) If Internet usage characteristics are measured, utilization metrics, such as byte count and application distribution, can be used. However, as traffic volume as such, for example, is not always the best metric to describe usage, new metrics may have to be created to match the objectives better. Time scale of a measurement means both, the scale of the measurement period, as well as the continuity of it. Some measurements are sample based by nature, whereas sometimes sampling is conducted to save resources, for instance. However, Smith et al. (2001) argue that web traffic measurements, for example, have to be at least hours long to capture fully the long tail of distribution.
The measurement hardware needs to be physically attached to the point of measurement. Viipuri (2004) describes two common ways to connect measurement hardware to the network. The first method is network tapping, which includes a passive method of splitting either an optical or a copper link. Another method is port mirroring, in which one or more ports in a switch are mirrored to another port connected to the measuring device. This method requires certain functionality from the switch, which is the method’s weakness, whereas network tapping is applicable to almost all kinds of networks.
3.1.1 Active & passive measurements
Another measurement categorization can be done between active and passive measurements. In active measurements there is always some excess traffic sent to the network and analyzing the response. Examples of metrics analyzed in active measurements are latency, jitter, and packet loss.
23
However, as unobtrusiveness is often one objective of measurements, active measurements would bias the results. Another way is to conduct passive measurements, in which no additional traffic is sent to the network. Passive methods are usually preferred and active or hybrid solutions are only used when passive measurements are not applicable. An example is a case where not enough traffic streams are present (Viipuri, 2004)
3.1.2 Trace data & post-processing
The measurement analysis can be done both, online or offline (Williamson, 2001), affecting whether the result of the measurement is trace data for further analysis, or a direct report of the real time analysis. As the latter requires high processing power, the traffic is often recorded on-location and the analysis is made afterwards. From the measured packets different information can be recorded. In general, the measurement can record protocol headers, protocol payload, certain fields in the headers or payload, or simply all the data.
Packet level data can be provided by, for instance, network and transport level header measurements. One reason for recording only headers is the huge amounts of data traffic in high speed network links. However, from high bandwidth links, even the headers produce high amounts of trace data. Thus, one way of post-processing packet level traces is to aggregate them to a flow level to compress the amount of data. There are multiple free tools to do the aggregation. For instance, a tool called CoralReef3
3 CoralReef:
takes
de facto pcap-format (Packet Capture) packet trace data as input and outputs five-tuple flows with a wanted timeout and an interval period.
24
If application level traces are needed, also the transport protocol payload, in other words the application level data, is measured. As application level protocol headers may be of highly varying lengths, either only certain amount of the application level data is recorded from the beginning, i.e. the headers, or all data is saved. If real time processing is conducted, only the significant fields can be saved for later use, decreasing the amount of trace data.
3.2
Identification of users & devices
There are only few ways to identify unique users and devices directly from IP traffic. User identification can be done directly from IP addresses if static IP address pooling is used. However, as dynamic IP address allocation is popular in mobile networks nowadays, this method cannot be always relied on. In mobile networks, where user authentication is conducted in the core network, the measurement point can be selected from a part of the network where user identification information is available. On the other hand, these measurements are often no longer plain IP traffic measurements as there are mobile network specific protocols in use, meaning that proprietary tools have to be developed for the purpose. Nevertheless, there are solutions to identify the operating system (OS) of a mobile device from plain IP network traffic, which can give indicative information about the device. The method is rather simple, yet some trade-offs have to be made as single user level identification accuracy is not achieved.
3.2.1 Operating system identification
If unique user identification or device identification is not possible, an alternative is to identify the OS by TCP fingerprinting, which can be conducted directly from TCP and IP headers. Another possibility would be to use HTTP protocol user agent field that
25
provides information on the used browser, operating system, and possibly even device. However, this method is bound to HTTP traffic only, creating issues with other protocols.
The principle of OS fingerprinting is that every operating system has its own idiosyncrasies in the TCP/IP stack that enable identifying them from each other. Thus the traces obtained by measurements can be analyzed by comparing certain IP and TCP headers to previously known signatures of different operating systems. Smith & Grundl (2002) have listed four and Peikari & Chuvakin (2004) eight TCP areas that can be inspected in TCP fingerprinting for operating system determination. The common fields in both these lists are the initial TTL (Time to Live), the Window Size, and the “Don’t fragment” flag. In addition, Peikari & Chuvakin (2004) mention the Maximum Segment Size (MSS), the Initial Packet size, as well as the No Operation (NOP), Selective Acknowledgment Permitted (SackOK), and Window Scaling options. Operating systems tend to use default values for these fields and the combination of all these fields tend to be unique with each operating system.
There exist several active and passive tools to do OS fingerprinting, e.g. Ettercap (passive), p0f (passive), and Nmap (active). According to Zalewski (p0f, 2006), p0f was the first application to start using a SYN4
However, there are some limitations with TCP fingerprinting. The manipulation of the different fields is rather easy and can be done manually by the end-user, by an application, or by a network node such as a gateway or a firewall. However, manual field
-based passive fingerprinting technique and provides rather accurate results.
26
manipulation is not by any means presumable by an average end user, as it requires detailed knowledge on how to do it. In addition, there has to be a database of known fingerprints to compare the network traffic with. The process of updating the fingerprints requires time and resources, as well as an access to the latest devices and operating systems.
3.3
Application identification
There are different ways of doing application identification from traffic measurements. This chapter introduces three different methods that have been studied and used in past literature.
3.3.1 Port based method
A simple method in application identification is to use well known protocol port numbers. An advantage of identifying applications by port numbers is that the process is straightforward and easy to implement. Many well known applications use registered ports, for example, HTTP (port 80) and POP3 (port 110), which are publicly listed by the Internet Assigned Numbers Authority (IANA)5
5 IANA Port Numbers.
. The port numbers are divided into three ranges. The well known ports include the range 0-1023, the registered ports the range 1024-49151, and the rest of the ports (49152-65535) are private ports not assigned to any specific applications. Port based application identification can be done by proprietary scripts, as well as with commercial or freeware tools, for instance, CoralReef. The CoralReef API (Application Programming Interface) consists of methods to manage application rules, which are given as input, and to search them for matching applications to the protocol and source and destination ports.
27
Recently the use of the port based method has been decreasing. One reason for this are the uncertainties that arise when trying to get application level information from the transport level traces (Smith et al., 2001). Many emerging applications use dynamic ports and some applications may try to masquerade as web traffic, because firewalls sometimes limit other application protocols except HTTP (port 80). In addition, network address translators and gateways can hide the original port information. Thus, the method is at its best when identifying conventional applications. Some authors accuse the port based application identification method to be too inaccurate with the emerging applications and its use alone in application identification Internet traffic has been questioned (see, e.g., Moore & Papagiannaki, 2005; Kim et al., 2005). To increase the accuracy of the port based method additional port information can be gathered. However, this includes often a lot of manual work as reliable references are hard to find.
3.3.2 Payload inspection
One alternative for port based identification is to inspect the TCP/UDP payload, i.e., application level data. These methods are also called Deep Packet Inspection (DPI). They include finding signaturesfrom the application level and matching them to signatures of previously identified applications. In practice, they can be hybrid solutions using also transport level information. For instance, Moore & Papagiannaki (2005) were able to increase the accuracy of application identification with the payload method in comparison to a plain port based method. In addition, Sen et al. (2004) created a DPI classification approach based on individual packets and noticed significant improvement in P2P connection identification.
Payload inspection introduces also multiple issues. Moore & Papagiannaki (2005) argue that often almost all the payload has to be studied to be able to find the correct application. Payload inspection is resource-intensive, meaning it scales poorly to
28
increasing bandwidths, and does not work on encrypted traffic. Furthermore, problems on legal and privacy side arise as the application level data may include sensitive information. In addition, the classifier needs to know the payload syntax of all traffic it identifies. As new applications emerge all the time the need of manual work for the syntaxes is increasing (Nguyen & Armitage, 2008). For the problem of increased manual work, some automatic application signature solutions have been developed (Haffner et al., 2005). However, many of the fully automated methods have been able to identify only conventional applications (Kim et al., 2008). Thus a trade-off between the accuracy and available resources has to be made.
3.3.3 Advanced statistical and machine learning methods
Lately also other advanced ways of identifying applications, relying neither on plain port numbers nor application payload, have been developed. These methods often use statistical patterns of easily observable attributes from the transport or network levels, such as packet lengths, inter-packet arrival times, etc. (Nguyen & Armitage, 2008). The amount of recent research on these areas is increasing and some authors have compared and categorized alternative approaches.
Kim et al. (2008) make a distinction between two general traffic classification approaches that use different features in the classification, namely host-behavior based and flow features based methods. Host-behavior based methods use the “social interaction” information of hosts to define the applications, including also the ports. One application of this method is BLINC (Blind Classification). BLINC inspects multiple flows at a time during a certain interval and studies the host to host behavior during that interval (Karagiannis et al., 2005). Thus the measurement point for this method is important, as it needs all traffic between two hosts. BLINC includes a substantial downside of misclassifying rarely transferred flow types in the network as unknown.
29
This error needs to be corrected by, for instance, using some flow-level machine learning method (flow features based method) for the unknown part of the traffic. Thus, in practice two methods have to be implemented when using BLINC. In addition, Kim et al. (2007) have accused the parameter tuning in BLINC to be too cumbersome.
Flow-features based methods use information such as duration, number and size of packets per flow, as well as packet inter-arrival times utilizing machine learning. The amount of features that are used in flow-based classification can vary from a few (Crotti et al., 2007) to hundreds (248 features identified in Moore & Zuev, 2005). The simplest methods can be basically enhanced port based identification with additional rules, whereas the complex ones require high processing and memory capabilities. There are some software suites available that have been used with machine learning methods, such as WEKA6
Nguyen & Armitage (2008) divide machine learning methods into two general groups; unsupervised (also called clustering) and supervised learning. The supervised machine learning methods are more capable of classifying earlier identified applications, whereas unsupervised can also be used in finding new applications.
.
The unsupervised approaches cluster flows with similar characteristics together. Thus no training for the classifier is needed. An advantage of unsupervised methods is the automatic discovery of classes through the recognition of clusters in the data. However, these clusters have to be somehow manually labeled afterwards. In addition, the clusters may not map one to one with the applications classes wanted. Thus the amount of clusters can be larger than application classes, for instance. On the other hand,
30
unsupervised methods can identify also emerging applications with beforehand unknown traffic characteristics.
In supervised learning methods a pre-labeled training data exists, and a model is produced to fit the training data. Kim et al. (2007) have classified supervised learning methods into five approaches based on the used model. Examples are Bayesian (e.g., Bayesian Networks) and function (e.g. Support Vector machine) based methods. In supervised learning the labeling of the training data is classified manually in advance, which requires time and resources. On the other hand, these supervised algorithms can then be tuned to detect also subtle differences between flows that match the applications or application groups, which is uncontrollable with unsupervised methods. In addition, supervised methods can label a flow right after its termination, which is not possible with the clustering methods that need the whole dataset (Kim et al., 2008). According to Nguyen & Armitage (2008), using Bayesian trained neural networks in supervised learning an accuracy of up to 99% is possible.
Machine learning techniques with IP network traffic application identification have some general open questions. It is not known how well they perform with behavior such as packet loss, fragmentation, and jitter. In addition, they are not an absolute answer with newer applications like P2P and video streaming that are harder to identify. Kim et al. (2008) have summarized general challenges of machine learning methods into three. First, it is hard to find the key features that capture the fundamental characteristics of different applications. Second challenge is the trade-off between accuracy of the method and the computational cost, as the methods tend to get complex. Third, finding datasets with representative data to provide the fundamental characteristics of applications is difficult.
31
3.3.4 Other advanced methods
In addition to the approaches presented above, also other advanced approaches exist, often combining different methods. One recent combinatorial approach presented by Canini et al. (2009) is called GTVS (Ground Truth Verification System) and has multiple iteration rounds with different methods. The identification is made on application level information, flow statistics, host-level connection statistics, host name information, and transport-layer behavior level, thus including basically all the aforementioned methods. Canini et al. (2009) have used their application identification method GTSV also for HTTP traffic classification, including 14 categories that are presented in Table 1. Motivation for this is the expanded role of HTTP protocol in other than plain web browsing use. The advantage of this method is the added information about web traffic, which often is interpreted as web browsing as analysis methods do not have the functionality to do more accurate identification. Different classes are identified with combinations of different HTTP header fields, such as user agent, host name, and content type. An interesting detail about the research by Canini et al. (2009) is that they have planned to publish the tool and the rule sets to be used by other researchers in the future.
32
Table 1 Web traffic classification categories (adapted from Canini et al., 2009)
Class Activities
Web Browsing visiting web pages using a web browser
Web App applications via web interface: e.g. Java applets, web gadgets
Crawler bots crawling web pages
File Download file downloading over HTTP
Webmail web based e-mail services
Advertising advertisement on a web page or embedded in software
Multimedia streaming media or viewing media files on web pages
SW update software update over HTTP
News Feeds RSS feeds
Link Validator automated link validators
Calendar calendar application based on web, e.g., ical, gcal
Attack malicious traffic over HTTP
IM Windows Live Messenger
Monitoring network monitoring
In addition to general application identification, also more specific research on certain application categories has been conducted, concentrating rather heavily on P2P applications. For instance, Svoboda et al. (2009) have used a cross layer method in VoIP (Voice over IP) classification, Karagiannis et al. (2004) used transport level information and the first 16 bytes from the payload to identify P2P applications, and Sen et al. (2004) used an application level P2P classifier to identify five common P2P applications.
3.3.5 Comparison of the application identification methods
As the research especially on flow-features based methods is rather active at the moment and lots of publications are available, comparative studies have also been conducted. For instance, Kim et al. (2008) and Nguyen et al. (2008) have listed and compared different flow features based methods. In addition, Kim (2007) has done