D
ata that isn’t accurate can easily do more harm than good, and structured data of the sort used by applications needs to be up todate, coded consistently, and defi ned pre-cisely. Maintaining a high level of data qual-ity is the sine qua non of getting data to do
4
Data Quality and Analytics
To dispose ideas in Memory, and aptly to use them,is a work of Understanding, not of Memory.
—John Willis
Key Findings
Overall, respondents were lukewarm in their self-assessments of data quality in major administrative enterprise systems. An enterprise data quality score summarizing eight different data-quality-related measures averaged 3 (on a scale of 1 to 5) across the whole respondent population.
Higher data quality scores were associated with earlier adoption of new technologies, stronger agreement that the institution provides data quality training to employees, and stronger agreement that central IT works actively with business/academic units to ensure data quality.
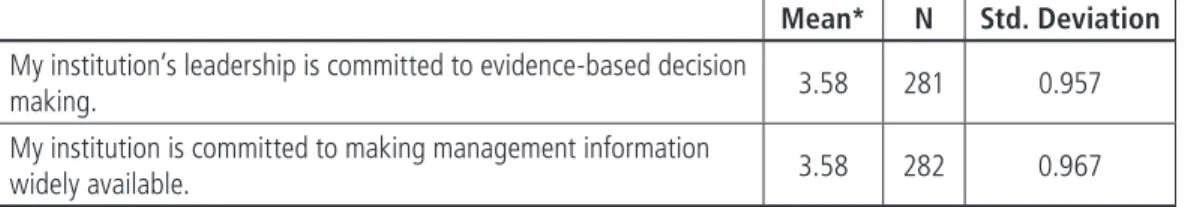
Respondents tended to agree that their institution’s leadership was committed to evidence-based decision making, and that their institution was committed to making management information widely available.
Infrastructure for analytics was modest among our respondent institutions, with 4 out of 10 reporting that they didn’t have any of the four data store types we asked about, and another 2 in 10 reporting only one. About one-third of institutions said they have an institution-wide data warehouse.
The primary use for analytics tools is either extraction and reporting of transactional data or analysis of operational performance. Only about one in eight institutions reported what-if decision support, predictive modeling, or auto-triggering processes as their primary use. However, these advanced uses are commonly employed for specifi c situations on at least an occasional basis.
More than half of institutions said they plan to upgrade their analytics capability in the next two years. At the same time, we found no signifi cant differences in analytics infrastructure or use between 2005 and 2009 among the 112 institutions that responded to ECAR academic analytics surveys in both years.
u u u u u u
0
work—providing information that helps the institution fulfill its mission.
But even perfectly complete and accurate data doesn’t just jump up and tell administra-tors how their institution is doing. A lot of infrastructure is needed to make data readily available for analysis. Just as important is an institutional culture that’s committed to sharing data as needed and bringing it to bear on decision making. ECAR studies commonly find that the use of metrics and data-driven management processes is related to successful IT outcomes.
In this chapter, we consider the “hands-on” aspects of data management, with an emphasis on structured business data. We begin by looking at how institutions assess the documentation, consistency, and reli-ability (in short, the quality) of data in major administrative systems and at what they’re doing to maintain and improve data quality. Next, we look at how institutions make data available for analysis and the kinds of analytical processes they use to manage the institution.
Assessing Enterprise
Data Quality
Often, the most powerful and valuable data in an institution passes through many hands, because it’s used for different purposes by different departments. Because of the challenges of managing this kind of enterprise data and its potential for helping administra-tors improve institutional performance, our survey looked in detail at how institutions approach data quality in their major admin-istrative enterprise systems and data stores.1 We began by probing respondents’ views of their institutions’ performance in assorted enterprise-data-related measures, which we examine below first in detail and then in a more summary fashion by calculating a data quality score based on the detailed responses. Because promoting data quality relies on the awareness and participation of many parties,
we also asked respondents whether their institutions provided data quality training and to assess how well constituents understood data quality issues. Finally, we looked at insti-tutional initiatives to improve data quality.
Enterprise Data Characteristics
and Quality in Detail
We asked a series of questions about data-quality-related characteristics of major data elements (defined as data items essential to conducting basic business and academic operations, such as student name or employee status) and about processes to validate data and ensure its quality. Most of our ques-tions related to major administrative enter-prise systems and data stores, though one item asked about business/academic unit (“shadow”) systems.
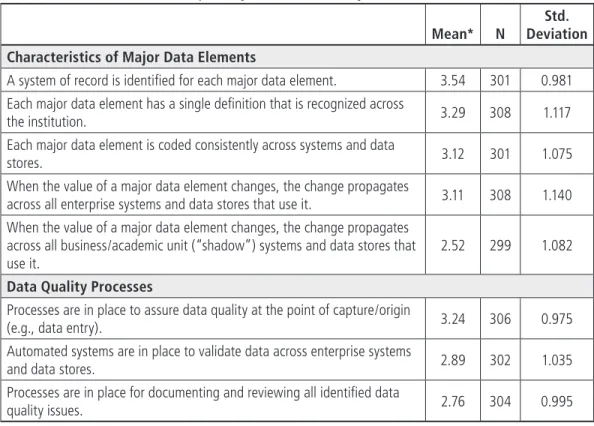
We didn’t find respondents terribly enthu-siastic about their institutions’ performance on these enterprise data quality measures. Means were for the most part only mildly positive and in some cases fell short of an average neutral (3) response (see Table 4-1). For only one item, that a system of record was identified for each major data element, did a large majority of respondents (64.2%) agree or strongly agree. A more modest majority (53.3%) agreed or strongly agreed that each major data element had a single definition recognized across the institution; combined agreement was below 50% for all the other items. For the statement that changes in the value of a major data element propagate across all business/academic unit (“shadow”) systems and data stores that use it, combined disagreement was 58.8%.
Regarding data quality processes, although respondents were modestly positive in agreeing that processes were in place to assure data quality at the point of capture or origin, their mean agreement fell below neutral on items relating to the existence of automated systems to validate data across enterprise systems and data stores (mean 2.89) and to
having processes in place for documenting and reviewing all identified data quality issues (mean 2.76).
Taken as a whole, we interpret our enter-prise system data management measures results as evidence that institutions are struggling to treat data in a truly enterprise manner. Although major data elements gener-ally seem to have a home in some system of record, presumably enterprise resource planning (ERP) systems, respondents were neutral on average—and substantial minori-ties disagreed—that data is consistently coded and that changes propagate appropriately even in enterprise systems. When major data elements make their way into business and academic unit systems, the results are less positive still. No one who has attempted to collect and interpret accurate, synchronized data from across different business processes and time frames will fail to see the potential
for error, inefficiency, and unrealized data value in such results.
Even IT administrators selected for quali-tative interviews because of their institu-tions’ relatively high self-ratings for data quality freely acknowledged the difficulties of addressing data quality in a systemic, enterprise-oriented way. “Data quality is one of my real concerns,” reported Marc Hoit of North Carolina State University. “A few data elements, such as grade and salary, are self-correcting. And accountants have been doing reconciliations for what?—at least 300 years. But this only verifies some things.” Hoit believes that data quality, often seen as a precondition for an analytics capability, could in turn best be improved through analytics. “I think we can use trend analysis, detecting outliers, getting information on data flow and data changes to identify problems. Are things positively correlated that should be?”
Table 4-1. Administrative Enterprise System Data Quality Measures
Mean* N DeviationStd. Characteristics of Major Data Elements
A system of record is identified for each major data element. 3.54 301 0.981 Each major data element has a single definition that is recognized across
the institution. 3.29 308 1.117 Each major data element is coded consistently across systems and data
stores. 3.12 301 1.075 When the value of a major data element changes, the change propagates
across all enterprise systems and data stores that use it. 3.11 308 1.140 When the value of a major data element changes, the change propagates
across all business/academic unit (“shadow”) systems and data stores that use it.
2.52 299 1.082
Data Quality Processes
Processes are in place to assure data quality at the point of capture/origin
(e.g., data entry). 3.24 306 0.975 Automated systems are in place to validate data across enterprise systems
and data stores. 2.89 302 1.035 Processes are in place for documenting and reviewing all identified data
quality issues. 2.76 304 0.995
2
At the Community College of Rhode Island, CIO Stephen Vieira stated that a lot of effort has been put into training data entry personnel and establishing data quality standards and guidelines—“data quality is an issue we are constantly working on,” he said—but he also noted the potential for advanced, downstream data management capabilities to feed back into the earlier stages of the data life cycle. Now in the process of implementing a new operational data store and data warehouse, Vieira observes that “the data warehouse part takes in ERP and shadow database elements so that users can incorporate both into the reports they write. The shadow data has to be consistent with the ERP data, and if not, the authoritative database takes precedence.”
Enterprise Data Quality Score
To get an overall measure of enterprise data quality, we created a score for each institution by calculating the mean of the eight enterprise system data characteristics and data quality process items shown in Table 4-1.2 For all respondents, the data quality score average fell right in the middle of the scale at 3.06, though there was considerable variation: 22.7% scored below 2.50 and 27.9% scored above 3.50. To distinguish this score from the agreement scales it is derived from, we characterize its value range simply as low (1) to high (5).
This enterprise data quality score proved to be powerfully associated with many other measures, and we report these associa-tions throughout this study. In particular, as we discuss in Chapter 8, we found strong associations between enterprise data quality score and data management outcomes: Every outcome measure we asked about was signifi-cantly higher among institutions with higher data quality scores. Another interesting set of positive associations, reported in the section below (see Table 4-3), relates to data quality training and constituent understanding of data quality issues.
For present purposes we note two other intriguing associations: Early technology adopters tended to have higher scores than late adopters, and institutions reporting greater agreement that their identity manage-ment capabilities provided sufficiently granular user data access authorization also tended to have higher scores (see Table 4-2).
It may be that earlier adopters of new technologies are better equipped with the tools to manage data quality (for example, they agree more strongly than do late adopters that their institutions have auto-mated systems in place to validate data), or they may tend to deploy systems with more modern architectures and stronger integration tools that minimize the amount of replicated and unsynchronized data.
Identifying even speculatively a link between identity management authorization granularity and data quality is more difficult, though in general, robust authorization implies scrutiny of identity and role informa-tion, good integrainforma-tion, and a more formal data access regime. In ECAR’s 2006 study of identity management, we found many interviewees voicing some variation on the lament that “we have 25 definitions of what a student is.” Cleaning up and rationalizing such environments is often a prerequisite to improving identity management.3 However, as with all the associations we note here, the relationship could work either way; we cannot say whether better data quality leads to more granular identity management, or the other way around.
Training, User Understanding,
and Central IT/Business Unit
Interaction
Our respondents tended to represent training in data quality largely as something staff receives, rather than management and leadership. As Figure 4-1 shows, large majorities of respondents disagreed or strongly disagreed that either executive leaders or business and
academic unit leaders receive training in data quality, though combined disagreement was lower for the unit leaders than for the execu-tives. Even for staff, nearly 3 in 10 respondents
disagreed that staff receives training, though a slight majority agreed that they did.
Respondents agreed more strongly that each of these groups understood data quality
Table 4-2. Enterprise Data Quality Score, Overall and by Technology Adoption and Identity Management User Access Granularity
Enterprise Data Quality Score
Mean* N Std. Deviation
All respondents (mean of all enterprise data quality responses)
Enterprise data quality score 3.06 308 0.786
What best characterizes your institution in terms of adopting new technologies?
Early adopter 3.55 32 0.638 Mainstream adopter 3.12 201 0.758 Late adopter 2.71 73 0.785
My institution’s identity management capabilities provide sufficiently granular user data access authorization.
Strongly disagree/disagree 2.79 108 0.843 Neutral 3.07 74 0.746 Agree/strongly agree 3.30 124 0.681
*Scale: 1 = low, 5 = high
0% 10% 20% 30% 40% 50% 60% 70% 80% 90% 100% 74.5 15.2 10.3 Executives (N = 302) 27.9 18.4 53.8 Staff (N = 305) 17.3 19.2 63.5 Staff (N = 307) 23.7 25.0 51.3 Business/academic unit leaders (N = 304) Understand Data Quality Issues
59.0
14.8 26.2
Business/academic unit leaders (N = 305) Receive Training in Data Quality
Percentage of Institution s Agree/strongly agree Neutral Strongly disagree/disagree 33.7 26.4 39.9 Executives (N = 303) Figure 4-1. Training in Data Quality and Understanding of Data Quality Issues, by Constituent Group
issues than that they were trained in them. This is not to say that they thought such understanding was universal; only about 4 in 10, for example, agreed or strongly agreed that executives understood data quality issues. Nor does it indicate that training makes no difference; in each case, the agreement about the group’s understanding of data quality issues was highest among those who agreed or strongly agreed that the group received training. This was especially notable for staff: Respondents who disagreed or strongly disagreed that staff received training in data quality averaged only a 2.75 (below neutral) agreement that staff understood data quality issues; among those who agreed or strongly agreed about training, the corresponding understanding mean was 3.98 (agree).4
Taken as a whole, then, our results suggest that understanding of data quality issues is widespread, though more so at staff level than at management and executive levels. The contrast between training and understanding
in our results suggests that respondents see users often picking up knowledge of data quality issues through on-the-job experience rather than through formal training. Just the same, where users are getting training, there is a greater perception of better under-standing. Although the picture overall is far from bleak, it does suggest that CIOs will find it more challenging to communicate data quality issues the farther they go up the management chain, and that a reservoir of misunderstanding of data quality issues exists at some institutions.
Perhaps one factor leading respondents to be more positive about data quality under-standing than training is that they seem to work often with users on data quality issues. Three-quarters of respondents (76.4%) agreed or strongly agreed that central IT works actively with business and academic units to ensure data quality (see Figure 4-2), and overall mean agreement was 3.88, close to an average agree (4) response.5 Agreement
Figure 4-2. Central IT Works Actively with Business/ Academic Units to Ensure Data Quality (N = 309) Strongly disagree, 1.6% Disagree, 6.1% Neutral, 15.9% Agree, 55.7% Strongly agree, 20.7%
about training and user understanding of data quality issues for all constituent groups was higher at those institutions that reported higher agreement about working actively with business and academic units. This makes sense, given the complex way that functional and technical issues can intertwine with data items. Stephen Vieira of the Community College of Rhode Island noted that at his institution, data quality training is largely concentrated in the user departments, with assistance from the institutional research group, but “IT is there to assist. We listen to learn what the stumbling blocks are, so we can look into how to change the system to
make things easier and more accurate. For their part, the users get a good picture of why errors are occurring.”
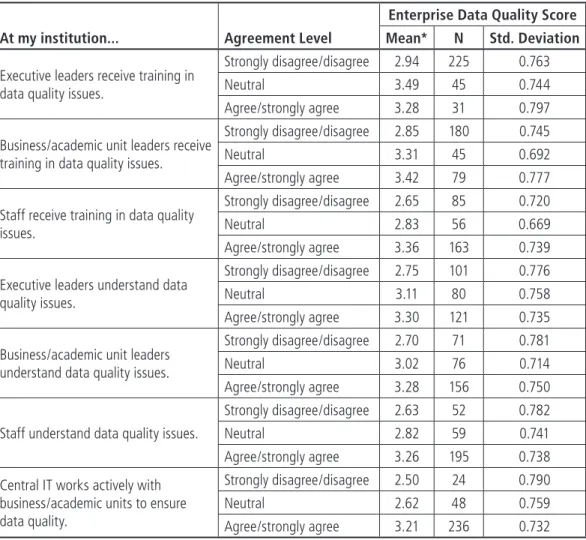
The good news cutting across all these results is that judging from the associations we found, data quality is associated with active effort and constituent understanding. As Table 4-3 shows, for every item reported in this section—training and understanding among all three constituent groups, and central IT working actively with business and academic units—mean enterprise data quality scores were positively and signifi-cantly associated with higher respondent agreement.
Table 4-3. Enterprise Data Quality Score, by Respondent Agreement on Data Quality Training, User Understanding, and Central IT Interaction
At my institution... Agreement Level
Enterprise Data Quality Score
Mean* N Std. Deviation
Executive leaders receive training in data quality issues.
Strongly disagree/disagree 2.94 225 0.763 Neutral 3.49 45 0.744 Agree/strongly agree 3.28 31 0.797 Business/academic unit leaders receive
training in data quality issues.
Strongly disagree/disagree 2.85 180 0.745 Neutral 3.31 45 0.692 Agree/strongly agree 3.42 79 0.777 Staff receive training in data quality
issues.
Strongly disagree/disagree 2.65 85 0.720 Neutral 2.83 56 0.669 Agree/strongly agree 3.36 163 0.739 Executive leaders understand data
quality issues.
Strongly disagree/disagree 2.75 101 0.776 Neutral 3.11 80 0.758 Agree/strongly agree 3.30 121 0.735 Business/academic unit leaders
understand data quality issues.
Strongly disagree/disagree 2.70 71 0.781 Neutral 3.02 76 0.714 Agree/strongly agree 3.28 156 0.750 Staff understand data quality issues.
Strongly disagree/disagree 2.63 52 0.782 Neutral 2.82 59 0.741 Agree/strongly agree 3.26 195 0.738 Central IT works actively with
business/academic units to ensure data quality.
Strongly disagree/disagree 2.50 24 0.790 Neutral 2.62 48 0.759 Agree/strongly agree 3.21 236 0.732
On the other hand, we found no differ-ences in enterprise data quality scores on the basis of Carnegie class, research versus teaching mission, FTE enrollment size, or public/private control. Higher enterprise data quality, it appears, doesn’t just happen, and it isn’t just the preserve of a certain kind of institution. It flourishes in environments where training, understanding, and central IT involve-ment with other units take place.
Data Quality
Improvement Initiatives
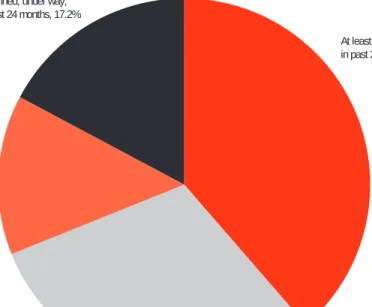
We found a lot of activity relating to data quality improvement. Three in 10 institutions had a data quality improvement initiative under way at the time of our survey, and an additional 4 in 10 said they had completed at least one such initiative in the past 24 months (see Figure 4-3). Another 13.9% were planning one. This is probably a floor for activity, since we suspect that respondents probably would not regard routine data-quality-related work as rising to the level of an “initiative.” The institutions that reported completed, planned, or in-progress
initia-tives seemed to perceive greater pressures from outside central IT than did institutions with no initiatives. They averaged higher agreement that users and executive leaders were demanding improved institutional data management capabilities and were more likely to agree that improved data manage-ment was a strategic priority.
As for more specific incentives, as Figure 4-4 shows, the most common factor causing institutions to undertake data quality initia-tives was improving reporting and analysis. Initiatives related to specific application or data warehouse/data mart implementations or upgrades were less common, though roughly half of respondents reported them in each case. Leadership mandates for data quality improvement were the least often selected among our five specific factors, though even so, slightly over a third of respon-dents chose them.
IT and administrative officers dominated the results from a question asking those respondents at institutions with completed, planned, or in-progress data quality tives to identify who sponsored the
initia-At least one initiative completed in past 24 months, 38.5%
Initiative under way, 30.4% Initiative is planned, 13.9%
No initiative planned, under way, or completed in past 24 months, 17.2%
Figure 4-3. Data Quality Improvement Initiatives at Institutions (N = 309)
tives (choosing all that applied from a list of nine options). As Figure 4-5 shows, the CIO or equivalent was by far the most common sponsor, and administrative executives followed. The top five sponsors were all either from IT or administration. Presidents were named as sponsors by a surprisingly high 25% of respondents with initiatives, and they were a little more likely to be sponsors at institutions whose respondents agreed or strongly agreed that leadership was demanding improved institutional data management. Though academic titles fall toward the bottom of our chart of sponsors, overall 40.2% of respondents in the active initiative categories named either an academic executive or other academic management, or both, as sponsors (this percentage does not include presidents).
Where initiatives have been completed, respondents do not seem to feel they have simply patched problematic data. Asked if their data quality initiatives resulted in process changes that improved data quality throughout the data life cycle rather than just fixing bad data, 68.4% agreed or strongly agreed, and only 11.1% disagreed or strongly disagreed (see Figure 4-6). Mean agreement was 3.62 on our 1-to-5 agreement scale, and the median response was 4.0.6
Data Analytics
Much institutional data originates in the need to carry out a transaction—to register a student in a course or pay a bill. Administrative systems in the last generation have worked a revolution in getting these mundane jobs done, not just by automating and acceler-ating processes, but also by empowering constituents to directly address their needs in real time, without the once-feared trip to the administration building.
But modern administrative systems have promised something more: the ability to aggregate all that transactional data into an accurate picture of a dynamic, living institu-tion. In principle, the data flowing through today’s relational databases and sophisticated system architectures should allow administra-tors not just to put the right student in the right course, but also to assess the student’s, or the course’s, history and compare it with the history for all other students or courses. With so much of the institution’s activity mediated through shared systems, it should be possible to mix and match data elements across time and organizational boundaries and to analyze them not just to find past patterns and current performance but also to create informed models and scenarios looking to the future. Likewise, it should be
0% 10% 20% 30% 40% 50% 60% 70% 80% 90% 10.5 34.8 48.0 57.8 67.6 75.8
Percentage among Institutions with Initiatives Completed, Planned, or in Progress Other
Institutional leadership mandate for data quality improvement Data warehouse or data mart implementation/upgrade Application system implementation/upgrade Improve business processes Improve reporting/analytics Figure 4-4. Factors Causing Institutions to Undertake Data Quality Initiatives (N = 256)
Other academic management Director of academic computing President/chancellor Academic executive Other IT management Other administrative management Director of administrative computing Administrative executive CIO (or equivalent)
20.3 22.7 25.0 35.2 37.9 42.2 49.6 53.5 82.8 0% 10% 20% 30% 40% 50% 60% 70% 80% 90% Percentage among Institutions with Initiatives Completed, Planned, or in Progress
Figure 4-5. Sponsors of Data Quality Initiatives (N = 256) Figure 4-6. Data Quality Initiatives Resulted in Process Changes (Institutions Completing Initiative in Past 24 Months, N = 117) Strongly disagree, 6.0% Neutral, 20.5% Agree, 58.1% Strongly agree, 10.3% Disagree, 5.1%
possible to distribute this information in role-appropriate ways and facilitate its use within the institution’s decision-making culture. But are institutions really leveraging institutional data and systems in these ways?
We pursued this question by asking respondents about how their institutions approach reporting, modeling, analysis, and decision support—that is, the technologies that provide access to data and the tools that support operational reporting, institutional decision making, and regulatory compliance. For the sake of convenience, we refer to this set of technologies as analytics tools, and the broader capability to collect, analyze, and act on institutional information as analytics.
An ECAR study of academic analytics published in 2005 found institutions relying most often on transactional systems for reporting and analysis, and very few whose primary use of analytics was for such advanced capabilities as predictive modeling or scenario building.7 In the current study, we returned to some of the topics covered in that earlier work to see where the state of analytics practice stands today and how it has or hasn’t changed in the last four years.
Management Information
Climate
One commonly mentioned barrier to the wider adoption of analytics within institu-tions is that leaders are accustomed to an intuitive management style and therefore aren’t really committed to evidence-based
decision making. Another is that institutions lack a commitment to making management information widely available, deferring instead to the turf-protecting restrictions of data owners. We wanted to investigate whether our respondents shared these perceptions and to what extent their agreement about them was associated with other aspects of data management.
On the whole, respondents tended to agree that institutional leadership was committed to evidence-based decision making and that their institutions were committed to making management information widely available. As Table 4-4 shows, their mean agreement on both items was nearly identical and was more than halfway between a neutral (3) and agree (4) response. Responses were closely correlated; level of agreement on one item tended to be similar to that on the other. Majorities agreed or strongly agreed on both items, and fewer than 14% disagreed or strongly disagreed on either.
Our qualitative interviewees recognized that decisions may be driven by many forces other than empirical data, but on the whole they described constituents receptive to, and even hungry for, management information. “You get a certain number of people who seem to say, ‘Sure, show me the data—as long as it doesn’t challenge or mitigate what I already believe,’” acknowledged Samuel Levy, vice president for Information Resources and Technologies and CIO at the University of St. Thomas. “But that said, I’ve seen significant
Table 4-4. Commitment to Evidence-Based Decision Making and to Making Management Information Widely Available
Mean* N Std. Deviation
My institution’s leadership is committed to evidence-based decision
making. 3.58 281 0.957 My institution is committed to making management information
widely available. 3.58 282 0.967
0
decisions based on objective analysis of data in the key business units over the years. I know this because if there’s any disruption in the decision support systems, the users let me know immediately.”
Likewise, interviewees emphasized the important role of executive leadership in setting the tone for a culture of evidence. At Eastern Mennonite University, an upcoming accreditation review led the institution’s provost to press for better ways to empiri-cally demonstrate continuing improvement, an accreditation criterion. The result was an annual institutional effectiveness report process that requires departments to identify data-driven outcomes and measure progress toward them. The university’s Information Systems organization provided technical support to build the reporting application and derive data from multiple internal and external systems, and it has a seat on EMU’s Institutional Effectiveness Committee. “As the departments see the data that’s avail-able and become more data oriented, they move toward more standardized rubrics and test measures where applicable,” said Jack Rutt, director of Information Systems. “It’s becoming an institutional culture, practice, and habit, and there are ways IS can facilitate it, like moving next to dashboard reporting formats.”
Although agreement about leadership and institutional commitment was widespread, we did find some differentiating factors:
Respondents who more strongly agreed that improved data manage-ment was a strategic priority at their institution also tended to agree more strongly with these two items.
Late technology adopters averaged lower agreement on both items than did mainstream and early adopters, suggesting that more aggressive tech-nology adoption may feed these lead-ership and institutional commitments or be in part an expression of them.
u
u
Though we did not find an association between data quality score and either leadership commitment to evidence-based decision making or institutional commitment to making management information widely available, where respondents more strongly agreed that executives understood data quality issues, they tended also to more strongly agree on these two items. We did not find a lot of difference on the basis of demographic factors, but there was some variation by Carnegie class on institu-tional commitment to making management information widely available. Baccalaureate institutions averaged the lowest agreement (mean 3.33), and associate’s institutions aver-aged the highest (mean 4.00); doctoral and master’s institutions were in between.8
There are, of course, many nuances to institutional culture, and our questions may not have captured some that are relevant to the role of analytics in institutional administra-tion. Our questions, for example, asked about commitment rather than realization, and they did not specifically name analytics as a vehicle for achieving either evidence-based decision making or wide availability of management information. However, most of our respon-dents seemed to perceive that leaders are far from indifferent or hostile to an evidentiary approach to decision making and that their institutions are committed to making manage-ment information available.
Analytics Tools: Data Stores
ERP systems optimized to carry out trans-actions fast in real time aren’t well adapted to aggregating that information and making it available for complex, multidimensional reporting and analysis. Institutions that want to go beyond “canned” ERP reports without getting bogged down in programming-inten-sive custom reporting typically find it neces-sary to move transactional data into more analytically oriented data stores. These can
be highly focused or more general in nature, and they may stand independently or feed one another, but as a whole they make up a foundation for a systematic approach to institutional analytics.
Our survey asked about the use of three kinds of data stores, one of them in two different usage contexts:
Operational data stores (ODSs) —data-bases containing information collected from transaction systems, typically from multiple feeds but concentrating on shorter-term data and with rela-tively limited scope. Because ODSs may be used directly for transactional reporting or for staging of data to another data store, our survey asked about both uses.
Data marts—specialized data stores that usually are built with a particular purpose or subject in mind.
u
u
Data warehouses—typically fairly comprehensive data stores with longer-term data tracking and more general-purpose analysis in mind. Besides receiving feeds from ODSs and data marts, data warehouses may integrate historical data from across multiple generations of transaction systems. We asked respondents to describe the status of each data store type (and both uses of ODSs) as part of their institution’s reporting, modeling, analysis, and decision support platform. The statuses respondents chose from were as follows: in use at the institution-wide level; in use at the school, college, or department level (also referred to here as the distributed level); currently in implementation; implementing within 12 months; considering implementing within 24 months; or not considering it.
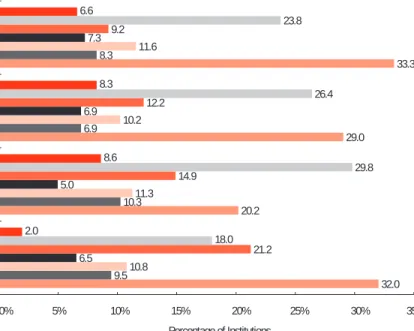
Use of these kinds of data stores was wide-spread but far from universal (see Figure 4-7).
u
Data warehouse (N = 306) Data mart (N = 302) Operational data store for staging to data warehouse/mart (N = 303) Operational data store for transactional reporting (N = 303)
Data Store Type
32.0 20.2 29.0 33.3 9.5 10.3 6.9 8.3 10.8 11.3 10.2 11.6 6.5 5.0 6.9 7.3 21.2 14.9 12.2 9.2 18.0 29.8 26.4 23.8 2.0 8.6 8.3 6.6 0% 5% 10% 15% 20% 25% 30% 35% Percentage of Institutions Don’t know
Not under consideration May implement within 24 months Will implement within 12 months Currently implementing
In use at a school, college, or department (distributed) level In use at an institution-wide level
Figure 4-7. Current and Planned Deployment of Data Warehouses, Marts, and Stores
2
Roughly one-third of institutions reported data warehouses, ODSs for transactional reporting, and ODSs for staging in use at an institu-tion-wide level, and in each of these cases another 7% to 10% reported such use at a distributed (school, college, or departmental) level. Data marts were not as common; about one in five institutions reported them at the institution-wide level, and another 10.3% at a distributed level. These figures may slightly understate usage, since we received relatively high “don’t know” responses, ranging from 6.6% to 8.6%, for all items except data ware-houses (2.0%).
Usage of each type of data store at either the institution-wide or distributed level varied a good deal by Carnegie class. As Figure 4-8 shows, usage levels were highest for all four data store items at doctoral institutions, whereas usage at other Carnegie types was lower and similar across Carnegie types. Incidence was also associated with FTE enroll-ment size; smaller institutions reported lower incidence of each type of data store than larger institutions.
Differences of each data store type’s incidence by Carnegie class and institution size don’t tell the whole story, however,
because there was considerable variance by Carnegie class in the number of items respondents reported on average. Doctoral institutions were the most likely to report all four items (35.6%), and BA institutions were the least likely (7.7%). Overall, only 16.8% of respondents said they had all four items in use, 18.1% reported only one, and 40.5% didn’t report using any of the four.9
Data store infrastructure, then, was fairly modest among our respondent popula-tion, with 6 out of 10 institutions reporting one or none of the items we asked about, and multiple-item users were concentrated disproportionately among doctoral and larger non-doctoral institutions. Presumably, those institutions not using these technologies rely on their transaction systems for reporting, or on shadow applications and databases that didn’t fall into our categories. The absence of these data store infrastructure items may make deep-diving institutional analysis more difficult in many cases, but on the other hand, we did not find any associations between having these items in use and better results in the data management outcomes reported in Chapter 8. 63.8 58.9 60.0 69.5 38.8 31.3 25.0 39.8 31.1 24.1 23.3 24.2 38.5 42.1 25.0 40.0 0% 10% 20% 30% 40% 50% 60% 70% 80% Percentage of Institutions DR MA BA AA ODS transactional
reporting (N = 238) ODS staging (N = 232)
Data Store Type
Data warehouse (N = 254) Data mart (N = 235) Figure 4-8. Incidence of Institution-Wide or Distributed Data Stores, by Carnegie Class*
Active implementation projects and expressed plans to implement suggest potential for usage growth in all these data store types. At the same time, however, a comparison with the results of our 2005 academic analytics survey reveals no signifi-cant differences in usage (up or down) for any of the data store items, despite the fact that many of the 2005 respondents, too, reported implementations planned and in progress. (This comparison was limited to the 112 institutions responding to both the 2005 and 2009 surveys.) For some reason, our respondent institutions don’t seem to be reporting much progress on these elements of data analytics infrastructure.
Analytics Tools: Data
Manipulation, Documentation,
and Reporting
To round out our view of institutional reporting, modeling, analysis, and decision support platforms, we looked at the status of tools used to get data into and out of data stores, maintain data quality, and document data. In addition, we wanted to know about reporting solutions that might be separate from an institutional analytics platform. The items our survey asked about were
metadata servers or data dictionaries for documenting characteristics of data elements;
data cleaning tools that help maintain accuracy and consistency of data; extract, transform, and load (ETL) tools, which permit the harvesting of data from transactional systems (and other databases) and its formatting and transfer between data stores; and vendor-supplied reporting solutions delivered as part of another system— for example, integrated ERP reporting modules.
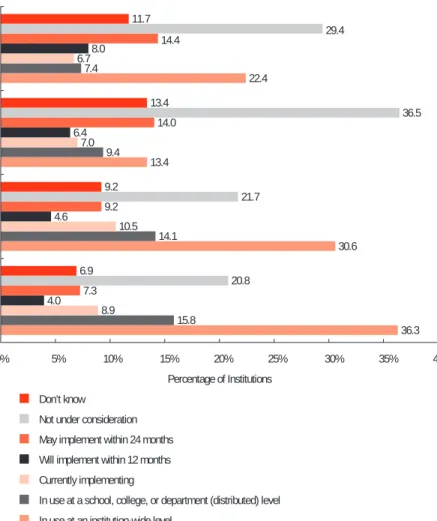
Among these, vendor-supplied reporting solutions were by far the most commonly reported in use, with 36.3% of respondents
u
u
u
u
reporting institution-wide use and another 15.8% reporting use at a distributed level. This made it the only analytics tool we asked about that was reported in use at some level by a majority of respondents. Although native ERP “canned report” tools falling under this heading can be used in the absence of a separate analytics platform, it appears that our respondents also reported vendor-supplied reporting solutions that were used in conjunc-tion with analytics platform elements. For every analytics tool we asked about (i.e., those in Figures 4-8 and 4-9), use was higher among respondents reporting a vendor-supplied reporting solution in use than among those who did not report such use.
Among the other items in Figure 4-9, ETL tools were the most prevalent and data cleaning tools the least. For two of the items, data cleaning tools and metadata servers, data quality scores were slightly higher among respondents reporting the item in institution-wide or distributed use than among those who did not. Some evidence also suggests that metadata servers contribute to enterprise data coherence: Respondents reporting them in institution-wide or distributed use averaged much higher agreement that each major data element had a single definition recognized across the institution (mean 3.63) than did those not reporting such use (mean 3.08).10
Metadata servers, data cleaning tools, and ETL tools were reported in use more often at institutions with higher student FTE enroll-ments than at smaller institutions, but use of the more prevalent vendor-supplied reporting solutions was not significantly associated with FTE enrollment size or with Carnegie class or public/private control.
As with data stores, the status of metadata servers, data cleaning tools, and ETL tools did not differ significantly between 2005 and 2009 among the 112 institutions that answered both academic analytics surveys. Once again, however, vendor-supplied reporting solu-tions were the exception: They were the
only analytics tool item we asked about that showed a significant status change over the four-year period. Institution-wide use increased from 30.5% in 2005 to 44.2% in 2009, and distributed use grew even more, from 5.3% to 20.2%, while the proportion of those saying they were not considering the item declined from 24.2% to 15.4%. Although our survey questions may have missed some elements of investment, our respondents apparently are choosing to deploy or upgrade commercial reporting solutions more often than the other analytics platform elements we asked about.
Analytics Use and Users
Our survey questions about how institu-tions use analytics were based on the notion that such use might follow a hierarchy from
more basic to more sophisticated uses. To learn how far our respondent institutions may have progressed along these lines, we asked them to describe the primary use of reporting, modeling, analysis, and decision support tools at their institutions, using one of five stages:
Stage 1: extraction and analysis of transaction-level data,
Stage 2: analysis and monitoring of operational performance (e.g., via dashboards),
Stage 3: what-if decision support (e.g., scenario building),
Stage 4: predictive modeling and situ-ations, and
Stage 5: use of information to auto-matically trigger a business process
u u u u u Tool Vendor-supplied reporting solution (N = 303) Extract, transform, and load tool (N = 304) Data cleaning tool (N = 299) Metadata server/data dictionary (N = 299) 36.3 30.6 13.4 22.4 15.8 14.1 9.4 7.4 8.9 10.5 7.0 6.7 4.0 4.6 6.4 8.0 7.3 9.2 14.0 14.4 20.8 21.7 36.5 29.4 6.9 9.2 13.4 11.7 0% 5% 10% 15% 20% 25% 30% 35% 40% Percentage of Institutions Don’t know
Not under consideration May implement within 24 months Will implement within 12 months Currently implementing
In use at a school, college, or department (distributed) level In use at an institution-wide level
Figure 4-9. Current and Planned Deployment of Data Manipulation, Documentation, and Reporting Tools
(e.g., automatically scheduling an adviser appointment with an at-risk student).
In addition, respondents could indicate that their institution was not an active user of reporting, modeling, analysis, and decision support.
We found primary use of analytics reported mainly in the two “earliest” of these stages, extraction and analysis of transaction-level data, and analysis and monitoring of opera-tional performance (see Figure 4-10). Almost 6 in 10 reported the former, and about 2 in 10 reported the latter; if we add to them the 9.5% who said their institution was not an active user, this leaves only 12.5% across all three of the most advanced stages.
We found a similar concentration in the first two stages in our 2005 academic analytics study, and indeed there was no statistically significant difference between the 2005 and 2009 results among the 112 insti-tutions that answered both surveys. Finding the relatively simpler stages of use to be the dominant ones is not surprising; after all, these
are the foundation for more sophisticated stages, and our question’s focus on primary
use may, as we note below, be obscuring more sophisticated use of analytics for particular purposes or in certain departments. At North Carolina State, for example, Marc Hoit noted that the analytics needs and capabilities of departments vary widely. “Some depart-ments, like education and engineering, have much stronger accreditation requirements than others and have done much more with data,” he reported. “The financial people are generating all kinds of scenarios on budget cuts. About 80% of users just want their standard reports; another 10% to 15% do a little more refined analysis but aren’t complex statistically; and then there are the 5% to 10% that really dig in.”
Though this may well be a common scenario, we find it noteworthy that no trend toward an institutional use of analytics primarily devoted to higher-order and more strategic management activities—to pursuing scenarios, modeling or predicting outcomes, or integrating information dynamically with
0% 10% 20% 30% 40% 50% 60% 70% 80% 58.4 Stage 1: Extraction and reporting of transaction-level data 19.7
Stage 2: Analysis and monitoring of operational performance 4.6 Stage 3: What-if decision support 1.3 Stage 4: Predictive modeling and simulations 6.6 Stage 5: Automatically trigger a business process 9.5
Not active users
Primary Use Percentage of Institution s Figure 4-10. Primary Use of Analytics (N = 305)
business processes—is evident in our results. In its primary uses, analytics seems to remain grounded in transactional and operational performance monitoring.
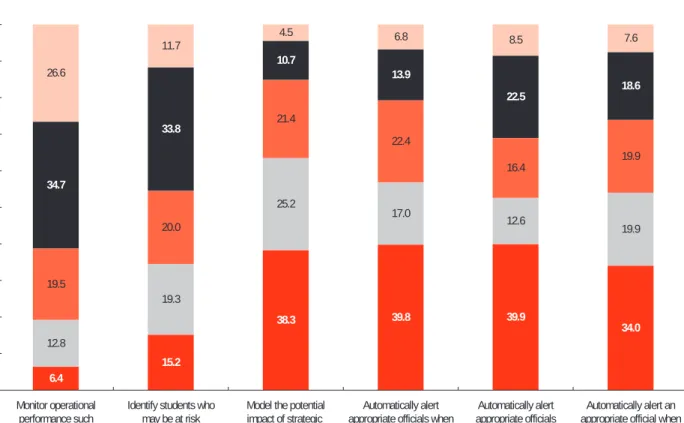
A closer look at certain specific advanced uses of analytics shows, however, that some degree of use of advanced analytics is widespread. Majorities reported at least occasionally employing all of the six advanced analytics use cases that we asked about (see Figure 4-11).
Still, much of the use seems infre-quent, and most of the uses mentioned were “almost never” used by substantial minorities. Monitoring performance by, for example, comparing budget to actual data (a
0% 10% 20% 30% 40% 50% 60% 70% 80% 90% 100% 6.4 12.8 19.5 34.7 26.6 Monitor operational performance such as budget to actual data (N = 297) 15.2 19.3 20.0 33.8 11.7
Identify students who may be at risk academically (N = 290) 38.3 25.2 21.4 10.7 4.5
Model the potential impact of strategic decisions (N = 290) 39.8 17.0 22.4 13.9 6.8 Automatically alert appropriate officials when
a financial indicator falls outside a desired range (N = 294) 39.9 12.6 16.4 22.5 8.5 Automatically alert appropriate officials when an enrollment metric falls outside a desired range (N = 293) 34.0 19.9 19.9 18.6 7.6 Automatically alert an appropriate official when an academic intervention with a student is warranted (N = 291) Percentage of Institutions Almost always Usually Sometimes Occasionally Almost never
Figure 4-11. Selected Uses of Advanced Analytics
stage 2 use) was by far most often reported in use: Only 6.4% of respondents said their institutions almost never make use of it. The two predictive modeling (stage 4) uses produced mixed results: Identifying students at risk was the second most common use, with 15.2% reporting almost never doing so, but modeling the potential impact of strategic decisions was much less common, with 38.3% almost never doing it. The auto-trigger (stage 5) uses we asked about were also less common, with between 34.0% and 39.9% reporting almost never using them. Means of responses on our 5-point scale (which ranged from 1 = almost never to 5 = almost always) reflected these differences:
Views from the Qualitative Research: Toward a Data-Driven
Culture
Qualitative interviewees chosen for the high marks they gave their institutions’ ability to get maximum business value from data tended to describe an evolutionary pattern that began with an institutional commitment to management metrics rooted in reliable and accessible data, which cleared the way for enhanced analytics capabilities and cultural change.
University of St. Thomas
An ERP implementation with a shared centralized database set the stage. “‘Free the captive data’ was the catchphrase during the implementation,” said CIO Samuel Levy. “We divested the institution of the cultural artifact of a small number of people controlling access to data and analysis.” The university instituted a “shared data owners” group to work out data ownership and standardization decisions, and when it added an operational data store, a data warehouse, and analytics tools, it also provided IT staff to assist users with analytics. “As you can imagine, at a university you have some folks who are very good at that kind of thing and others, perhaps in the smaller units, who need help,” Levy added. “The larger departments tend to push the data further, asking more questions, and thereby developing more expertise.” As the institution’s analytics capability improved, it began to be integrated more deeply into administration. “The data have all been tied to institutional budgeting and planning processes, and the goals of the president, vice presidents, and on down are increasingly stated in empirical terms,” Levy noted. “Here, you don’t go question-begging into meetings—you walk in with the numbers. It’s no longer valid to make excuses about the data not being available or accurate.”
University of North Texas Health Science Center
The university’s health science center once had an “old school academic atmosphere,” reported Renee Drabier, vice president for Information Resources and Technology and CIO at UNTHSC. New presidential leadership and the senior executive team instituted a requirement that departments develop outcome measures, align with institu-tional goals, and report on their success. To “close the assessment loop,” Drabier said, the institution adopted an assessment management system oriented toward performance improvement and accreditation standards. “You put in your department goals aligned with institutional goals and tactical initiatives, document how you’re going to measure them, when you’re going to achieve them, and write in outcomes and lessons learned and how you’ll proceed from there with updated proceses and measures.” This in turn has fed UNTHSC’s investment in executive dashboards. The campus developed web-based dashboards driven by extracted ERP data, which has led to consistent defi nitions for key data elements across UNT campuses. “The items we monitor right now extend down to the VP, dean, and college level,” Drabier said. “The use of analytics continues to be expanded to reach into all departments so that each has its own dashboards that align with university goals and reporting needs.”
University of Central Missouri
Describing the data-based decision-making culture at the university as “strong,” CIO Russell Helm noted that the university’s original decision to implement an integrated ERP suite and subsequent analytics enhancements arose from leadership demands for better data. “We relied on them to take the lead,” Helm said. The chief champions of the project were the provost and chief fi nancial offi cer, who “sold the project to the cabinet, the board of governors, and the campus. They orchestrated the requirement that when the Banner system went in, Banner data would be the institution’s offi cial data, period. They wanted sound data.” The university has subsequently added a data warehouse and a number of data marts. The institutional research division, which reports to the provost, has had the main responsibility for managing time-series information available from the data warehouse. But thanks to new high-level key performance indicators being developed by the president and board, Helm said, “I wouldn’t be surprised if there were a push for analytical tools at the staff and managerial level to make the data easier to use at all levels of the institution.”
The monitoring operational performance responses averaged 3.62, more than halfway between “sometimes” and “usually,” and identifying students at risk averaged 3.08 (“sometimes”);11 the strategic decision impact modeling and auto-trigger item means were all below 2.50.
We did not find any significant differences in advanced analytics use by demographic factors such as Carnegie class, FTE enroll-ment size, or public/private control, though we did find that the auto-trigger items were on average more frequently used by institu-tions reporting higher data quality scores. This makes sense, since presumably institutions would be reluctant to implement automatic alerts to officials unless they felt confident about the data that fed the process. In addi-tion, where respondents agreed more strongly that institutional leadership was committed to evidence-based decision making, they tended to report more frequent use of operational performance monitoring, automatic alerts regarding financial indicators, and modeling the impact of strategic decisions.
Perhaps our most important finding relating to these advanced analytics use items was that for every one of them, more frequent mean use was associated with higher respondent agreement about getting maximum business and academic value from institutional data. We report the results relating to these key data management performance outcomes in detail in Chapter 8. Given this association, we were surprised to find no significant increase in the frequency of use of any of these items among the insti-tutions that responded to both the 2005 and 2009 surveys.
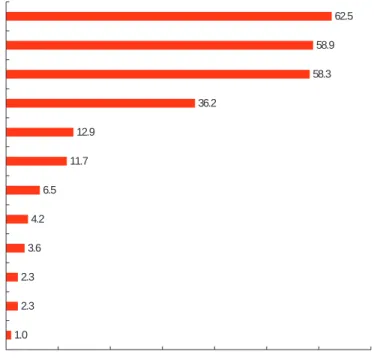
There was a similar continuity in respon-dents’ reports about who uses reporting, modeling, analysis, and decision support tools. Respondents choosing up to three “most active” users from a list of 12 user enti-ties most often selected institutional research, central admissions/enrollment management staff, and central business/finance adminis-trative staff (see Figure 4-12). Despite some apparent differences in rank order caused by percentage differences too small to be
1.0 2.3 2.3 3.6 4.2 6.5 11.7 12.9 36.2 58.3 58.9 62.5 0% 10% 20% 30% 40% 50% 60% 70% School-based fundraising staff
School-based admissions School-based grants management Central research administration/grants management Department chairs and chairs' staff Central human resources Deans and deans' staff Central fundraising/advancement Central academic/student services Central business/finance/administrative Central admissions/enrollment management Institutional research
Percentage of Institutions
Figure 4-12. Most Active Users of Analytics (N = 309)
meaningful, these results were very similar to those reported in the 2005 analytics study, and among institutions responding in both 2005 and 2009, we found no statistically significant changes in the activity of the various user entities.
Just the same, we did find some variation, particularly relating to the role of fundraising/ advancement staff and institutional research. Private institutions were far more likely to identify central fundraising/advancement as a most active user (27.0%) than were public institutions (3.5%), presumably reflecting their relatively greater dependence on endowments for operating revenues. As for institutional research (IR), it was most frequently reported as a most active user at associate’s institutions (80.4%) and least often at BA institutions (49.2%), possibly reflecting less prevalence of IR units, or simpler IR analytical needs, among liberal arts colleges.
Analytics Training
Respondents were far from enthusiastic about the analytics training provided by their
institutions. Asked their level of agreement that their institution provides effective training to users of reporting, modeling, analysis, and decision support tools, they averaged a 2.77 response, below neutral (3) on our 5-point agreement scale.12 Only about one in four agreed or strongly agreed (see Figure 4-13). This was consistent with previous findings; there was no significant difference in agree-ment about training effectiveness between our 2005 and 2009 surveys among the 112 institutions that answered both.
This is an unfortunate situation, since as we report in detail in Chapter 8, among all study variables, effective training in analytics had some of the strongest associations we found with good data management outcomes, and we found particularly strong relation-ships between training and agreement that the institution gets maximum business and academic value from institutional data. For the most part, training had a stronger relationship with positive outcomes than did deployment of analytics platform items or use of advanced analytics techniques. 0% 5% 10% 15% 20% 25% 30% 35% 40% 45% 50% Percentage of Institutions 10.0 Strongly disagree 30.8 Disagree 34.4 Neutral 21.1 Agree 3.6 Strongly agree Figure 4-13. Institution Provides Effective Training to Users of Analytics Tools (N = 279)
0
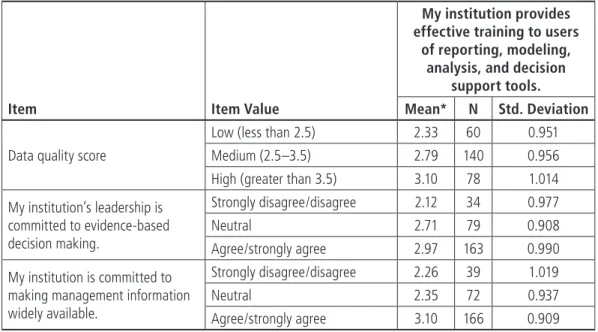
So what distinguishes institutions that report stronger agreement about this evidently influential variable? Our results can’t demonstrate causality or the direction of any connection that exists, but several factors we’ve already mentioned in this chapter do tend to be seen alongside greater agreement about training effectiveness. As Table 4-5 shows, institutions perceiving better data quality (as reflected in data quality scores), those seen as committed to evidence-based decision making, and those seen as committed to making management information widely available also tend to report higher analytics training effective-ness. We suspect that such factors are all components of a general cultural disposition in favor of making effective use of analytics, which in turn drives funding, availability, interest in, and expectations of pursuing analytics training.
Analytics Upgrade Plans
Hope, they say, springs eternal, and if we found little evidence that institutions have
significantly enhanced their analytics infra-structure or use since 2005, our respondents nonetheless tended to report intentions to improve their capabilities. One item in evidence is the substantial percentages of respondents saying they will, or may, deploy the assorted analytics platform items shown in Figures 4-7 and 4-9. Another, more direct, indicator was a solid majority of respondents who agreed or strongly agreed that their institutions planned to significantly upgrade their reporting, modeling, analysis, and decision support capability in the next two years (see Figure 4-14).
Averaging a 3.52 response (midway between neutral and agree), the responses to this statement were remarkably diffuse. We found no associations between agree-ment about upgrading analytics and any demographic variables such as Carnegie class, FTE enrollment size, research mission, or public/private control, nor, more surpris-ingly, any relationship between perceived demands for improved data management capabilities from leadership or users. Neither did we find institutions with lower data
Table 4-5. Training Effectiveness, by Data Quality Score, Commitment to Evidence-Based Decision Making, and Commitment to Availability of Management Information
Item Item Value
My institution provides effective training to users
of reporting, modeling, analysis, and decision
support tools.
Mean* N Std. Deviation
Data quality score
Low (less than 2.5) 2.33 60 0.951 Medium (2.5–3.5) 2.79 140 0.956 High (greater than 3.5) 3.10 78 1.014 My institution’s leadership is committed to evidence-based decision making. Strongly disagree/disagree 2.12 34 0.977 Neutral 2.71 79 0.908 Agree/strongly agree 2.97 163 0.990 My institution is committed to
making management information widely available.
Strongly disagree/disagree 2.26 39 1.019 Neutral 2.35 72 0.937 Agree/strongly agree 3.10 166 0.909
quality scores, or those reporting lower agreement about getting maximum business or academic value from institutional data, significantly higher or lower in agreement about upgrading.
Accounting for the absence of a relation-ship is difficult. But given that expectations of analytics platform improvement among our 2005 respondents were not (except for vendor-supplied reporting solutions) clearly realized among the same respondents in 2009, and also given our inability to find a link between upgrade agreement and logical indicators of a need to improve, we are led to speculate that these expectations of analytics improvement derive more from optimism and a general hope for progress than from concrete plans.
Data Quality and
Analytics: How Can We
Do Better?
Assembling a timely, complete picture of how the institution is functioning and where
it’s headed, and using that information to manage and lead, has been something of a Holy Grail for higher education over the years. Yet this vision continues to be surprisingly difficult to realize. Many of our respondent institutions seem to be relying on their ERP systems for their business reporting needs despite the fact that online transactional systems aren’t well architected to support deep dives into data. Our respondents also seem distinctly unenthusiastic about most facets of enterprise data quality, averaging only a 3 response on a scale of 1 to 5 across eight different data-quality-related items. We found rather modest infrastructure beyond ERP for data analytics and little change in the analytics infrastructure landscape between our 2005 and 2009 surveys.
Why such unprepossessing results so many years into the Information Age? Though we didn’t ask respondents directly about obstacles to better data quality and more robust analytics, we found some sugges-tive clues. As we reported in Chapter 3,
Figure 4-14. Institution Plans to Upgrade Analytics Capability in Next Two Years (N = 280) 0% 5% 10% 15% 20% 25% 30% 35% 40% 45% 7.5 Percentage of Institution s 19.6 38.6 23.6 10.7
2
the most commonly reported barrier to investing in data management was lack of funds, whereas the top drivers for invest-ment were improving data security and regulatory compliance. Improving opera-tional efficiency and enhancing data-driven decision making—items that rely heavily on data quality and analytics—were distinctly secondary drivers. It may be that an under-standable concern for data security is taking resource precedence over other kinds of improvements to the data environment.
A second possible explanation is that insti-tutions see their transactional ERP systems as “good enough” platforms for maintaining data quality and serving basic reporting needs. Among the eight detailed data-quality-related items we asked about, those that elicited the strongest mean agreement—that each major data element has an identified system of record and a single definition recognized across the institution—were the ones most likely to be improved by the existence of an integrated ERP system with a shared database. The data quality items that fared worst, such as value changes propagating across non-enterprise systems and processes for documenting and reviewing data quality issues, were those that depended most on cross-system integration and cross-depart-ment coordination and feedback.
Likewise, extraction and reporting of transaction-level data was by far the most common primary use cited for analytics tools, and 4 in 10 institutions reported no use of the data store types we asked about, presum-ably relying instead on their ERP transaction systems. Although ERP systems demand a certain amount of interdepartmental communication and cooperation, especially in their deployment phase, we speculate that this kind of interaction is focused mainly on transaction workflows. Institutions may find it difficult to adapt these to the feedback loops, big-picture perspectives, and sophisticated techniques involved in both systemic data
quality improvement and model- or scenario-oriented analytics.
It’s possible as well that mediocre data quality and unambitious analytics are mutu-ally reinforcing circumstances. In principle, it seems reasonable that the more data that is fed into advanced analysis for high-stakes decision making, the more likely the data will be scrutinized and improved; contrarily, unreli-able data makes aggressive analysis difficult or pointless. Our empirical evidence for this is spotty, however. Institutions with higher data quality scores tended to report more frequent mean use of advanced auto-trigger analytics techniques, but the same relationship did not hold up for other techniques. Data quality scores were also associated only with usage of a few analytics tools.
One might also speculate that cultural issues, so often described as more important than tools or resources, are somehow under-mining data quality and analytics develop-ment. We did find that institutions reporting stronger agreement about leadership commit-ment to evidence-based decision making were more likely to be early technology adopters and averaged more frequent use of a few advanced analytics techniques. But most respondents did agree that their institution’s leadership had such a commitment, and as we reported in Chapter 3, even more agreed that improved data management was a strategic priority. These findings hardly scratch the surface of possible cultural dimensions, of course, and the signs of inadequate interde-partmental coordination that we noted above could be considered a cultural issue deeper down in the organization.
What is clear, however, is that both data quality and use of advanced analytics are strongly related to our study’s most promi-nent data management outcomes, getting maximum business and academic value from institutional data. These factors, in turn, are positively associated with things that institu-tional administrators can do something about:
providing data quality and analytics training, pursuing an active partnership between IT and business units, and undertaking data quality improvement initiatives. For institutions with lots of problems to solve and not a lot of resources to bring to bear, these would be good places to start looking for improvements in institutional data management.
Endnotes
1. The issues we cover in this section include reference and master data management as well as data quality management. For convenience, we refer to the whole range of issues under the term data quality. See Mark Mosley, “DAMA-DMBOK Functional Framework Version 3.02,” DAMA International (2008), 11, http://www.dama.org/i4a/pages/Index .cfm?pageID=3548.
2. Cronbach’s alpha for the eight items included in the score was 0.881.
3. Ronald Yanosky, with Gail Salaway, Identity Management in Higher Education: A Baseline Study
(Research Study, Vol. 2) (Boulder, CO: EDUCAUSE Center for Applied Research, 2006), see especially 89–92, available from http://www.educause.edu /ECAR/IdentityManagementinHigherEduc/158591. 4. N = 85, SD = 1.090, and N = 164, SD = 0.621,
respec-tively, for these groups. 5. N = 309, SD = 0.863.
6. N = 117, SD = 0.955. Because of the skewed distri-bution of these responses, the median is the more reliable summary measure.
7. Philip J. Goldstein, with Richard N. Katz, Academic Analytics: The Uses of Management Information and Technology in Higher Education (Research Study, Vol. 8) (Boulder, CO: EDUCAUSE Center for Applied Research, 2005), available from http://www.educause .edu /ECAR /AcademicAnalyticsTheUsesofMana /158588.
8. SD = 0.998 and 0.913, respectively.
9. The results in this paragraph and in Figure 4-8 exclude respondents who answered “don’t know.” 10. SD = 1.049 and 1.140, respectively. 11. SD = 1.188 and 1.268, respectively. 12. SD = 1.009.