MODELING THE VOC EMISSIONS OF SOLID/WET BUILDING
MATERIAL ASSEMBLY AND ITS ASSESSMENT
C-S Lee1*, F Haghighat1 and W Ghaly2
1Department of Building, Civil, and Environmental Engineering
2Department of Mechanical and Industrial Engineering, Concordia University, Montreal,
Canada
ABSTRACT
This paper presents the theoretical investigation of the VOC emissions from the solid/wet material assembly. A mass transfer model was developed considering the diffusion and sorption within the solid, and the convection (i.e., airflow) over the solid material. The wet material was modeled as an emission source with a constant decay rate and a negligible thickness. The analytical solution was obtained using the integral transform technique. This proposed model was assessed by comparing its prediction to small-scaled chamber test data of carpet/adhesive assembly in the literature. The effect of air velocity (i.e., Reynolds number) on the emission of the assembly was studied. The emission rate increases as the air velocity increases; however, the effect of air velocity depends on the solid material properties.
INDEX TERMS
Volatile organic compounds (VOCs), material emission, mass transfer, sorption, air velocity
INTRODUCTION
Volatile organic compounds (VOCs) are the major indoor air pollutants emitted from building materials and furnishings. Many previous researches focused on characterizing VOC
emissions from various individual building materials. The VOC emissions from a building material assembly, however, are not the simple sum of each constituent individual building material due to the interaction between the materials. Solid materials may act as a VOC transfer barrier as well as an adsorbent, and the wet material emissions are sensitive to its surroundings.
One of the simplest forms of assemblies is solid/wet material assembly. Previous
experimental studies (Black et al., 1991 and 1993, Nagda et al., 1993, and Low et al., 1998) on solid/wet material assembly, specifically carpet/adhesive and tile/adhesive, concluded that 1) the wet material is the primary VOC emitter in the assembly: 2) the emission profile of the assembly shows the delayed and lower peak emission rates, and the slower decay compared with that of the wet material alone. Low et al. (1998) also experimentally showed that air velocity and turbulence can affect the emissions from carpet/adhesive system.
This paper presents a mass transfer model for VOC emissions from solid/wet material assembly. The model was applied to experimental study in the literature (Low et al., 1998) and its prediction was compared with the test data. This paper also presents the parametric study results on the effect of air velocity, expressed as Reynolds number, for various cases of the diffusion coefficient and the sorption property of the solid.
MODELLING VOC EMISSIONS FROM SOLID/WET MATERIAL ASSEMBLY
The model describes the emission processes as 1) the wet material placed under a solid of length l, and the thickness b, is an emission source with constant decay rate and negligible thickness,described by the first order decay model, which is the simplest one for thin wet mateiral emissions and used in analyzing many previous emission test data; 2) the emission rate is continuous at the solid-wet material interface; 3) VOCs are transferred by
one-dimensional diffusion with sorption within the solid, which has constant diffusion coefficient (Ds), sorption property (k), porosity (ε) and initial voc concentration (Co); and 4) convection takes place in the air overlaying the solid surface(y=0) due to laminar or turbulent air flow over the solid, and the ambient air has a uniform voc concentration (C∞). There is no mass transfer along the edges of the material (at x=0 and x=l). A macroporous solid material is considered in this model. In macroporous material, gas-phase diffusion (i.e., molecular and knudsen diffusion) is generally much faster and more significant than adsorbed-phase diffusion (i.e., surface diffusion); hence, the surface diffusion is not considered. It is also assumed that the voc diffusion through the solid is negligible compared with that through the pores.
The governing equation of the time-dependent one-dimensional diffusion within the solid including adsorption is 2 2 y C D t C t C s ad ∂ ∂ ⋅ = ∂ ∂ + ∂ ∂ ⋅ ε for –b≤ y≤ o (1)
where, C is the gas-phase VOC concentration [mg of gas-phase VOC/m3 of air], ε is the porosity of the solid material [m3 of air/m3 of material], t is the time [s], Cad is the adsorbed-phase concentration [mg of adsorbed-adsorbed-phase VOC/m3 of material], and Ds is the effective diffusion coefficient of the solid [m2/s]. Assuming low VOC concentration levels, Henry isotherm was used to describe the relationship between the air-phase concentration in the pores and the adsorbed-phase concentration on the pore walls.
Cad =K⋅C (2)
where, K is the partition coefficient. Substituting this into Eq.(1), the governing equation for mass diffusion in the solid becomes,
2 2 ) ( y C D t C K s ∂ ∂ ⋅ = ∂ ∂ + ε (3)
At the upper surface of the solid (y=0), mass diffusion in the solid balances the forced convection in the air. The boundary condition there, at y=0, is of the third-kind and can be written as:
(
− ∞)
⋅ = ∂ ∂ ⋅ − h C C y C Ds D (4)where, hD is the convection mass transfer coefficient (MTC) [m/s], and C∞is the ambient VOC concentration outside the boundary layer [mg/m3]. MTC hD can be obtained from Sherwood number relations, given later in Eq. (10) and (11). The wet material is placed under the solid (at y=-b). The emission rate of the solid at the lower surface will be equal to the emission rate of the wet material, so that:
t k s R e y C D = ⋅ − ⋅ ∂ ∂ ⋅ − 0 (5)
where, R0 is the initial emission rate of the wet material [mg/m2/s], and k is the decay constant of the wet material [s-1]. In this model, the wet material thickness is neglected hence the diffusion within the wet material is not considered. The initial condition (at t =0) is
0
C
C = for –b≤y≤ 0 (6)
where, C0 is the uniform initial VOC concentration of the solid [mg/m3].
The governing equation for C(y,t), Eq. (3), together with the boundary conditions given in Eqs. (4) and (5) and the initial condition given in Eq. (6), is of the so-called heat diffusion type (parabolic in time and elliptic in space) and can be solved analytically using the integral transform method (Özisik, 1980). The VOC concentration C(y,t) is given as
( )
(
)
{
(
)
}
(
)
(
)
(
)
(
)
− ⋅ ⋅ + − ⋅ + ⋅ − + ⋅ ⋅ ⋅ + ⋅ + + ⋅ + = − ∞ − ⋅ − − ∞ =∑
t D m s m D t D t k m t D m m m m m m m m m e D b C h e e K k D R e b C b y H H b H t y C 2 2 2 1 cos ) ( sin cos 2 , 2 2 0 0 1 2 2 2 2 β β β β β ε β β β β β β (7)where, D = Ds/(ε+K), H=hD/Ds, and βm are the eigenvalues, which are the positive roots of the following equation
β⋅tan
(
β⋅b)
=H (8) The emission rate from the assembly can be obtained by the following relation using Eq. (7).R(0,t)=hD⋅
[
C(y=0,t)−C∞]
(9) Equations (7)-(9) give C(y,t) and R(0,t) once the material properties, convection properties,and initial and boundary conditions are given.
ASSESSMENT OF THE PROPOSED MODEL
The model proposed in this paper was assessed by comparing its results with the experimental data available in literature (Low et al., 1998). They compared the TVOC emission rates from the carpet/adhesive assembly, the adhesive-only and the carpet-only. The three tests were conducted in the same experimental conditions. Since all the input parameters required in the proposed model were not given, the following explains how these were obtained.
The air velocity 0.04m above the carpet, where is the outside of the momentum boundary layer, was 0.15m/s. Since the chamber has 0.15m without material specimen from the leading edge and the air velocity and the characteristic length (L=0.25m) is small, MTC (hD= 8.07×10
-4 m/s) was obtained by averaging the results calculated from the following laminar Sherwood
3 1 4 3 3 1 2 1 0.15 1 Re 332 . 0 − − ⋅ ⋅ ⋅ = x Sc Shx x (10)
where, Shx is the Sherwood number (Shx=hD⋅x/Da), Rex is the Reynolds number (Rex=u∞⋅x/ν),
Sc is the Schmidt number (Sc=ν/Da), Da is the diffusion coefficient of VOC-air in the air [m2/s], x is the distance from the leading edge [m], u∞ is the air velocity outside the boundary layer [m/s], and ν is air the kinematic viscosity [m2/s]. Since no carpet property was reported, the diffusion coefficient (Ds=3.49×10⁻⁷m2/s) of carpet for major VOCs (e.g., nonane and decane) was estimated using Ds value of carpet for n-octane experimentally obtained by Meininghaus et al. (1998) assuming Da to Ds ratio is constant. The thickness of carpet (b=8.5mm) was taken from the same literature. Because (ε+K) value is not available in the literature, the best-fit value was used (ε+K =135). The test data shows that TVOC emission rate of carpet-alone is negligible; hence, the initial concentration (C0) was assumed as zero. The properties of adhesive (R0 and k) were obtained form the emission test data of adhesive-alone. The emission from a wet material is sensitive to its environment. In the test, the
adhesive was directly exposed to air with the same velocity, whilst the first order decay model used in the model is to describe the emission rate of the adhesive under a carpet, which will be lower than the test data. To accommodate this, the first 5-hour emission test data was not used in curve-fitting R0 and k (R0=0.168mg/m2s and k=7.25×10⁻⁶s-1 with R2=0.954: see Fig.1 (a)).
(b) Carpet/Adhesive 0 0.03 0.06 0.09 0.12 0.15 0 48 96 144 time (hr) em is si o n r at e ( m g /m 2s) prediction experiment (Low et al., 1998) (a) Adhesive 0 0.1 0.2 0.3 0.4 0.5 0 48 96 144 time (hr) em is si o n r a te ( m g /m 2 s)
prediction: with carpet (first order decay)
experiment: without carpet (Low et al., 1998)
Figure 1. Assessment of the proposed model
The prediction of the proposed model was compared with the experimental data in Fig. 1(b) and it shows excellent agreement. The peak emission rate has less than 5% of error. This proves that the proposed model can be possibly applied to the emission from solid/wet
material assembly; however, the model is required to be validated further in conditions where all input parameters are clear. Also, how to obtain the wet material parameters has to be investigated further through many experiments. Low’s test data on the effect of air velocity and turbulence cannot be used because different kinds of carpet and adhesive were used and emission tests of individual materials were not carried out. Instead, a parametric study on the effect of air velocity was carried out and presented in the following section.
PARAMETRIC STUDY: EFFECT OF REYNOLDS NUMBER
In the proposed model, air velocity is implicitly expressed through the convection MTC (hD), which has nonlinear effect on material emissions according to the analytical solution. The
effect of air velocity expressed as Reynolds number was investigated. The initial and the ambient VOC concentrations (C0 and C∞) were set as zero. N-octane at 25°C was used and hD was estimated from Sherwood number relation for laminar forced convection with material length L=4.5m. 3 1 2 1 Re 664 . 0 Sc ShL = ⋅ L⋅ (11)
The thickness of solid (b) and the wet material properties are the same with those in previous section. Since the previous study (Lee et al., 2000) showed that the impact of air velocity on material emission is affected by diffusion coefficient of solid (Ds), two cases of Ds were considered (e.g., Da/Ds=10 and 1000). A review on diffusion coefficient showed that Da/Ds of
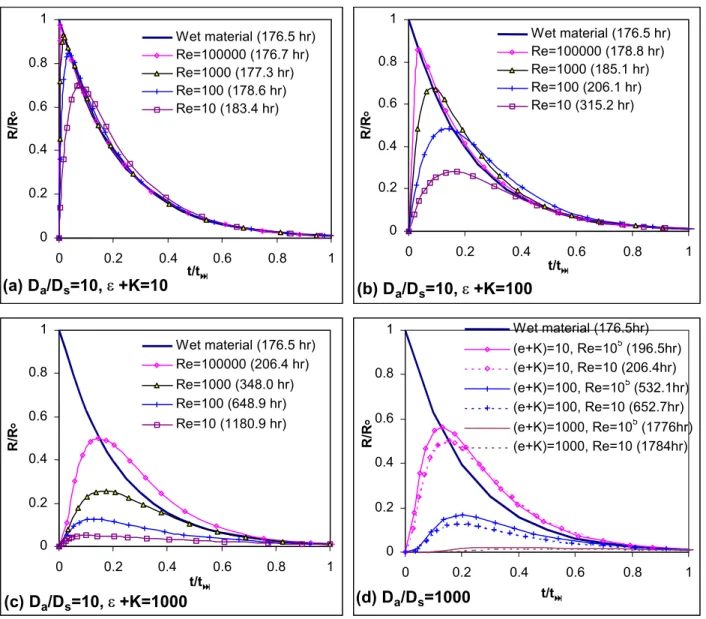
Figure 2. Effect of Reynolds number
(a) Da/Ds=10, ε+K=10 0 0.2 0.4 0.6 0.8 1 0 0.2 0.4 0.6 0.8 1 t/t R/R o Wet material (176.5 hr) Re=100000 (176.7 hr) Re=1000 (177.3 hr) Re=100 (178.6 hr) Re=10 (183.4 hr) 0 0.2 0.4 0.6 0.8 1 0 0.2 0.4 0.6 0.8 1 t/t R/R o Wet material (176.5 hr) Re=100000 (178.8 hr) Re=1000 (185.1 hr) Re=100 (206.1 hr) Re=10 (315.2 hr) (b) Da/Ds=10, ε+K=100 0 0.2 0.4 0.6 0.8 1 0 0.2 0.4 0.6 0.8 1 t/t R/R o Wet material (176.5 hr) Re=100000 (206.4 hr) Re=1000 (348.0 hr) Re=100 (648.9 hr) Re=10 (1180.9 hr) (c) Da/Ds=10, ε+K=1000 (d) Da/Ds=1000 0 0.2 0.4 0.6 0.8 1 0 0.2 0.4 0.6 0.8 1 t/t R/R o Wet material (176.5hr) (e+K)=10, Re=105 (196.5hr) (e+K)=10, Re=10 (206.4hr) (e+K)=100, Re=105 (532.1hr) (e+K)=100, Re=10 (652.7hr) (e+K)=1000, Re=105 (1776hr) (e+K)=1000, Re=10 (1784hr)
VOCs for a variety of building materials are in range from 4.4 to 3000 (Haghighat et al., 2002). (ε+K) value was also varied as 10, 100, and 1000. The Reynolds number was varied from 10 to 105 (i.e., air velocity from almost stagnant to 0.34m/s).
Figure 2 shows that the effect of Reynolds number on the emissions from solid/wet material assembly. The results are presented as emission rate normalized by the initial emission rate of wet material (R0) versus the time normalized by the time required for the emission rate from assembly to reach 1% of R0 (t∞). t∞ values are presented in the bracket in the legends. The
results show that the emission rate from the assembly increases as Reynolds number increases. This agrees with the experimental results of Low et al. (1998). The effect of
Reynolds number is more significant when the diffusional resistance of the solid is lower. One interesting result is that when Da/Ds=10, increasing (ε+K) value will decrease the emission rate but not the effect of Reynolds number. For the case of (ε+K) = 10, 100 and 1000, the peak emission rate varies from 0.702 to 0.974 with standard deviation (σ2) of 0.119, from 0.281 to 0.854 with σ2 of 0.246, and from 0.051 to 0.500 σ2 of 0.197, respectively. Maximum variation was found when (ε+K) = 100. When Da/Ds=1000, there are little effect of Reynolds number, regardless of (ε+K) value (Fig.2 (d)).
CONCLUSION
An analytical model for VOC emissions from the solid/wet material assembly was developed including convection over the solid material, diffusion as well as adsorption within the solid, and the first order decay profile as the wet material emission. This analytical model can provide not only the exact solution but also a means to test the validity of numerical models. The proposed model was assessed using the small-scale chamber test data of carpet/adhesive emission. Overall, its prediction agreed well with the experimental data. Still, the model needs further validation with detailed experimental data. Given the exact solution, a parametric study showed how the air velocity (i.e., Reynolds number) affects the VOC emissions from the solid/wet material assembly. The effect of the air velocity depends on the solid material properties like diffusion coefficient (Ds), porosity (ε), and sorption property (K). Larger effect of air velocity was observed at smaller diffusional resistance of solid. The effect of air
velocity shows nonlinear behaviour with (ε+K) changes.
ACKNOWLEDGEMENT
The authors would like to express their gratitude to NSERC and EJLB Foundation for supporting this research.
REFERENCES
Black MS, Pearson WJ, and Work LM.1991. A methodology for determining VOC emissions from new SBR latex-backed carpet, adhesive, cushions, and installed systems and
predicting their impact on indoor air quality, Proceedings ofIAQ’ 91, Healthy Buildings, pp267-272. Atlanta:IAQ’91.
Haghighat F, Lee CS, and Ghaly WS. 2002. Measurement of diffusion coefficient of VOCs for building materials: a review of methods and calculation procedure, Indoor Air. (in press)
Holman JP. 1997. Heat Transfer, 8th ed., McGraw Hill, New York.
Lee CS, Ghaly WS and Haghighat F. 2000. VOC emissions from diffusion-controlled building materials: analogy with conjugate heat transfer, Proceedings of Healthy Building 2000, Vol. 4, pp163-168. Espoo:Healthy Building 2000.
Low JM, Zhang JS, Plett EG et al. 1998. Effects of air flow on emissions of volatile organic compounds from carpet-adhesive assemblies, ASHRAE Transactions, pp 1281-1288. Meininghaus R, Knudsen HN and Gunnarsen L. 1998. Diffusion and sorption of volatile
organic compounds in indoor surface materials, Proceedings ofEPIC `98, Vol. 1, pp 33-38. Lyon:EPIC `98.
Nagda NL, Koontz MD, and Kennedy PW. 1993. Small-chamber and research-house testing of tile adhesive emissions, Proceedings ofIndoor Air’93, Vol. 2, pp 591-595, Helsinki: Indoor Air’93.
Özisik MN. 1980. Heat Conduction, John Wiley & sons.