Performance Analysis and Evaluation of Different
Data Mining Algorithms used for Cancer
Classification
Gopala Krishna Murthy NookalaDepartment of Computer Science & Engineering Grandhi Varalakshmi Venkatarao Institute of Technology
Bhimavaram, Andhra Pradesh, India Nagaraju Orsu
Department of Computer Science Goverment Degree College Macherla, Andhra Pradesh, India
Bharath Kumar Pottumuthu
Centre for Bioinformatics Research & S/w Development Grandhi Varalakshmi Venkatarao Institute of Technology
Bhimavaram, Andhra Pradesh, India Suresh B. Mudunuri*
Centre for Bioinformatics Research & S/w Development Grandhi Varalakshmi Venkatarao Institute of Technology
Bhimavaram, Andhra Pradesh, India * Corresponding Author
Abstract—Classification algorithms of data mining have been successfully applied in the recent years to predict cancer based on the gene expression data. Micro-array is a powerful diagnostic tool that can generate handful information of gene expression of all the human genes in a cell at once. Various classification algorithms can be applied on such micro-array data to devise methods that can predict the occurrence of tumor. However, the accuracy of such methods differ according to the classification algorithm used. Identifying the best classification algorithm among all available is a challenging task. In this study, we have made a comprehensive comparative analysis of 14 different classification algorithms and their performance has been evaluated by using 3 different cancer data sets. The results indicate that none of the classifiers outperformed all others in terms of the accuracy when applied on all the 3 data sets. Most of the algorithms performed better as the size of the data set is increased. We recommend the users not to stick to a particular classification method and should evaluate different classification algorithms and select the better algorithm.
Keywords—Weka; Cancer Classification; Micro-array; Data-mining; Classification Algorithms; Gene Expression Data;
I. INTRODUCTION
Advancement of Information Technology led to huge data accumulation in the recent years in several domains including banking, retail, telecommunications and medical diagnostics. The data from all such domains includes valuable information and knowledge which is often hidden. Processing the huge data and retrieving meaningful information from it is a difficult task. Data Mining is a wonderful tool for handling this task. The term Data Mining, also known as Knowledge Discovery in Databases (KDD) refers to the non trivial extraction of implicit, previously unknown and potentially useful information from data in databases [1]. Data mining in cancer research has been one of the important research topics in biomedical science during the recent years [2].
They are several different data mining techniques like Pattern Recognition, Clustering, Association and Classification
[3]. Classification has been identified as an important problem in the emerging field of data mining [4] as they try to find meaningful ways to interpret data sets. Classification of data is very typical task in data mining. There are large number of classifiers that are used to classify the data namely Bayes, Function, Rule’s based, Tree based classification etc. The goal of classification is to correctly predict the value of a designated discrete class variable, given a vector of predictors or attributes [5]. In the age of bioinformatics, cancer data sets have been used for the cancer diagnosis and treatment that can improve human aging [6].
Cancer is a disease characterized by uncontrolled growth and spread of the abnormal cells and the capability to invade other tissues that can be caused by both external factors like radiation, chemicals, tobacco etc., and internal factors like inherited mutations, hormones, immune conditions, etc. There are more than 100 different types of cancers. Most of the cancers are named after the organ or type of cell in which they appear e.g., Melanoma, Colon Cancer, Breast Cancer etc.
All cancers begin in cells which are the structural and functional units of the body. These cells grow and divide in a controlled way to produce more cells as they are needed to keep the body healthy. When cells become old or damaged, they die and are replaced with new cells. However, sometimes life cycle of the cells fails or gets disturbed due to many reasons. When this happens, cells do not die as expected and new cells are formed even when the body does not need them. These extra cells may form a mass of tissue called a tumor. Tumors can be either benign or malignant. Some cancers do not form tumors. For example, leukemia is a cancer of the blood that does not form tumors.
Gene expression analysis of cancer is used to study regulatory gene defects and other devastating diseases, cellular responses to the environment, cell cycle variation, etc. When genes are expressed, the genetic information (base sequence) on DNA is first transcribed (copied) to a molecule named messenger RNA (mRNA). The mRNA molecules further
participate in protein synthesis by specifying the particular amino acids that make up individual proteins. Gene Expression Analysis is one of the major applications of the Micro-array.
Microarray is a hybridizationof a nucleic acid sample (target) to a very large set of oligo-nucleotide probes, which are attached to a solid support (chip), to determine sequence or to detect variations in a gene sequence or expression levels or for gene mapping.
In the recent years, tumor classification is frequently studied by applying various data mining classification algorithms on cancer gene expression micro-array data sets so as to predict the presence of cancer. However, the availability of several algorithms in data mining for classification often leads to confusion over the selection of the right algorithm. In this study, we have made a comparative analysis of the performances of various classification algorithms on different cancer micro-array data sets.
II. MATERIALS AND METHODS
We have used the popular, open-source data mining tool Weka (version 3.6.6) for this analysis. Three different data sets have been used and the performance of a comprehensive set of classification algorithms (classifiers) has been analyzed. The analysis has been performed on a HP Windows system with Intel® Core ™ i3 CPU, 2.40 GHz Processor and 4.00 GB RAM. The data sets have been chosen such that they differ in size, mainly in terms of the number of attributes.
A. Data set 1:
The first data set is a small Breast Cancer Micro-array Gene Expression data used in an earlier study [7]. The data set contains 9 attributes apart from the class attribute with 286 instances.
B. Data set 2:
The second data set is a medium sized data set with Micro-array Gene Expression data of Lymphoma patients [8]. The data set has a total of 4,026 attributes and 45 instances.
C. Data set 3:
The large data set 3 is also a Micro-array Gene Expression data of Leukemia with 7,129 attributes and 34 instances [9].
D. Classifiers Used:
A total of 14 classification algorithms have been used in this comparative study. The classifiers in Weka have been categorized into different groups such as Bayes, Functions, Lazy, Rules, Tree based classifiers etc. A good mix of algorithms have been chosen from these groups that include Bayes Net & Naive Bayes (from Bayes), Multilayer Perceptron, Simple Logistics & SMO (from functions), IBk & KStar (from Lazy), NNge, PART & ZeroR (from Rules) and ADTree, J48, Random Forest & Simple Cart (from Trees). The following sections explain a brief about each of these algorithms.
1. Bayes Net
Bayes Nets or Bayesian networks are graphical representation for probabilistic relationships among a set of random variables. A Bayesian network is an annotated Directed
Acyclic Graph (DAG) that encodes a joint probability distribution [10].
2. Naive Bayesian
Naive Bayesian classifier is developed on bayes conditional probability rule used for performing classification tasks, assuming attributes as statistically independent; the word Naive means strong. All attributes of the data set are considered as independent and strong of each other [11].
3. Simple Logistics
It is a classifier used for building linear logistic regression models. LogitBoost with simple regression functions are base learners used for fitting the logistic models. The optimal number of LogitBoost iterations to perform is cross-validated, which leads to automatic attribute selection [12].
4. Multilayer Perceptron
Multilayer Perceptron is a nonlinear classifier based on the Perceptron. A Multilayer Perceptron (MLP) is a back propagation neural network with one or more layers between input and output layer. The following diagram illustrates a perceptron network with three layers [13].
5. SMO
Sequential Minimal Optimization (SMO) is used for training a support vector classifier using polynomial or RBF kernels. It replaces all missing the values and transforms nominal attributes into binary ones [14]. A single hidden layer neural network uses exactly the same form of model as an SVM.
6. IBk
IBk is a k-nearest-neighbor classifier that uses the same distance metric. k-NN is a type of instance based learning or lazy learning where the function is only approximated locally and all computation is deferred until classification. In this algorithm an object is classified by a majority vote of its neighbors [15].
7. KStar (K*)
Aha, Kibler & Albert describe three instance-based learners of increasing sophistication. IB1 is an implementation of a nearest neighbor algorithm with a specific distance function. IB3 is a further extension to improve tolerance to noisy data. Instances that have a sufficiently bad classification history are forgotten and only instances that have a good classification history are used for classification. Aha [16] described IB4 and IB5, which handle irrelevant and novel attributes.
8. NNge
Instance-based learners are “lazy” in the sense that they perform little work when learning from the data set, but expend more effort classifying new examples. The simplest method, nearest neighbor, performs no work at all when learning. NNge does not attempt to out-perform all other machine learning classifiers. Rather, it examines generalized exemplars as a method of improving the classification performance of instance-based learners [17].
9. PART
PART uses the separate-and-conquer strategy, where it builds a rule in that manner and removes the instances it covers, and continues creating rules recursively for the remaining instances. Where C4.5 and RIPPER does global optimization to produce accurate rule sets, this added simplicity is the main advantage of PART [18].
10. ZeroR
ZeroR is the simplest classification method which depends on the target and ignores all predictors. ZeroR classifier simply predicts the majority category (class). Although there is no predictability power in ZeroR, it is useful for determining a baseline performance as a benchmark for other classification methods [19].
11. ADTree
Alternating Decision Tree is one of the classification method used in Machine learning which consists of decision nodes and prediction nodes. An instance is classified by an ADTree for which all decision nodes are true and summing any prediction nodes that are traversed. This makes it different from basic classification tree models that follow only one path through the tree [20].
12. J48
The J48 algorithm is WEKA’s implementation of the C4.5 decision tree learner. The algorithm uses a greedy technique to induce decision trees for classification and uses reduced-error pruning [21].
13. Random Forest
Random forest is an ensemble classifier which consists of many decision tree and gives class as outputs i.e., the mode of the class's output by individual trees. Random Forests gives many classification trees without pruning [22].
14. Simple Cart
CART is a recursive and gradual refinement algorithm of building a decision tree, to predict the classification situation of new samples of known input variable value. Breiman et. al., 1984 provided this algorithm and is based on Classification and Regression Trees (CART) [23].
In our study, we have applied all the above classifiers on the 3 different cancer data sets and the results have been analyzed.
III. RESULTS AND DISCUSSION
The data sets have been submitted to a set of classification algorithms of Weka. We have used the 'Explorer' option of the Weka tool. Certain comparative studies conducted earlier [24][25][26][27][28] have shown that a particular algorithm has performed better on their data set and their conclusions however differ from each other. The studies either have used a very minimal set of classifiers or have used data sets that are not diverse resulting in an advantage or bias for a particular algorithm. Keeping that in mind, we have included a good number of classifiers in our analysis and used data sets that are diverse (in terms of size). The following sections describe the results obtained in our analysis.
A. Classification of Data set 1
The data set 1 is a small data set of micro-array gene expression data of Breast Cancer with 10 attributes and 286 instances. 5 out of the 14 algorithms got an accuracy of more than 95% where as the remaining algorithms reported the classification accuracy between 70% and 80%. Table 1 shows the results obtained in the analysis on data set 1.
The results in Table 1 indicate that the classifiers Multilayer Perceptron (ANN), IBk, KStar, NNge, and Random Forest performed better than the remaining algorithms. The Multilayer perceptron however took more time (11.68 secs) for classification whereas the remaining algorithms took almost less than 1 second. The kappa statistic for these 5 algorithms has been almost the same (~0.9). It should be noted that except IBk and KStar (Lazy classifiers), the classifiers among the better performers do not belong to the same group.
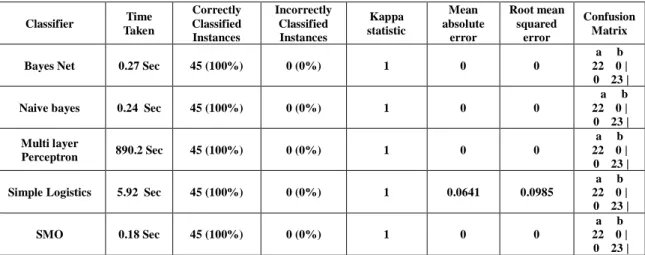
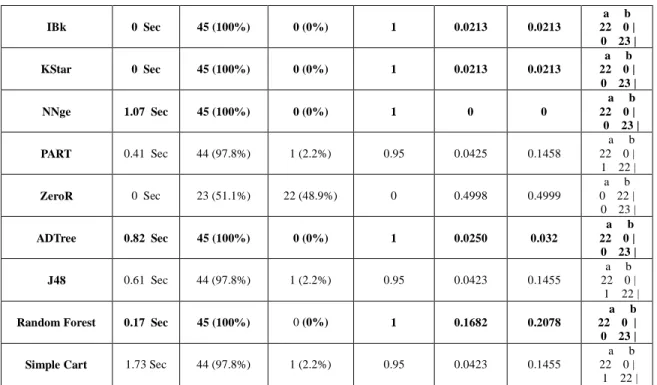
B. Classification of Data set 2
When a medium size data set (Lymphoma data set with 4,026 attributes and 45 instances) has been classified, the performance of the classifiers has significantly improved. All the classifiers (except ZeroR) reported more than 97% accuracy. Table 2 gives a summary report of the performances of all the classifiers when applied on Lymphoma data set.
10 out of 14 classifiers have got 100% accuracy as they correctly classified all the 45 instances. Though the number of instances decreased from 268 instances (from data set 1) to 45, the performance of the classifiers has been very good. The data set 2 has more number of attributes than data set 1 that resulted in better accuracy. The multilayer perceptron besides classifying all the instances correctly has however took a longer time (890.2 seconds) to get the results and hence, the accuracy of multi-layer perceptron can be ignored.
C. Classification of Data set 3
Finally, the large data set of Leukemia with 7,129 attributes and 34 instances has been used. The classifiers have achieved accuracies similar to the classification of medium size data set. However, the classifiers KStar and ZeroR underperformed. Rest of the classifiers achieved accuracies close to 100%. As expected, Multilayer perceptron took very long time to generate results. Table 3 gives a summary report of the performances of all the classifiers when applied on Leukemia
TABLE I. Comparison of different classifiers using Breast Cancer Micro-array Gene Expression Data set with 10 attributes and 286 instances. Classifier Time Taken Correctly Classified Instances Incorrectly Classified Instances Kappa statistic Mean absolute error Root mean squared error Confusion Matrix
Bayes Net 0.02 Sec 217 (75.9%) 69 (24.1%) 0.3958 0.3018 0.4284
a b 173 28 | 41 44 |
Naive bayes 0.03 Sec 215 (75.2%) 71 (24.8%) 0.3693 0.3012 0.4278
a b 174 27 | 44 41 | Multi layer Perceptron 11.7Sec 276 (96.5%) 10 (3.5%) 0.9157 0.0482 0.1567 a b 197 4 | 6 79|
Simple Logistics 0.87 Sec 218 (76.2%) 68 (23.8%) 0.32 0.3535 0.4183
a b 191 10 | 58 27 | SMO 0.11 Sec 218 (76.2%) 68 (23.8%) 0.3615 0.2378 0.4876 a b 183 18 | 50 35 | IBk 0 Sec 280 (97.9%) 6 (2.1%) 0.9491 0.0253 0.1053 a b 200 1 | 5 80 | KStar 0 Sec 280 (97.9%) 6 (2.1%) 0.9494 0.0747 0.1399 a b 199 2| 4 81| NNge 0.27 Sec 278 (97.2%) 8 (2.8%) 0.933 0.028 0.1672 a b 197 4 | 4 81 | PART 0.21 Sec 229 (80.1%) 57 (19.9%) 0.4825 0.299 0.3866 a b 184 17 | 40 45 | ZeroR 0 Sec 201 (70.3%) 85 (29.7%) 0 0.4183 0.457 a b 201 0 | 85 0 | ADTree 0.08 Sec 223 (78.0%) 63 (22.0%) 0.4522 0.3659 0.4024 a b 175 26 | 37 48 | J48 0.02 Sec 217 (75.9%) 69 (24.1%) 0.2899 0.3658 0.4269 a b 194 7 | 62 23 |
Random Forest 0.24 Sec 278 (97.2%) 8 (2.8%) 0.9326 0.1439 0.204
a b 193 8 | 5 80 |
Simple Cart 1.1 Sec 201 (70.3%) 85 (29.7%) 0 0.4177 0.457
a b 201 0 | 85 0 |
TABLE II. Comparison of different classifiers using Lymphoma Cancer Micro-array Gene Expression Data set with 4,026 attributes and 45 instances.
Classifier Time Taken Correctly Classified Instances Incorrectly Classified Instances Kappa statistic Mean absolute error Root mean squared error Confusion Matrix
Bayes Net 0.27 Sec 45 (100%) 0 (0%) 1 0 0
a b 22 0 | 0 23 |
Naive bayes 0.24 Sec 45 (100%) 0 (0%) 1 0 0
a b 22 0 | 0 23 | Multi layer Perceptron 890.2 Sec 45 (100%) 0 (0%) 1 0 0 a b 22 0 | 0 23 |
Simple Logistics 5.92 Sec 45 (100%) 0 (0%) 1 0.0641 0.0985
a b 22 0 | 0 23 | SMO 0.18 Sec 45 (100%) 0 (0%) 1 0 0 a b 22 0 | 0 23 |
IBk 0 Sec 45 (100%) 0 (0%) 1 0.0213 0.0213 a b 22 0 | 0 23 | KStar 0 Sec 45 (100%) 0 (0%) 1 0.0213 0.0213 a b 22 0 | 0 23 | NNge 1.07 Sec 45 (100%) 0 (0%) 1 0 0 a b 22 0 | 0 23 | PART 0.41 Sec 44 (97.8%) 1 (2.2%) 0.95 0.0425 0.1458 a b 22 0 | 1 22 | ZeroR 0 Sec 23 (51.1%) 22 (48.9%) 0 0.4998 0.4999 a b 0 22 | 0 23 | ADTree 0.82 Sec 45 (100%) 0 (0%) 1 0.0250 0.032 a b 22 0 | 0 23 | J48 0.61 Sec 44 (97.8%) 1 (2.2%) 0.95 0.0423 0.1455 a b 22 0 | 1 22 |
Random Forest 0.17 Sec 45 (100%) 0 (0%) 1 0.1682 0.2078
a b 22 0 | 0 23 |
Simple Cart 1.73 Sec 44 (97.8%) 1 (2.2%) 0.95 0.0423 0.1455
a b 22 0 | 1 22 |
TABLE III. Comparison of different classifiers using Leukemia Cancer Micro-array Gene Expression Data set with 7,129 attributes and 34 instances.
Classifier Time Taken Correctly Classified Instances Incorrectly Classified Instances Kappa statistic Mean absolute error Root mean squared error Confusion Matrix
Bayes Net 1.78 Sec 34 (100%) 0 (0%) 1 0 0
a b 20 0 | 0 14 |
Naive bayes 0.41 Sec 34 (100%) 0 (0%) 1 0 0
a b 20 0 | 0 14 | Multi layer Perceptron 1313.87 Sec 33 (97.1%) 1 (2.9%) 0.9038 0.376 0.0267 a b 20 0 | 1 13 |
Simple Logistics 9.5 Sec 34 (100%) 0 (0%) 1 0 0
a b 20 0 | 0 14 | SMO 0.19 Sec 34 (100%) 0 (0%) 1 0 0 a b 20 0 | 0 14 | IBk 0.01 Sec 34 (100%) 0 (0%) 1 0.0278 0.0278 a b 20 0 | 0 14 | KStar 0 Sec 20 (58.8%) 14 (41.2%) 0 0.5 0.5 a b 20 0 | 14 0 | NNge 1.48 Sec 34 (100%) 0 (0%) 1 0 0 a b 20 0 | 0 14 | PART 0.32 Sec 34 (100%) 0 (0%) 1 0 0 a b 20 0 | 0 14 | ZeroR 0 Sec 20 (58.8%) 14 (41.2%) 0 0.4853 0.4922 a b 20 0 | 14 0 | ADTree 1.5 Sec 34 (100%) 0 (0%) 1 0.0142 0.0145 a b 20 0 | 0 14 | J48 0.52 Sec 34 (100%) 0 (0%) 1 0 0 a b 20 0 | 0 14 |
Random Forest 0.49 Sec 33 (97.1%) 1 (2.9%) 0.9386 0.1353 0.1955
a b 20 0 | 1 13 |
Simple Cart 2.0 Sec 34 (100%) 0 (0%) 1 0 0
a b 20 0 | 0 14 |
The results from the above 3 tables have been analyzed manually and they indicate that the classifiers work better when there is an increase in the number of attributes in the data set. But, none of the classifiers outperformed the others in terms of the accuracies. The classifiers Multilayer perceptron, IBk, NNge, and Random Forest have performed better on all 3 data sets. However, the performance of Multilayer Perceptron should not be considered because of the huge execution time taken by the classifier to generate results. The algorithm KStar reported around 58% accuracy for the large data set whereas the classifier ZeroR did not perform well on all 3 data sets. The remaining classifiers (except KStar and ZeroR) performed better on large data sets which are expected. The other statistics like kappa statistic and errors seem to be more or less same among all the classifiers in all three tests and are based on the accuracy of the prediction.
IV. CONCLUSION
This study focuses on finding the right algorithm for classification of data that works better on diverse data sets. However, it is observed that the accuracies of the tools vary depending on the data set used. It should also be noted that classifiers of a particular group also did not perform with similar accuracies. Overall, the results indicate that the performance of a classifier depends on the data set, especially on the number of attributes used in the data set and one should not rely completely on a particular algorithm for their study. So, we recommend that users should try their data set on a set of classifiers and choose the best one.
V. FUTURE WORK
We would like to develop web based software for performance evaluation of various classifiers where the users can just submit their data set and evaluate the results on the fly.
ACKNOWLEDGMENT
Bharath Kumar would like to thank Dr. DSVGK Kaladhar of GITAM University for his timely co-operation and guidance in completing the analysis. The authors greatly acknowledge the management and staff of GVVIT for their support and for providing lab facilities.
REFERENCES
[1] J. Han and M. Kamber, “Data Mining: Concepts and Techniques,”
Morgan Kaufmann, 2006.
[2] M.S. Chen, J. Han, and P.S. Yu. “Data mining: an overview from a database perspective,” IEEETransactions on Knowledge and Data Engineering, Vol. 8, No.6, pp. 866 – 883, 2002.
[3] R. Chauhan, H. Kaur, and M.A. Alam, “Data Clustering Method for Discovering Clusters in Spatial Cancer Databases”, International Journal of Computer Applications (0975 – 8887) Volume 10– No.6. [4] R. Agrawal, T. Imielinski and A. Swami, “ Data mining : A Performance
Perspective”. IEEE Transactions on Knowledge and Data Engineering
(1993), 5(6):914-925.
[5] D. Grossman and P. Domingos. “Learning Bayesian Network Classifiers by Maximizing Conditional Likelihood”. Proceedings of the 21st
International Conference on Machine Learning, Banff, Canada, 2004. [6] J. C. Bailar, T.A. Louis, P.W. Lavori, and M. Polansky, “A Classification
for Biomedical Research Reports,” N Engl J Med,, Vol. 311, No. 23, pp. 1482-1487, 1984.
[7] R.S. Michalski, I. Mozetic, J. Hong, and N. Lavrac, “The Multi-Purpose Incremental Learning System AQ15 and its Testing Application to Three Medical Domains”. In Proceedings of the Fifth National Conference on Artificial Intelligence, 1041-1045.
[8] A.A. Alizadeh, B. M.B. Eisen, R.E. Davis, C.M., et. al “Distinct types of diffuse large B-cell lymphoma identified by gene expression profiling.” Nature, Vol 403, No. 3, pp. 503-511, 2000.
[9] T.R. Golub, D. K. Slonim, P. Tamayo, C. Huard et al, “Molecular Classification of Cancer: Class Discovery and Class Prediction by Gene Expression Monitoring” Science, Vol. 286, pp. 531-537, 15 October 1999.
[10] Y. kumar and G. Sahoo, “Analysis of Bayes, Neural Network and Tree Classifier of Classification Technique in DataMining using WEKA”,
International Journal of Information Technology in Computer Science, vol. 4 (7), 359-369, 2012.
[11] D. Pedro and M. Pazzani "On the optimality of the simple Bayesian classifier under zero-one loss". Machine Learning, 29:103–137, 1997. [12] N. Landwehr, M. Hall, and E. Frank. “Logistic model trees” Machine
Learning, 59(1-2):161-205, 2005.
[13] Rosenblatt and X. Frank. Principles of Neurodynamics: Perceptrons and the Theory of Brain Mechanisms. Spartan Books, Washington DC, 1961. [14] S.S. Keerthi, S.K. Shevade, C. Bhattacharyya, K.R.K.
Murthy “Improvements to Platt's SMO Algorithm for SVM Classifier Design”. Neural Computation, 13(3), pp 637-649, 2001.
[15] D. Coomans, and D. L. Massart. "Alternative k-nearest neighbour rules in supervised pattern recognition: Part 1. k-Nearest neighbour classification by using alternative voting rules." Analytica Chimica Acta136 (1982): 15-27.
[16] A. Jemal, DVM, PhD; Freddie Bray, PhDCA CANCER J CLIN
2011;61:69–90
[17] B. Martin. Instance - Based Learning: Nearest Neighbour with generalisation, Department of Computer Science, University of Waikato, Hamilton, New Zealand
[18] E. Frank and I. H. Witten. “Generating accurate rule sets without global optimization”. In Proc 15th International Conference on Machine Learning.
[19] I.H.Witten and E. Frank, “Data mining: practical machine learning tools and techniques” ISBN: 0-12-088407-0.
[20] Y. Freund and L. Mason. “The Alternating Decision Tree Algorithm.”
Proceedings of the 16th International Conference on Machine Learning, pages 124-133 (1999)
[21] J. R. Quinlan “C4.5: programs for machine learning” Morgan Kaufmann Publishers Inc., San Francisco, CA, USA, 1993.
[22] L. Breiman, “Random Forests” Machine Learning. 45(1):5-32, 2001. [23] L. Breiman, J.H. Friedman, R.A. Olshen, C.J. Stone. Classification and
Regression Trees. Wadsworth International Group, Belmont, California, 1984.
[24] D.S.V.G.K. Kaladhar and B. Chandana “Data mining, inference and prediction of Cancer datasets using learning algorithms, International Journal of Science and Advanced Technology,Volume 1 No 3 May 2011 [25] B. Othman, Md. Fauzi, and T. M. S. Yau. "Comparison of different
classification techniques using WEKA for breast cancer." 3rd Kuala Lumpur International Conference on Biomedical Engineering 2006. Springer Berlin Heidelberg, 2007.
[26] A.Rohit. "Comparative Analysis of Classification Algorithms on Different Datasets using WEKA." Int. Journal of Computer Applications
54.13, 2012.
[27] D. Delen, G Walker, and A. Kadam. "Predicting breast cancer survivability: a comparison of three data mining methods." Artificial intelligence in medicine,34.2: 113-128, 2005.
[28] H. Mark, et al. "The WEKA data mining software: an update." ACM SIGKDD Explorations Newsletter, 11.1: 10-18, 2009.
AUTHORS PROFILE
Mr. Gopala Krishna Murthy Nookala obtained his B.Sc degree from Andhra University, Visakhapatnam, India. He obtained his Master’s degree in Computer Applications from Bharathiar University, M.Tech in Information Technology from Andhra University and also obtained Master of Philosophy in Computer Science from Alagappa University. He is pursuing his PhD in Computer Science & Engineering in Acharya Nagarjuna University since 2008. Currently, he is working as a Professor in the Department of Computer Science and Engineering, G.V.V.R.Institute of Technology, Bhimavaram, Andhra Pradesh. His specializations include Bioinformatics, Data mining, Networking, and Software Engineering. His current research interests are complexity reduced tumor classification using micro-array data-sets, usage of bioinformatics tools and optimization techniques for ant based networks using swarm intelligence.
Mr. Bharath Kumar Pottumutthu obtained his M.Sc in Bioinformatics from GITAM University, Visakhapatnam, India and B.Sc from Andhra University, Visakhapatnam. He is currently working as a Research Assistant in Centre for Bioinformatics and Software Development (CBRSD) at GVVR Institute of Technology, Bhimavaram. His current research interests include Comparative Genomics, Bioinformatics and Machine Learning.
Dr. NagaRaju Orsu received Ph.D. degree in Computer Science in the faculty of Engineering in 2011 from Acharya Nagarjuna University, Guntur, India and Masters Degree in Computer Science & Engineering from Acharya Nagarjuna University. He has a satisfactory and consistent academic track record. He is currently working as Head of the Department of Computer Science, Government Degree College, Macherla. He has occupied various academic positions like practical examiner, project adjudicator for various universities and colleges in and around in Andhra Pradesh. His current research is focused on Bioinformatics, Software Engineering, Image Processing & Database Management System. He has published several papers in National & International Journals.
Dr. Suresh B. Mudunuri received his PhD in Computer Science & Systems Engineering from Andhra University College of Engineering, Visakhapatnam, India in the year 2012. He received his BCA and MS degrees from Andhra University, and International Institute of Information Technology (IIIT), Hyderabad in 2002 and 2005 respectively. During 2005 and 2007, he worked on a bioinformatics research project in the Lab of Computational Biology (LCB) at Centre for DNA Fingerprinting and Diagnostics (CDFD), Hyderabad. Later, he has also worked as an Associate Professor in CSE departments at Aditya Engineering College, Surampalem and Vishnu Institute of Technology, Bhimavaram. He is currently working as Head of Centre for Bioinformatics Research & Software Development (CBRSD) at GVVR Institute of Technology, Bhimavaram. He is passionate to do research in the areas of Bioinformatics, Computational Biology and Data mining. He has published good number of quality research papers in international journals and conferences.