KOVITZ INSIGHTS
KOVITZ.COM
Only at its start could 2020 be considered a ‘normal’ year. Broad equity indexes climbed to record highs in mid-February and November’s Presidential Election loomed as the year’s major event. Yet, the world came to a screeching halt in the latter part of February as a pandemic, on a scale not seen for a century, raced around the globe, leaving government officials scrambling to mitigate its impact. Efforts to curb the spread resulted in travel bans, movement restrictions, industry shutdowns and, perplexingly, rushes to accumulate vast quantities of toilet paper. Governments also rushed to put massive stimulus packages together, central banks slashed interest rates and television networks spent hours debating the best courses of action.
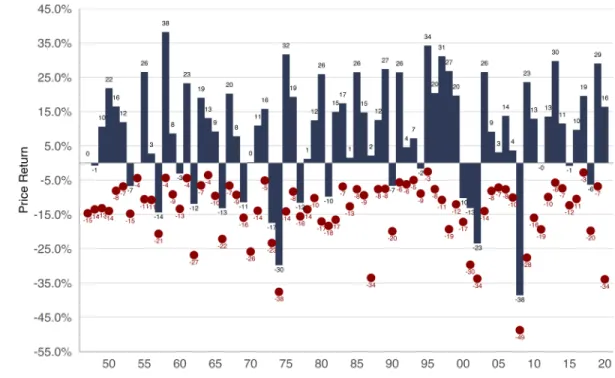
Simultaneous to the pandemic taking its toll on economic and human health, much of the market boomed. By December 31, the S&P 500’s year-to-date gain totaled 18.4% including dividends, nearly double the long-term average of 10.0%, while the broad Russell 3000 gained 20.9%. The average stock in the respective indexes gained 9.5% and 16.3%, a gap that was wider earlier in the year and narrowed in the latter half of 2020 thanks to a surge by small-capitalization stocks. Figure 1 shows the S&P 500’s overall annual return as a blue bar and its respective peak-to-trough return as a red dot. In 2020, the S&P 500 dropped as much as 34% from the peak and closed up more than 16%, a difference of 50.2%. The second widest gap (only 2008 was wider at 51.1%) since World War II and double the long-term average of 23%.
However, the quickly rising tide in 2020 did not lift all boats. Once again, Wall Street had a sale and whether folks showed up to shop at seemingly discounted prices depended heavily on a company’s business sector. We think that’s largely fair given the pandemic’s uneven business impact, and it offers another reminder that it’s a market of stocks and not simply a stock market.
The Rising Tide of 2020
JANUARY 7, 2021
Christopher Quigley SENIOR RESEARCH
ANALYST
Figure 1: S&P 500 Price Return with Annual Low Point
From 12.31.1946 through 12.31.2020. Price returns do not include dividends. Intra-year drops refer to the largest drops between high and low closing prices during a calendar year. SOURCE: Kovitz using data from Bloomberg Finance L.P.
We believe that the inequality in terms of stock price gains in 2020 leaves plenty of opportunity for stock pickers to make careful improvements to the positioning of their portfolios. In Figure 2, we break down the Russell 3000 index down by sector, counting the number of stocks that have gained or lost value over the course of the year. Broad market indexes, including the S&P 500 and Russell 3000, were bolstered by heavy weights in the strongly positive Information Technology and Health Care sectors, while companies in the Energy and Financials sectors detracted from performance.
From 12.31.2019 through 12.31.2020. Russell 3000 index. Green (gold) bars denote positive (negative) performance. Total return. SOURCE: Kovitz using data from Bloomberg Finance L.P.
Figure 2:
The Rising Tide in 2020 Did Not Lift Some Boats
BUT IT WAS VOLATILE!
The stock market gyrations were remarkable and the pandemic-related fallout pushed volatility above records set in the Tech Bubble and Great Recession. Fortunately, the volatility was short-lived compared to other spikes in the past three decades, shown in Figure 3, thanks to major government economic support and vaccine hopes, which calmed some nerves.
From 12.31.1990 to 12.31.2020. Trailing realized 22-day volatility of the S&P 500 daily returns. S&P 500 Price Return index. SOURCE: Kovitz using data from Bloomberg Finance L.P.
Figure 3:
Volatility Spiked, but the Jump was Short-Lived
STOCKS ARE EXPENSIVE NOW, RIGHT?
Not necessarily. Valuations for Value and Growth stocks have expanded recently thanks in large part to tumbling earnings expectations. However, stock prices have not retreated proportionally, which we think is reflective of investor expectations that revenue and earnings will rebound in the nearer term. In Figure 4, the Russell 3000 Growth index’s forward P/E ratio (estimated price-to-earnings) surged and remains markedly above its long-term average. The Value index’s forward P/E also remains elevated, though not as far from the average.
In Figure 5, we present the P/B ratio (price-to-book-value), which has expanded by a wider margin than the preceding earnings chart. Of course, the P/E and P/B ratios are but two valuation measures, and the California Investment Team scores them plus other factors for more than 3,000 securities on a daily basis to offer a well-rounded assessment of our investible universe.
From 05.31.1995 through 12.31.2020. Russell 3000 Value and Russell 3000 Growth index price to estimated 12-month (forward) earnings per share ratio. SOURCE: Kovitz using data from Bloomberg Finance L.P
Figure 4:
Value and Growth P/E Ratio over Time
From 05.31.1995 through 12.31.2020. Russell 3000 Value and Russell 3000 Growth index price to book value ratio. SOURCE: Kovitz using data from Bloomberg Finance L.P
Figure 5:
Value and Growth P/B Ratio over Time
THE TOP LINE
In Figure 6, we present the year-over-year percentage change in revenue by sector. While revenue growth for the overall S&P 500 has been positive, that of the underlying sectors often departs from the average. The effect is most pronounced for Energy and Materials where geopolitical spats and supply/demand effects often weigh heavily. Health Care and Technology have generally enjoyed more stable revenue streams as the U.S. population ages and IT investment is longer-term in nature. The data reaches back to the 1990s (except Communications Services, a newer sector), and the bubble years are somewhat unpronounced. Indeed, many dot-com companies contributed little to sector revenue growth numbers and the bubble was with respect to valuations. Those valuations that were built on the illusion of future sales and profits capitalized any paltry sales numbers at astronomically high rates. When revenue-light companies imploded, they did not weigh heavily on the overall sector. In contrast, the Great Financial Crisis in 2009 and COVID-19 pandemic in 2020 caused companies with large revenue streams to evaporate overnight, causing substantial year-over-year drops which are more pronounced in the data. We believe there is valuable information embedded in revenue and revenue growth rates. Pairing top-line figures with relative valuation metrics like the P/E ratio (measuring income) and the P/B ratio (measuring asset value) offers a solid foundation upon which to perform a deeper qualitative review.
From 01.31.1990 to 12.31.2020. Sectors based on the Global Industry Classification Standard (GICS) and the S&P 500 index. SOURCE: Kovitz using data from Bloomberg Finance L.P.
Figure 6:
Year-over-Year Revenue Changes by Sector
FULL STEAM AHEAD
We are relieved to see the calendar flip to 2021, especially as there is growing hope that the rollout of several vaccines will begin to turn the tide in the global battle against the coronavirus. We think that the market gyrations during 2020 offered an important reminder that the secret to successful investing in stocks is not to get scared out of them. Investors who made major allocation changes away from equities or went to cash early in 2020 are sure to lament making those moves, and it doesn’t matter what stocks one picks if a portfolio is sitting in cash! Of course, there are ways to mitigate downside risk without moving to cash and for more information on that front, we encourage folks to reach out to a Kovitz financial professional. While we are always braced for downside volatility, we are optimistic in our outlook for equities in 2021. We remain partial to companies trading at inexpensive fundamental valuations and paying generous dividends, especially as the gap between Value and Growth is as wide as it has ever been. The low interest rate environment should favor income-producing stocks, with yields on our portfolios well above 2%.
DISCLOSURES
Definition of the Firm: Kovitz Investment Group Partners, LLC (Kovitz) is an investment adviser registered under the Investment Advisers Act of 1940 that provides investment management services to individual and institutional clients. From October 1, 2003 to December 31, 2015, the Firm was defined as Kovitz Investment Group, LLC. Effective January 1, 2016, Kovitz Investment Group, LLC under-went an organizational change and all persons responsible for portfolio management became employees of Kovitz. From January 1, 1997 to September 30, 2003, all persons responsible for portfolio management comprised the Kovitz Group, an independent division of Rothschild Investment Corp (Rothschild).
GIPS: Kovitz Investment Group Partners, LLC (Kovitz) claims compliance with the Global Investment Performance Standards (GIPS®) and has prepared and presented this report in compliance with the GIPS standards. Kovitz has been independently verified for the periods January 1, 1997 through December 31, 2018. The verification report is available upon request. Verification assesses whether (1) the firm has complied with all the composite construction requirements of the GIPS standards on a firm-wide basis and (2) the firm’s policies and procedures are designed to calculate and present performance in compliance with the GIPS standards. Verification does not ensure the accuracy of any specific composite presentation. A complete list of firm composites and performance results is available upon request.
The description of products, services, and performance results contained herein is not an offering or a solicitation of any kind. Past performance is not an indication of future results. Securities invest-ments are subject to risk and may lose value.
All returns are geometric average unless otherwise stated. The geometric average is calculated using the mean of a set of products that takes into account the effects of compounding. The federal funds rate is the rate banks charge on loans to each other.
The quoted forward yield for the S&P 500 uses the iShares S&P 500 ETF (ticker: SPY) as a proxy. The quoted forward yield for the S&P Core Value uses iShares Core S&P U.S. Value ETF (ticker: IUSV) as a proxy. The quoted forward yield for the S&P Core Growth uses iShares Core S&P U.S. Growth ETF (ticker: IUSG) as a proxy.
The factor-based (book value-to-price) portfolio data is from Eugene F. Fama and Kenneth R. French. The dataset is broken into four groups: large value, large growth, small value and small growth. The aggregate Value and Growth portfolios are monthly averages of the two returns.
The Standard & Poors 500 index (S&P 500) is a broad stock market index based on the market capitalizations of the largest 500 companies listed in the U.S. Small company stocks, via Ibbotson Associ-ates, are the bottom twenty percent of the New York Stock Exchange. Large company stocks, via Ibbotson AssociAssoci-ates, are represented by the S&P 500 index. The S&P 500 Growth Index is a market capitalization weighted index. All the stocks in the underlying parent index are allocated into value or growth. Stocks that do not have pure value or pure growth characteristics have their market caps distributed between the value & growth indices. Prior to 12/19/2005 this index represented the S&P 500/Barra Growth Index. The S&P 500 Value Index is a market capitalization weighted index. All the stocks in the underlying parent index are allocated into value or growth. Stocks that do not have pure value or pure growth characteristics have their market caps distributed between the value & growth indices. Prior to 12/19/2005 this index represented the S&P 500/Barra Value Index.
The Russell 3000 Index is composed of 3000 large U.S. companies, as determined by market capitalization. This portfolio of Securities represents approximately 98% of the investable U.S. equity market. The Russell 3000 Index is comprised of stocks within the Russell 1000 and the Russell 2000 Indices. Russell 3000 Growth Index measures the performance of those Russell 3000 Index companies with higher price-to-book ratios and higher forecasted growth values. Russell 3000 Value Index measures the performance of those Russell 3000 Index companies with lower price-to-book ratios and lower forecasted growth values.
From 1927 to present, we utilized the dividend-weighted portfolio data from Eugene F. Fama and Kenneth R. French. The dataset is broken into five groups: non-dividend paying, top 30% of dividend payers, middle 40% of dividend payers, bottom 30% of dividend payers and all dividend payers (weighted 30% of top dividend payers, 40% of middle dividend payers and 30% of low dividend payers). Kovitz Investment Group Partners, LLC (“Kovitz”) is an investment adviser registered with the Securities and Exchange Commission. The information and opinions expressed in this publication are not intended to constitute a recommendation to buy or sell any security or to offer advisory services by Kovitz. The material has been prepared or is distributed solely for information purposes and is not a solicitation or an offer to participate in any trading strategy, and should not be relied on for accounting, tax or legal advice. This report should only be considered as a tool in any investment decision matrix and should not be used by itself to make investment decisions.
Opinions expressed are only our current opinions or our opinions on the posting date. Any graphs, data, or information in this publication are considered reliably sourced, but no representation is made that it is accurate or complete, and should not be relied upon as such. This information is subject to change without notice at any time, based on market and other conditions. Past perfor-mance is not indicate of future results, which may vary. 21-5-001
For more information on working with our financial professionals contact us at [email protected] or 312.334.7300.