Preethi Lahoti
School of Science
Thesis submitted for examination for the degree of Master of Science in Technology.
Espoo July 31, 2017
Thesis supervisor:
Prof. Aristides Gionis
Thesis advisor:
Author: Preethi Lahoti
Title: Learning Ideological Latent space in Twitter
Date: July 31, 2017 Language: English Number of pages: 5+47 Department of Computer Science
Professorship:
Supervisor: Prof. Aristides Gionis Advisor: M.Sc. Kiran Garimella
People are shifting from traditional news sources to online news at an incredibly fast rate. However, the technology behind online news consumption forces users to be confined to content that confirms with their own point of view. This has led to social phenomena like polarization of point-of-view and intolerance towards opposing views. In this thesis we study information filter bubbles from a mathematical standpoint. We use data mining techniques to learn a liberal-conservative ideology
space in Twitter and presents a case study on how such a latent space can be used to tackle the filter bubble problem on social networks.
We model the problem of learning liberal-conservative ideology as a constrained
optimization problem. Using matrix factorization we uncover an ideological latent space for content consumption and social interaction habits of users in Twitter. We validate our model on real world Twitter dataset on three controversial topics -“obamacare”, “gun control” and “abortion”. Using the proposed technique we are
able to separate users by their ideology with 95% purity. Our analysis shows that
there is a very high correlation (0.8−0.9) between the estimated ideology using
machine learning and true ideology collected from various sources.
Finally, we re-examine the learnt latent space, and present a case study showcasing how this ideological latent space can be used to develop exploratory and interactive interfaces that can help in diffusing the information filter bubble. Our matrix factorization based model for learning ideology latent space, along with the case studies provide a theoretically solid as well as a practical and interesting point-of-view to online polarization. Further, it provides a strong foundation and suggests several avenues for future work in multiple emerging interdisciplinary research areas, for instance, humanly interpretable and explanatory machine learning, transparent recommendations and a new field that we coin as Next Generation Social Networks.
Keywords: Information Filter Bubble, Social Media, Twitter, Polarization, Matrix Factorization, Combining Link and Content, Ideology Score, Latent Space Learning, Graph Regularization
Preface
This thesis would not have been possible without the support by the Aalto University’s Computer Science department, Tekes project “Re:Know,” and the EC H2020 project “SoBigData” (654024).
I would like to express my deepest gratitude to my thesis supervisor Prof. Aristides Gionis who has taught me all I know about Data Mining. I would like to thank my thesis advisor Kiran Garimella, this thesis would not have been possible without his excellent guidance throughout the work. I would like to thank all my teachers and professors. I would like to additionally thank all my colleagues for engaging discussions and insightful comments that gave inspiration to many ideas during the thesis. I would like to thank my university staff for their support throughout my thesis.
Most of all, I would like to thank my dear husband Robert for his incessant support, great ideas and exciting discussions. His presence and the means provided, made the everyday routine significantly more luxurious and enjoyable.
Espoo, July 31, 2017
Contents
Abstract ii
Preface iii
Contents iv
1 Introduction 1
1.1 Motivation and Scope. . . 1
1.2 Literature . . . 2
1.3 Research questions . . . 3
1.4 Contributions . . . 3
1.5 Outline. . . 4
2 Background 5 2.1 Terms and Definitions . . . 5
2.1.1 Information Filter Bubble . . . 5
2.1.2 Twitter Terminology . . . 5
2.2 Overview of NMF . . . 6
2.2.1 NMF for Clustering. . . 6
2.2.2 Equivalence between NMF and K-Means . . . 6
2.2.3 Co-clustering . . . 7
2.2.4 NMF with Tri-Factorization (NMTF) . . . 7
2.2.5 Symmetric Matrix Factorization . . . 7
2.2.6 Graph Regularization . . . 8
3 Problem Formulation 9 3.1 Motivation . . . 9
3.2 Summary . . . 9
3.3 Definitions and Notations . . . 10
3.4 Problem Description . . . 11
3.5 Problem Formulation . . . 12
3.6 Optimization Problem . . . 16
3.6.1 Optimization problem . . . 16
3.6.2 Derivation of update rules . . . 16
4 Methodology 17 4.1 Summary . . . 17
4.2 Learning Ideological Latent Space . . . 17
4.3 Probabilistic Interpretation of Latent Factors. . . 17
5 Experiments 20
5.1 Dataset collection and processing . . . 20
5.2 Constructing input matrices . . . 20
5.2.1 Bipartite content graph and adjacency matrixC . . . 21
5.2.2 Social link graph and adjacency matrix A . . . 21
5.2.3 Laplacian of affinity graphsLu and Lv . . . 21
5.3 Experimental setup . . . 21
5.3.1 Parameter setting . . . 22
5.3.2 Initialization. . . 22
5.3.3 Summary of the experimental steps . . . 22
5.3.4 Seperating users and sources by ideology . . . 23
5.3.5 Computing ideological scores. . . 23
5.4 Evaluation . . . 24
5.4.1 Baseline algorithms . . . 24
5.4.2 Ground truth construction . . . 25
5.4.3 Evaluation measures . . . 26
5.5 Results . . . 27
5.5.1 Evaluation of clustering and ideology scores . . . 27
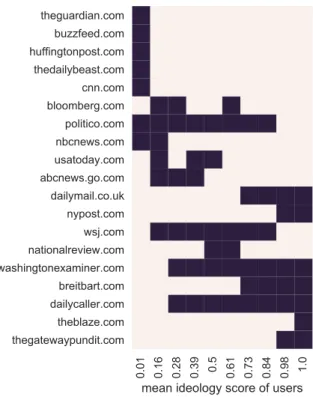
5.5.2 Ideology estimates of popular news media outlets . . . 28
5.5.3 Distribution of users by ideology. . . 29
5.5.4 Association between news sources and polarization of users . . 30
6 Case Study: Diffusing the Information Filter Bubble 33 6.1 Summary . . . 33
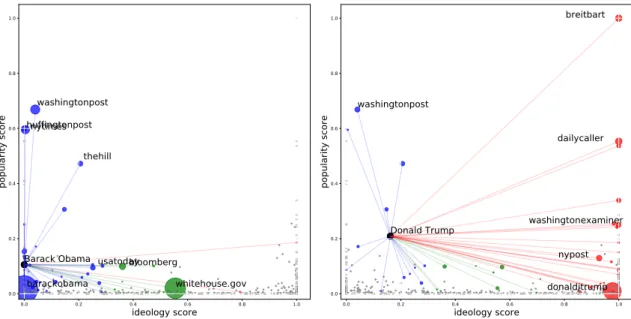
6.2 Making users aware of their own information filter bubble . . . 33
6.2.1 Motivation and Scope . . . 33
6.2.2 Proposed Method . . . 34
6.2.3 Prototype . . . 34
6.3 Diversify user’s content-consumption using recommendation . . . 37
6.3.1 Motivation and Scope . . . 37
6.3.2 User and Content Topic Modelling . . . 37
6.3.3 Examples: ideological position of content for each topic . . . . 38
6.3.4 Proposed Method and Prototype . . . 40
6.3.5 Future extension - Next Generation Social Networks. . . 41
7 Discussion 43 7.1 Conclusions . . . 43
7.2 Implications to future research . . . 43
1.1
Motivation and Scope
Social media and the web was envisioned with the goal to encourage and provide diverse and unreachable information around the world to users with ease. However, over the past few years, various factors such as design of social networks, algorithmic filtering of content (e.g., news feeds, recommendations), have narrowed the content that a user sees and consumes. Recent studies on US presidential elections have shown that the content viewed by Republican and Democratic voters was very different. For instance, imagine two users of opposite ideological stances (sayliberal
and conservative). The two users may be looking at the content on the same topic
(presidential debate), however what they see can be of completely different viewpoints.
Consequently, each user lives in their own information bubble, oblivious to the views on the other side, creating their own world-view of truth. This has led to social phenomena like polarization of point-of-view and intolerance towards opposing views. Especially for controversial topics, this phenomenon has led to ideological segregation. Studies suggest that over the years users will increasingly live in their echo chambers [31]. In the book Sunstein [35] the author discusses the threat that these phenomenon will pose to open democratic processes. Recent events like US Elections and BREXIT are excellent examples of it.
Here after we refer to this phenomena where users get less exposure to conflicting viewpoints and are intellectually isolated in their own informational bubble as “filter bubble”, a term coined by Pariser [29]. Further, we call this tendency of a user to view content of certain viewpoint more than the other viewpoint as bias. The cause for this bias can be two folds (i) The user by himself prefers content from one viewpoint over another, i.e., “user bias” (ii) various set of algorithms on web, for instance, recommender, structure of social network, search engines together impose the filter on the user, i.e., “imposed bias”. Let us elaborate with an example. Consider a user who is interested in a certain topic exploring the web. The content that the user sees/consumes is hugely influenced by a variety of online systems and technologies such as social networks, recommendation systems and information retrieval engines. (i) Social networks - The presence of “homophily” in user’s social interactions and
social links, when combined with selectively filtered social feed from ideologically similar users would largely expose the user only to the content that confirms with his ideology (ii) Recommender systems - Recommender systems optimize to suggest content that a user is likely to consume based on the history of the user, a criteria that further contributes to the filter bubble. As a consequence, recommendation systems that the user would be exposed to would further recommend content that agrees with user’s historical viewpoint. (iii) Likewise, search engines preferentially rank results based on users content consumption history and other factors that further adds to the ideological bias in the content consumed by the user.
This research focuses on using data mining techniques to study information filter bubble on twitter. We aim to uncover an ideological latent space which would help us understand the ideological stances of twitter users and their association with news
sources. Our goal is to use this ideological latent space to collectively address two problems that are central to tackling the problem of information filter bubble (i) how can we make the users aware of their own information bubble (ii) how can we diversify the content that they consume. To this end we start with the following preliminary research questions
• RQ1: First, is there any ideological polarization of users and content on Twitter? • RQ2: Can we use Twitter information (such as tweet, re-tweet and follows) to
estimate ideological leaning of users and content?
• RQ3: How can we this estimated Ideological Leaning of users and content on Twitter to diffuse the information filter bubbles?
1.2
Literature
In the recent times there has been an increased interest in tackling the problem of information filter bubbles. Wall street journal developed a user interface [2] to raise awareness of the difference in view points by presenting side-by-side articles from
blue feed and red feed. Multiple browser extensions have been created to remind user
of the imbalance of reading [28]. Escape your bubble [3] is a browser extent which
adds manually curated event from the other side to a users news feed.
There has also been some attention from the research community to reduce the information filter bubble [34] [33]. Several studies have been carried out to show the existence of filter bubbles online [6] [10] and the negative effects caused by filter bubbles [21] [35]. A large body of research work has studied and quantified the filter bubble [10] [27] [15] [5] [39].
Recently there have been a few attempt to reduce this polarization, specially in the direction of exposing users to opposing viewpoints. Much of the work in this area focuses on “how” to recommend content from the opposite side by designing interfaces and user surveys [19] [28] [30] [16]. Garimella et al. [17] propose to reduce the polarization by recommending content from opposite side to users. In their work they focus on the problem of “who” to recommend by modeling user’s “acceptance” probability using a random walk based approach. We observe that “what to recommend” is largely an open problem. We believe it would be interesting to tie the problem of “what to recommend” and “who to recommend” and holistically address the problem in an algorithmic way.
Further, most of the work in the literature focuses on only two-sides of a con-troversy. They aim to separate the user into two ideological clusters - liberal and conservative and focus onhow to recommend content to theopposite side. However,
learning a binary stance, is hugely undermining the problem. In a real world, users do not have binary ideologies, instead each user has a degree to which he confirms to a certain ideology. Knowing this ideological position is critical to answer two important questions (i) “who”(user) to recommend (ii) “what”(content) to recom-mend. For instance, one can imagine that, it would be easier for an extreme user to look at neutral content and perhaps even absorb some of the information. On
the other hand, exposing an extreme user to ideologically extreme content from the other side can further increase the polarization [19]. Likewise, identifying a neutral user can be fruitful in connecting the two ideologically separated sides. For example, these neutral users, who are part of the conversation in both the ideological clusters can be very helpful in relaying the information between the two clusters and bridging the information gap. Further, studies have shown that neutral users are
easier to nudge and it is more likely that a content from the opposite side would be consumed by a neutral user [25]. Hence it is not sufficient to separate the users into ideological clusters. In order to make any meaningful recommendations we need to estimate the position of a user on a continuous ideological scale so that appropriate recommendations can be made to diversity the content.
1.3
Research questions
Having considered the open problems in the literature we revisit the research questions that we initially started with. RQ1 has been extensively studied and addressed in
the literature. However RQ2 and RQ3 seem very promising especially in the light of
(i) the value in learning the ideological position of users and sources on a continuous scale (ii) the possibility to tie the problem of “what” and “who” to recommend and learn the two simultaneously. Interestingly, if we consider “what” as the content to be recommended and “who” as the user to recommend to, we can model this as a problem to learn ideological stance of both users and sources simultaneously. With the new found motivation, we reformulate our research questions as follows:
• RQ2: Can we use Twitter information (such as tweet, re-tweet and follows) to estimate a continuous ideological score for both users and content in a unified formulation?
• RQ3: How can we this estimated ideological leaning of users and content to diversify the content consumed by a user by tying together “who” and “what” to recommend?
1.4
Contributions
To answer the first question (RQ2), we use public twitter data to uncover Twitter users’ and popular news media channels’ ideology. We collect 19 million tweets over a span of 5 years from 2011 to 2016. For our study, we filter tweets from 559 popular news media outlets about 3 controversial topics – Obamacare, Gun Control and Abortion. We represent the tweets as a matrix where one dimension is the user and the other dimension is the source (news media channel) of the tweet. The other input to our algorithm is the adjacency matrix on the social graph of users. Given these two inputs our matrix factorization based algorithm uncovers the underlying multidimensional ideological latent space in Twitter of both users and sources at the same time. We use this ideological latent space to compute the ideology scores for users and sources.
In order to address the second question (RQ3), we present two case studies. First, we call for raising the awareness of social network users by providing visual, explanatory and exploratory evidence of their own information filter bubble. We provide an interactive platform to the users to explore their own content consumption bias (user as well as algorithmic). Thus, we lower the barrier for understanding an information filter bubble for users without any domain knowledge. Second, we present preliminary work to increase the diversity and transparency of user’s content consumption by discussing two possible solutions of (i) incorporating the learnt latent space of user and source in the recommendation system itself and (ii) designing exploratory and interactive interfaces for the users to explore the content and self-adjust diversity of their content consumption.
1.5
Outline
The rest of the thesis is organized in the following chapters.
Chapter 2 is an introductory chapter, which presents some of the terms and methods which are central to the thesis. This chapter introduces the reader to Twitter terminology, social science terms used in the thesis and presents an overview of non-negative matrix factorization.
In Chapter 3 we introduce the reader to definitions and notations, and formulate the problem from a mathematical standpoint.
In Chapter 4 we build on the problem formulation described in chapter 3 and present an end-to-end framework to compute ideological leaning for users and sources.
Chapter 5 details experimental setup, baseline algorithms, evaluation measures and analysis of results.
In Chapter 6 we present two case studies and prototypes on how the ideological scores learnt in chapter 4 can be used to reduce the information filter bubble.
Finally in Chapter 7 the topics covered in introduction of the thesis are summarized and main conclusions are discussed.
2
Background
This chapter is a review of the data mining, machine learning and social science methods and terms most central to this thesis.
2.1
Terms and Definitions
In this section we list and define commonly used domain specific terminology. 2.1.1 Information Filter Bubble
The term filter bubble was coined by Pariser [29]. It is defined as the phenomena where users get less exposure to conflicting viewpoints and are intellectually isolated in their own informational bubble. As mentioned earlier in Chapter1, social networks, personalization algorithms such as recommendation systems, and search engines directly or indirectly impose many layers of filters on the content that a user can see on the Internet. These filters, when combined with the users’ information bias and preferences, leads to the scenario where users are effectively separated from the information that disagrees with their viewpoints, consequently isolating them in their own ideological filter bubbles. In the recent studies many terms have been used synonymous to the term “filter bubble”, for example, “echo chambers”, “ideological silos”. Other terms such as “ideological polarization”, “ideological segregation” and “controversy” are also closely related to filter bubble, in the sense that they can be
seen as the consequences of the information filter bubbles.
2.1.2 Twitter Terminology
Twitter is a social media platform where the core of the platform is an element called
Tweet. A Tweet is a 140 character long public post which can be seen by any one on
Twitter. A tweet typically contains some text, and in some cases a link to an external URL (content). Users on the platform have three types of interaction options to connect with other users: follow, retweet and user mention.
– Every Tweet is open for all Twitter users to read, comment and to re-post, such a rep-post is call aretweet. Typically a retweet represents endorsement of the
content mentioned in the tweet. However, in some cases it could represent a different justification, for instance, someone making fun of the post or criticizing the post.
– Followsis a directed relationship where a user subscribes to view content (tweets)
posted by another user. It is a popular notion that the follows relationship between users represents ideological similarity. However, in some cases one could follow a person from the opposite camp so as to be informed about what is happening (e.g., a lot of Democrats follow Trump)
– In a user mention, a Twitter-user tags another Twitter-user usually to discuss
Since it is challenging to determine if a user mention indicates an endorsement or contention, in our thesis, we do not use user mention to derive ideological relationship
between users.
In this thesis we focus on two kind of data types in Twitter : (i) Twitter-users and (ii) Twitter content.
Twitter users are the set of users who use the social platform Twitter. For the purpose of this thesis we call the set of Twitter users collected in the dataset asusers.
The primary content on Twitter is a tweet, as mentioned earlier, many of the
tweets contain an external URL. We refer to the set of extent URLs tweeted byusers
ascontent, and the set of news media channels which are the author of the content
assource. That is, asource is the hostname extracted from the content URLs.
2.2
Overview of NMF
Non-negative Matrix Factorization (NMF) [23] has attracted a lot of attention in the last decade in machine learning and data mining, especially in the context of clustering due to its ease of interpretability. In this section we provide a comprehensive overview of NMF methods for clustering.
2.2.1 NMF for Clustering
Given an input matrix of the form X ∈Rn×m, we seek to factorizeX into two latent factors,
X ≈U VT (1)
where U ∈Rn×k and V ∈
Rm×k are non-negative matrices, andk is the number of
clusters defined in the clustering.
When NMF is applied for clustering, each row in X is treated as a data point
in an N dimensional space. In such a case, the factorsU and V have the following
interpretation:
• Uij corresponds to the degree to which row i belongs to cluster j
• Vij corresponds to the degree to which columni is associated with cluster j with appropriate normalizations, Vij is proportional to the posterior probability of clusterj given column i.
Our goal is to findU andV to minimizeJ. The most common cost function used
for the minimization of the objective function is thesum of square errors. In this thesis, we assume the matrix norm to be the Frobenius norm.
J = min
U≥0,V≥0JkX−U V
Tk2
F (2)
2.2.2 Equivalence between NMF and K-Means
An equivalence between NMF sum of square error optimization with orthogonality
constraints and K-Means was proven by Ding et al. [11] where they show that
J = min
U≥0,V≥0JkX−U V
Tk2
F s.t. V V
is equivalent to K means clustering,U has the meaning of cluster centroids andV is
equivalent to cluster indicator matrix. 2.2.3 Co-clustering
NMF seeks one-sided clustering of either rows or columns of the input matrix. However, for many real-world applications we seek to infer both row and column clusterings simultaneously, as well as the association between the row and column clusters. For instance, a typical document clustering problem involves two different data types documents and terms. In such a clustering problem we seek to
co-cluster both documents and terms simultaneously by leveraging the dual relationship between the two data types.
2.2.4 NMF with Tri-Factorization (NMTF)
NMTF [12] provides a good foundation to perform co-clustering. In NMTF our goal is to simultaneously cluster rows and columns of the input matrixX. NMTF seeks a
3-factor decomposition of matrices
X ≈U HVT (4)
where U ∈Rn×`,H ∈
R`×k andV ∈Rm×k are non-negative matrices l is the number
of row clusters andk is the number of column clusters defined in the clustering.
More precisely, we solve the optimization problem with dual orthogonality con-straints J = min U≥0,H≥0,V≥0kX−U HV Tk2 F s.t. U U T = I, V VT =I (5)
where U is the row coefficient matrix which gives row clusters andV is the column
coefficient matrix which gives column clusters. H provides the association between
row and column clusters. It provides additional degree of freedom and allows accurate clustering of both rows and columns simultaneously.
2.2.5 Symmetric Matrix Factorization
Symmetric matrix factorization is a special case of non-negative matrix factorization in that the input to the factorization is a matrix of pairwise similarities: X =XT. As a consequence the row and column latent factors are the same U = V. The
symmetric NMF optimization is: min
U≥0,H≥0,V≥0kX−U HU
Tk2
F, s.t. U U
T =I (6)
Given the input X as the adjacency matrix of a Graph, it is well known that
the matrix factorization in Equation (6) is equivalent to Normalized Cut spectral clustering [11] [37].
2.2.6 Graph Regularization
Cai et al. [9] proposed a graph based approach on NMF called Graph regularized Non-negative Matrix Factorization (GNMF) that considers geometric structure in the data. In their paper, they encode the geometric information in the form of an affinity graph and seek a matrix factorization, which respects this graph structure. That is, if two points are connected in the affinity graph these two data points should be sufficiently close to each other in the matrix factors. They refer to this assumption asmanifold assumption and formulate it as follows:
1 2
X
i,j
kui−ujk2(Wv)ij = tr(UTLuU) (7) whereWu is the affinity graph defined for the nodes inG,Lu =Du−Wu is the graph Laplacian on the affinity graph Wu,Du is a diagonal degree matrix of Wu such that
Du = N P j=1(
Wu)ij.
The new matrix factorization (GNMF) incorporates the graph structure into its objective function as follows:
J = min
U≥0,V≥0kX−U V
Tk2
F +α·tr(U
TLuU) (8) where tr(·) denotes the trace of a matrix, Lu is the graph laplacian on any adjacency matrix consisting of rows of X,α is a regularization parameter and the
term tr(UTLuU) is called the graph regularization constraint, which captures the
geometric structure in the input data.
Gu and Zhou [20] proposed a Dual manifold regularized co-clustering method (DMCC) based on the duality between rows and columns of the co-clustering matrix, which imposes manifold regularization on both rows and columns of input matrix, i.e., it considers geometric structure on both the row and column manifolds. For an input matrix X, DMCC has the following objective function
J = min
U≥0,H≥0,V≥0kX−U HV
Tk2
F +α·tr(U
TLuU) +β·tr(VTLvV) (9) where tr(.) denotes the trace of a matrix,H reflects the association between rows
and columns of X,α andβ are regularization parameters, Lu is the graph laplacian on any adjacency matrix consisting of rows of X andLv is the graph laplacian on any adjacency matrix consisting of columns of X.
3
Problem Formulation
3.1
Motivation
The main premise of this thesis is that the tweet and retweet behavior of a user on Twitter is consistent with his liberal-conservative ideological leaning.
A simple approach to identify ideological leaning of a user is to treat user inter-actions/relationships as a social graph or adjacency matrix. One could then apply any of the graph partitioning algorithms to detect communities of users. However, relying meagerly on user relations has two major problems: (i) In general, in any of the real world social networks such as twitter, the number of user connections is much lower than the number of total users. As a consequence, the underlying graph is highly sparse. (ii) Clustering which depends only on links between users ignores one fundamental assumption of ideology clustering, i.e., users who are similar to each other should be in the same cluster. Consider two usersu1 andu2 who have
the same ideology and share similar content. However, they do not know each other and have no social relationship. We would still like the usersu1 and u2 to be in the
same cluster even if they do not have any relations between them.
For community detection of sources, one simple approach is to consider sources as individual entities and perform NLP-based semantic and sentiment analysis techniques on the content information to identify source clustering. However, this approach is complex and prone to errors due to the noise in the data. Another approach is to construct a link graph between sources based on their similarity (e.g., the number of common users/shares/clicks etc). However, this approach still ignores the rich user link information.
Therefore, combining the two types of input to collectively learn the communities of sources and users may be a better strategy. Furthermore, all these techniques only have one sided clustering of either user or content, with no association between them.
Thus, our motivation in combining sources of information is many-fold: (i) It allows us to learn collectively from two different types of input. Clearly, clustering with increased information will result in better clustering performance. (ii) It allows simultaneous learning of the two types of clustering in a unified seamless approach. (iii) Furthermore, a shared latent space keeps the dual interconnected relationship
between users and sources intact. That means, not only do we want to separate users and sources into ideological clusters, we would also like to know the relationship between the two clusterings. Simultaneous clustering with shared latent variables provides an explicit and compact representation of both ideological clusterings of user and sources as well as the relationship between them.
3.2
Summary
Given a Twitter user’s social link information (re-tweet and follows) and content creation/consumption (tweet and re-tweet) information, we can construct a social matrix (user ×user) and an associated bipartite content matrix (user ×content).
such that knowledge of user interactions in the link matrix can be transferred to content clustering, and knowledge of user-content interaction from content matrix can be transferred to user clustering.
Many techniques have been proposed to learn the latent space in input data. Non-negative Matrix Factorization (NMF) is one of the most popular techniques due to its ease of interpretability and performance. In this work, we propose a joint matrix factorization formulation, which exploits the duality between user and source clustering. We learn a shared ideological latent space using iterative multiplicative update rules to solve the optimization problem.
In the proposed technique, both the user’s social link information as well as his/her content information are seamlessly combined in a unified approach with a set of shared latent factors. Our model contains two latent factors.
The first component (which we later refer as U) captures the user information.
That means, information about users is decomposed into latent user × ideology
factors where the rows of the matrix represent the degree to which each row ID (user) belongs to the said column (ideology) cluster.
The second component of the factorization (which we later refer as V) represents
the source ideology factors. Sources are decomposed into latent ideology× source
factors. The column vectors represent the degree to which the said column belongs to the row cluster. The bridge latent factor (H) of sizek×k, where k is the number
of latent dimensions, captures the association between the corresponding row and column clusters. For instance, if the H matrix is close to an identity matrix, the
diagonal of the matrix suggests that there exists a pairwise association between corresponding row and column clusters.
We connect the two components (U and V) through a shared set of latent
factors by modeling the problem as a joint factorization problem (on social link graph and user-content information) and tying the latent factors in the two matrix
decompositions. As a consequence, the optimization problem simultaneously and seamlessly searches for a shared latent space for both the components that best explains both link and content structure.
3.3
Definitions and Notations
Suppose we have a social graph of twitter users, G= (V,E, w), where V ={xi}Ni=1
represents the set of users,E is the set of edges representing social interaction between
the users and w is the set of edge weights. The adjacency matrix of links between
users associated to the graph G is denoted by A ∈ Rn×n. For a pair of nodes x i and xj, A(i, j) =w if there is an edge between xi and xj, and A(i, j) = 0 otherwise. Note that in this definition, A may be either symmetric of non-symmetric based on
the underlying graph G. Each node xi ∈Ghas a set of associated content features denoted as Ci ={Cij}mj=1, where the feature set represents the content on Twitter.
Thus, the bipartite content matrix associated to the graphGis denoted asC ∈Rn×m. We derive the edges in Gfrom social links between users based on their re-tweet
and follows network. Specifically, we experiment with two variants: For a pair of users ui anduj, there is an edge e= (ui, uj, w) (i) ifui and uj follow a common set
Table 1: Notations used in this thesis and their corresponding explanations and dimensions
Notations Details Dimensions
G endorsement graph
-V set of users
-E set of directed edges
-w set of edge weights
-n number of users
-m number of sources
-k number of clusters
-A user-user social matrix associated to graph G n×n
C user-source contant matrix n×m
U user-cluster matrix n×k
V source-cluster matrix m×k
H1 cluster association matrix for user k×k
H2 cluster association matrix for source k×k
Lu graph laplacian matrix for user n×n Lv graph laplacian matrix for source m×m
α, β parameters to control influence of graph regularization
-tr(·) trace of a matrix
-k.kF frobenius norm
-of users, andw is the size of intersection offollows, or (ii) if ui retweets uj, then wis the number of retweets. We derive the content features in C associated to the graph G based on users’ tweets. Specifically, we experiment with two variants of feature
sets: (i) extracted urls from the tweets and (ii) hostnames of urls extracted from the tweets. Therefore, the content is aggregated by their source of authorship (i.e., various news media channels).
3.4
Problem Description
Given a social matrix A and a content matrix C, we would like to consider the
following constraints in order to determine the user and source ideology clusters: Partitioning constraints: We want to take into account the network structure in the link matrixA as well as the user-content information in the bi-partite content
matrix C in order to partition the users and content into ideology clusters such that
the following constraints hold true:
1. Users in a user cluster interact with each other more often than outside the cluster.
2. Users in a user cluster consume content which is more similar to the content consumed by within cluster users than with users outside the cluster.
Co-partitioning constraints: We want to identify the association between the resulting user and source partitions so that
3. users in a user partition share more articles from their corresponding content partition than from other content partitions.
4. content in a content partition is shared by more users from their corresponding user partition than from other user partitions.
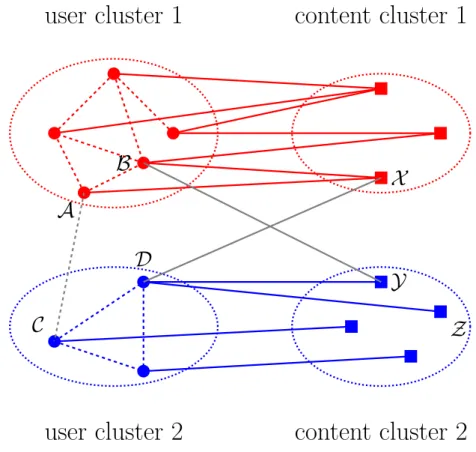
user cluster 1
user cluster 2
content cluster 1
content cluster 2
A
B
C
D
X
Y
Z
Figure 1: Pictorial representation of the partitioning and co-partitioning constraints. As per the constraints discussed in Section 3.4, users A and B belong to the same
user cluster and their shared contentX is in the corresponding content cluster. Users C and D belong to the same user cluster and contentY and Z in the corresponding
content cluster.
3.5
Problem Formulation
We derive our problem formulation for learning ideological space in multiple steps: (i) We present the basic non-negative matrix factorization model for co-clustering of users and content. (ii) We derive the latent factorization model for combining Link and Content as well as for learning a shared latent space. (iii) We summarize the
co-partitioning criteria described in Section 3.4 as geometric manifold constraints and encapsulate them in the model by adding graph regularization constraints. (i) Non-negative Matrix Factorization for Co-Clustering: For a given input
data matrix X, the bi-orthogonal non-negative 3-factor decomposition (ONMTF)
introduced by Ding et al. [12] provides a good framework for simultaneously clustering the rows and the columns of theX. The rows of the latent factor matrix U provide
clustering of users while columns of latent factor matrix V provide article clustering.
The cluster association matrix H absorbs the difference in scales of X, U and V
and provides additional degrees of freedom. The presence of H ensures that the
low-rank matrix representation remains accurate, while U gives row clusters and V
gives column clusters.
X uU HVT (10)
With the notation and formulation used above, the co-partition detection problem in this thesis is formally defined as follows
Problem 1 (ONMTF [Ding et al. [12]]) Given a bi-partite user-source input matrix
C of dimension n×m. Find non-negative matrices U and V of dimensions n×k
and m×k respectively such that we minimize
J1 = min
U≥0,H2≥0,V≥0
kC−U H2VTk2F (11)
s.t. U UT =I, V VT =I, (12)
where k.kF denotes the Frobenius norm.
An important special case is when the rows and columns of input matrix are indexed by the same set of objects. In our case, the links in the rows and columns of the user-user link matrixAbelong to the same objects(i.e., users). Hence, we can re-write U =V =U in Equation (11) J2 = min U≥0,H1≥0 kA−U H1UTk 2 F (13) s.t. U UT =I (14)
Note that H1 is not necessarily symmetric. That means, U H1UT can produce
non-symmetric matrix, which is the case ofA (user-user social link matrix) in our case.
Furthermore, an important advantage of this form of tri-factorization is that it captures link transitivity [42]. Consider a transitive link ui →us→uj between ui and uj, where the user ui is linked touj via us. A non-symmetric factorization of the form AuZUT treats the values in input matrixA as links from set of users to a different set of objects, let it be denoted byO ={oi}. Hence it would split the link path (ui →us→uj) into two partsui →osandus →oj which is a misinterpretation of the original link path. Whereas, AuU H1UT considers the links to be amongst
the same set of objects. Hence, the transitive linkui →us →uj is correctly captured by latent factors in U.
(ii) Combining Link and Content: The basic assumption in combining multiple input datatypes is that the input matrices may share common knowledge structures
which can be captured by a common shared latent space. We aim to learn a common ideological latent space shared by both users and content, so that knowledge of user interactions in the link matrix can be transferred to content clustering, and knowledge of user-content interaction from content matrix can be transferred to user clustering. Zhu et al. [42] proposed an algorithm to classify web-pages by exploiting both content and link information of the web-pages. They carry out a joint-factorization on both the link adjacency matrix and the document-term matrix. By mapping both types of information onto a common low dimensional latent space, they derive a low-dimensional latent representation for web-pages, without explicitly separating them as content and link factors. Inspired by this idea, we aim to combine the information from both the data-types, i.e., link information (A) and content
information (C).
With the motivation defined above, the problem of combining link and content information in A and C, as well as the simultaneous partition detection of user and
source can be written as a natural extension to Problem 1. We formally define the problem as follows:
Problem 2 Given a user-user social matrix A of dimension n×n, and a bipartite user-source content matrix of dimensions n×m, find non-negative matrices U and
V of dimensions n×k and m×k respectively such that we minimize:
J3 = min
U≥0,H1≥0,H2≥0,V≥0
kA−U H1UTk2F +kC−U H2VTk2F (15)
s.t. U UT =I, V VT =I (16)
where tr(·) denotes the trace of a matrix, U and V represent the learnt factors for users and content respectively in the ideological latent space.
In Equation (15) we carry out a joint factorization on both user-user link matrix (A)
and user-article content bi-partite matrix (C). In order to learn a common ideological
latent space for both users and articles, we tie the latent factor U in Equation (13)
with the latent factor U in Equation (11).
(iii) Graph Regularizations: The formulation for clustering in ONMTF fails to consider the geometric structure in the data, which is essential for clustering data on manifold. To address this problem Cai et al. [9] introduced graph regularized NMF based on themanifold assumptionthat, if two data points xi,xj are close in the intrinsic geometry of the data distribution inX, then the representations of this two
pointsui and uj in the new basis U are also close to each other. This is formulated as follows, 1 2 X i,j kui−ujk2(Wv)ij = tr(UTLuU) (17) whereWu is the affinity graph defined for the nodes inG,Lu =Du−Wu is the graph Laplacian on the affinity graph Wu,Du is a diagonal degree matrix of Wu such that
Du = N P j=1(
Wu)ij.
Gu and Zhou [20] proposed a Dual manifold regularized co-clustering method based on the duality between rows and columns of the co-clustering matrix which
imposes manifold regularization on both rows and columns of input matrix, i.e., for an input matrix X J = min U≥0,H≥0,V≥0kX−U HV Tk2 F +α·tr(U T LuU) +β·tr(VTLvV) (18)
where H reflects the association between rows and columns of X. Lu is the graph laplacian on any adjacency matrix consisting of rows of X and Lv is the graph laplacian on any adjacency matrix consisting of columns of X.
We extend the Problem 2 to include dual graph regularization constraints on users and sources. At the end, the co-partitioning problem of users and sources on an ideological plane is defined as the joint non-negative matrix tri-factorization with bi-orthogonality constraints and dual graph regularization constraints. We formally define the final problem as follows:
Problem 3 Given a user-user social matrix A of dimension n×n, and a bipartite user-source content matrix of dimensions n×m, find non-negative matrices U and
V of dimensions n×k and m×k respectively such that we minimize:
J4 = min U≥0,H1≥0,H3≥0,V≥0kA−U H1U Tk2 F +kC−U H3VTk 2 F (19) +α·tr(UTLuU) +β·tr(VTLvV) (20) s.t. U UT =I, V VT =I (21)
whereA and C are input matrices, U, V, H1and H3 are non-negative latent factor
matrices, α and β are parameters to control the influence of user and source affinity graphs Lu and Lv in the joint factorization.
This formulation factorizes A and C jointly based on the dual manifold assumption
i.e., both users and content share the same latent space and the cluster labels of users are smooth with respect to the content manifold, while the cluster labels of content are smooth with respect to user manifolds. In order to apply manifold constraints, first, we construct affinity graphs for users Wu (and content Wv). While there are many ways to construct such an affinity graph, in our experiments we construct Wu (and
Wv) as cosine similarity matrix on row vectors (and column vectors) of the content matrix C. We then construct their corresponding graph Laplacian matrices Lu (and
Lv), such that they capture the geometric structure of data manifold (and feature
manifold). Next, we encode this geometrical information in the joint factorization model in Equation (15) in the form of graph regularization constraints. We then seek a matrix factorization that respects this graph structure.
3.6
Optimization Problem
In this section we solve the optimization problem and derive multiplicative update rules.
3.6.1 Optimization problem
Following the standard theory of constrained optimization, we solve the following optimization problem in Equation (3) by introducing Lagrangian multipliersλ (a
symmetric matrix of size K×K) and minimizing the Lagrangian function L= min U≥0,H1≥0,H3≥0,V≥0kA−U H1U Tk2 F +kC−U H3VTk 2 F (22) +α·tr(UTLuU) +β·tr(VTLdV) (23) +tr[λ(U UT −I)] +tr[λ(V VT −I)] (24)
3.6.2 Derivation of update rules
We can compute the gradient of L with respect to U,V,H1 and H3. The optimal
solution to the optimization in Equation (22) can be achieved using an iterative update algorithm proposed by Ding et al. [12]. The update rules are as follows:
U ←U · v u u t AU HT 1 +CV H3T +α·SuU U H1UTU H1T +U H3VTV H3T +αDuU +U λu (25) V ←V · s CTU H 3+β·SdV β·DdV +V H3UTU H3 +V λv (26) H1 ←H1· s UTAU UTU H 1UTU (27) H3 ←H3· s UTCV UTU H 3VTV (28) where λu =UTAU H1T +U TCV HT 3 −αU T ·L uU −H1UTU H1T −H3VTV H3T λv =VTCTU H3−βVT ·LdV −H3UTU H3
4
Methodology
4.1
Summary
In this section, we present the proposed NMTF based end-to-end framework for estimating Ideological leaning for Twitter users and Media channels. The core of the proposed method is the NMTF based optimization problem to learn the latent factors discussed in Chapter 3. Next, we utilize the probabilistic model of NMF factorizations discussed in Yoo and Choi [40] to derive a probabilistic interpretation of our latent factors. Finally, we present how these latent factors can be used to infer ideological leaning of Twitter users and Media Channels.
The most interesting contribution of this section is how a continuous score of ideological leaning of Twitter users and Media Channels can be inferred from open Twitter data. For the sake of completeness, we also show how a hard cross-ideological separation (hard clustering) can be derived from the latent factors.
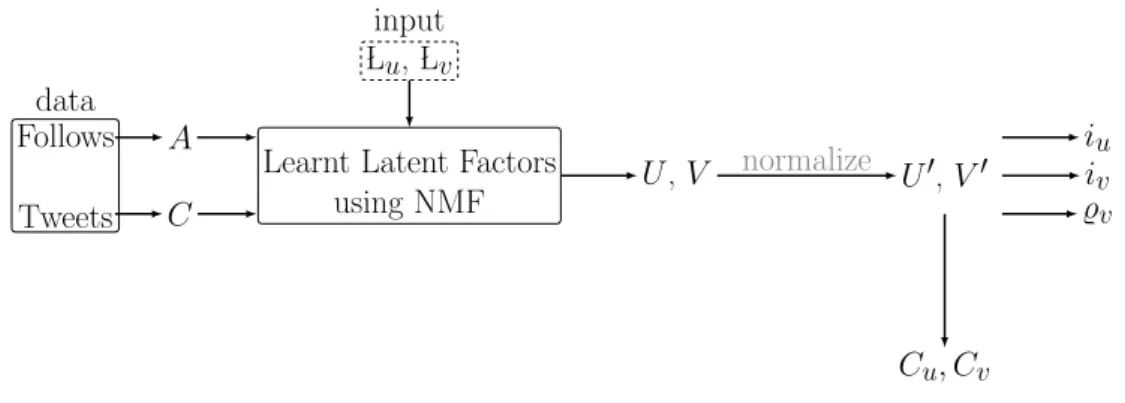
4.2
Learning Ideological Latent Space
Figure 2 presents a logical flowchart of all the steps involved in learning user and source ideology scores. First, we combine user’s social link information and their content consumption information, and learn a shared ideological latent space by applying the NMTF based latent space model discussed in Chapter 3. Next, we normalize the factors to derive probabilistic interpretation of the factors. We then transform these latent factors to compute ideology and popularity scores. The details about these components are presented in the following sections.
Follows Tweets data
A C
Learnt Latent Factors using NMF Lu, Lv input U,V U0,V0 iu iv %v Cu, Cv normalize
Figure 2: Flowchart of Proposed Methodology
4.3
Probabilistic Interpretation of Latent Factors
The latent factors (U,V) learnt from this factorization have a probabilistic
interpre-tation as follows:
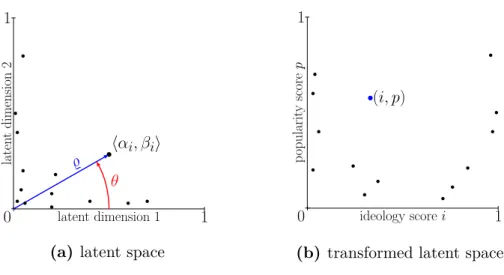
latent dimension 1 laten t dimension 2 0 1 1 hαi, βii % θ
(a) latent space
ideology scorei p opularit y score p 0 1 1 (i, p)
(b) transformed latent space Figure 3: Projection of data points
– Vij corresponds to the degree contentvi is associated with content-cluster{cv}j. With appropriate normalization as proposed in the literature in (Yoo and Choi [40]) & (Li and Ding [24]), Uij is proportional to a posterior probability of user-cluster
{cu}j given user ui, and Vij is proportional to a posterior probability of content-cluster {cv}j given content vi. In our case, the graph regularization constraints in our factorization separate the clusters byliberal-conservative ideological similarity.
Since we have set the number of latent dimensions to 2, the factorsUij and Vij are proportional to the posterior probability of belonging to liberal and conservative
clusters.
4.4
Projecting Latent Factors
Say, αu and βu represents the two column vectors of U and αv and βv represents the two column vectors of V. We plot the data in the subspace of the two column
vectors α and β such that each data point (αui, βui) represents a user in the user
ideological latent space, each data point (αv i, βv i) represents a content in the content
ideological latent space and each axis corresponds to a cluster. This model has a
simple visual interpretation:
(i) All the data points belonging to the same cluster are located close to the axis. It is clear that the cluster label for a data point can be determined by finding the axis with which the data point has the largest projection. Extending the idea, if we consider each data point as the posterior probability vectorhαv i, βv ii, (i) The data point belongs to the axis with which it has the least angle (ii)
say x-axis (0◦) corresponds to
liberal cluster and y-axis (90◦) corresponds to conservative cluster. We could calculate a normalized ideology score in range 0
(liberal) - 1 (conservative) as the normalized angleθ of the posterior probability
vector hαv i, βv ii
i= arctan(
βi αi)
(ii) The position of the data point on the axis is proportionate to the strength of its value in the latent matrix. Since the latent matrix is meagerly a factorization of the input matrix, this value is directly correlated to the value in the input matrix, i.e., the user’s engagement on Twitter (retweets and follows) and the sources popularity on Twitter (number of tweets containing the source). Therefore, the magnitude % of the posterior probability vector hαv i, βv ii is equivalent to the popularity (engagement on Twitter). Thus, the normalized popularity/engagement score can be derived as
%=
q
αi2+βi2 (30) Figure14 visualizes the data points projected in the original latent space and their transformation to the corresponding ideology/popularity co-ordinate space. It is interesting to note that, in our quest for uncovering “ideology” of users and source, “popularity” was a dimension we discovered serendipitously. However, it is easy to
understand the reasoning behind it. The valueCij in the input matrixC captures the number of tweets tweeted by i-th user that were authored by j-th source. A popular
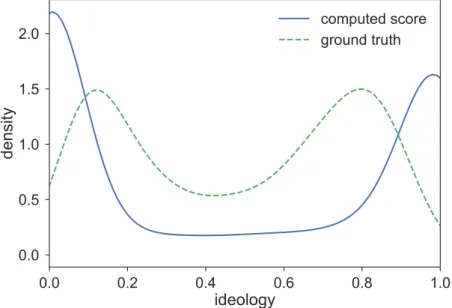
(highly tweeted) source would thus have a dense column with large magnitude in the input matrix which would be reflected by larger magnitude in the corresponding latent factorization. In order to validate if the dimension indeed captures the popularity of a source, we compute ground of popularity score for each source using the number of tweets that contain the source as a proxy for its popularity. We observe that there is a pearson correlation coefficient of 0.9 between the estimated popularity score from
the latent space and the computed ground truth.(details follow in Section 5) While “popularity” is an accidentally discovered dimension, it is an extremely interesting dimension to address the problem of reducing filter bubbles. Garimella et al. [17] suggest that highest reduction in user-polarization score is achieved by connecting a user with authoritative source with the opposing view. That is, maximum reduction in user-polarization happens when a user is recommended “popular” content from the opposing viewpoint. The intuition behind the idea is that this way the user can see the “popular” notion on the other side, and presumably the “popular” content is usually of good quality. We do not investigate further in this direction as it is out of the scope of this thesis. However, we use the dimension “popularity” in the case studies presented in Section 6.
5
Experiments
In this section we present a set of experiments on real world datasets to validate the effectiveness of our NMF based ideology learning technique. In our experimental evaluation our focus is to evaluate the computed ideological scores as well the ideological cluster separation for users and sources.
5.1
Dataset collection and processing
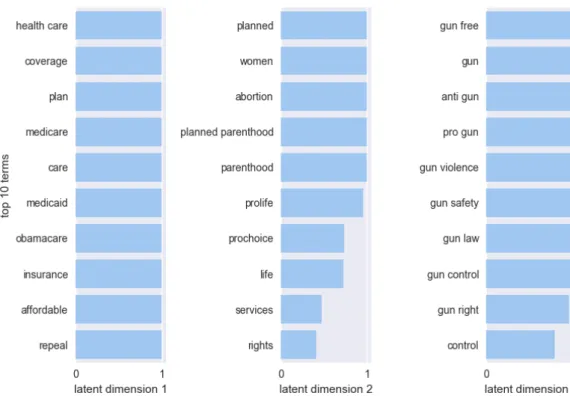
The dataset that we use is collected using Twitter’s streaming API (random 1% sample) from 2011 to 2016. We selected three popular controversial/polarized topics on Twitter which discussed by a large number of Twitter users with both opposing sides of ideology: “gun control", “abortion" and “obamacare". We collect all tweets (and their corresponding users) related to these topics by filtering based on topic-related hashtags and related keywords [26]:
– gun control: gun control, gun right, pro gun, anti gun, gun free, gun law, gun safety, gun violence
– abortion: abortion, prolife, prochoice, anti-abortion, proabortion, planned parenthood
– obamacare: obamacare, #aca
Due to the 1% random sample given by Twitter API our dataset for users was quite sparse. Majority of the users tweet once or twice. In order to negate this problem, and have a meaningful dataset we filtered the set of users for which we had decent amount of twitter activity. To this end, we obtained all users who had tweeted on all the three topics. This gave us a set of 6391 users. We then collected all the tweets of these 6391 users. Note that due to twitter API restrictions we could collect up to 3200 tweets for each user.
Since our goal is to be able to identify ideology of both the user as well as the source, we filter the tweet set to contain only tweets from well known news media channels in the US region. For this purpose we aggregate a set of 559 news domains (and their shortened url versions) obtained from previous work in the literature [7][14][18]. Fortunately, we could also collect annotated information about these 559 sources (details follow), which we used as the ground truth for evaluating our methods.
5.2
Constructing input matrices
The proposed technique requires four input matrices namely 1. Social link matrix A of size n×n
2. Bipartite content matrix C of size n×m
4. User affinity matrix Wv and its graph LaplacianLv
where n is the number of users and m is the number of sources.
5.2.1 Bipartite content graph and adjacency matrix C
We use the collection of tweets and the set of users to construct a bipartite content matrix C (user ×source). In order to do so, for each tweet we extract the URL (if
there exists a URL) mentioned in the tweet. We then parse the URL to extract the source (news media channel) that the URL belongs to (source of the content). Next, for each (user,source)pair, we create an entry in the content matrix C such that the
(i, j)-th element of such adjacency matrixC is equal to the number of timesi-th user
has tweeted/re-tweeted content fromj-th source. So the size of C for our dataset is
6391×559
5.2.2 Social link graph and adjacency matrix A
For this set of 6391 users we also build their social relationship graph. For our experiments we built two variants of social graphs collected from two difference sources of information (i) re-tweet and (ii) follows on twitter.
1. directed Re-tweet graph and the corresponding non-symmetric link matrix 2. undirected follows graph and the corresponding symmetric link matrix 5.2.3 Laplacian of affinity graphs Lu and Lv
We construct user affinity and content affinity matrices Wu and Wv by computing the pairwise cosine similarity of row and column vectors of the content matrix C
respectively. We then construct the graph Laplacian on the affinity graphs for users and content, Lu = Du−Wu and Lu = Dv −Wv where Du =
N P j=1( Wu)ij and Dv = N P j=1( Wv)ij.
In summary, at the end of data collection and processing we have four kinds of data inputs (i) symmetric/asymmetric Social Link matrices A of dimensions 6391×6391
(ii) bipartite content matrixC of dimensions 6391×559 and (iii) Laplacian of the
user affinity graphsLu of dimensions 6391×6391 and (iv) Laplacian of the source affinity graphs Lv of dimensions 559×559
5.3
Experimental setup
In this section we describe the experimental setup required for the proposed techniques described in Chapter4 and discuss some practical issues in NMF algorithms.
5.3.1 Parameter setting
The weight parameters α and β influence the clustering. When α = 0 only the
similarity between sources has an influence in clustering. When β = 0 only the
similarity between users has an influence in clustering. The scale ofα, β control the
strength of graph regularization in the over optimization problem. In our experiments we gradually adjusted the values of α and β. We observed that combining both
link and content information and applying dual graph regularization has better performance. In our final experiments we chose the parameters by performing a grid search over a range of parameter values. We assume that we know the number of clusters a priori. For our experiments, since we know that US politics has two
dominant ideologies “Liberal” and “Conservative”, we set the number of clusters k
as 2.
5.3.2 Initialization
In our experiments, we consider two kinds of initializations of the matrices U andV.
In the first way, the initialization of the matrices U and V was performed randomly, according to a uniform distribution in [0,1]. In the second way, we apply SVD to
the input matrix C for discovering the initial structure of the matrices U and V.
That is, learning the matrices U and V can be seen as a two step process, first we
learn the initial structure by applying SVD and next we use the proposed method for the refinement. In our experiments we observed that SVD initialization did not significantly improve the performance.
The latent factor matrices H1 and H2 that capture the association between user
and source clusters are initialized as identity matrices of size k. Such an initialization
helped us to achieve a one-to-one block diagonal correspondence between the two types of clusterings such that i−th user cluster be corresponding to i−th source
cluster.
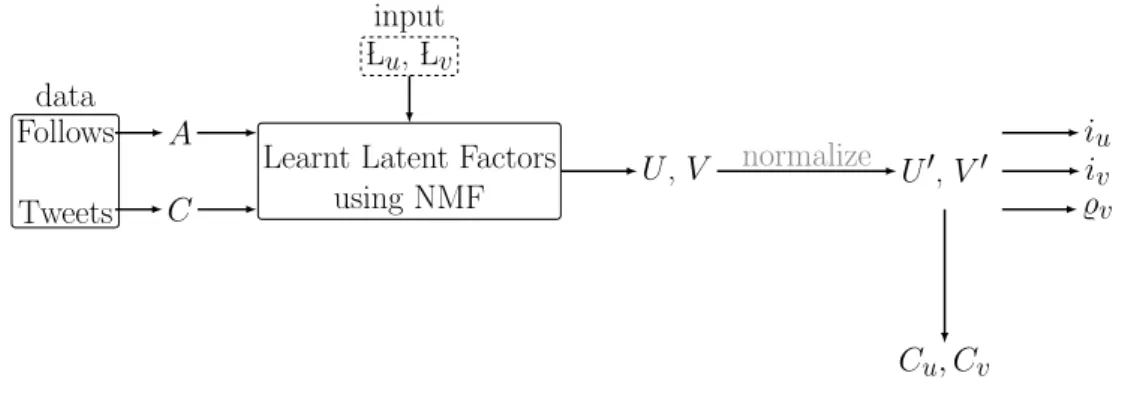
5.3.3 Summary of the experimental steps
The matrices A, C, Lu and Lv are given as input to Equation (3). We initialize the latent factor matrices U and V using two variants of initializations (i) SVD (ii)
random. The latent factors H1 and H2 that capture the association between user
and source clusters are initialized as identity matrices of size k. We set the number
of ideology clusters to be 2 manually since we have the domain knowledge for the US elections dataset. We then apply Equation (22) to update the latent variables iteratively until convergence using the multiplicative update rules in Equation (25). For each run we separate a small portion of data as validation set. During the training we apply grid search to choose the best parameter setting. We repeat the experiments
five times with different starting points (initializations of latent variables). We choose the run with best performance. We normalize the latent factorsU, V, H1 andH2
as described by Li and Ding [24]. At the end of this step we have derived user and content latent factors with a probabilistic meaning.
Follows Tweets data
A C
Learnt Latent Factors using NMF Lu, Lv input U,V U0,V0 iu iv %v Cu, Cv normalize
Figure 4: Experimental Steps
5.3.4 Seperating users and sources by ideology
Finally, the user and source ideological communities Cu and Cv are derived as
Cui = arg maxUij and Cvi = arg maxVij respectively. Table 2 illustrates some popular twitter accounts and news media channels in each ideological community. Table 2: The results of applying the proposed technique to separate users and sources into ideology clusters (setting k = 2, parameters α and β chosen by Grid
Search). Values in the table are representative popular accounts on twitter and popular news media outlets.
(a) User Clustering
Liberal cluster Conservative cluster barackobama tedcruz berniesanders seanhannity thedemocrats gop housedemocrats housegop hillaryclinton glennbeck senatedems davidlimbaughs (b) Source Clustering
Liberal cluster Conservative cluster washingtonpost breitbart nytimes foxnews thehill dailycaller huffingtonpost dailymail politico washingtonexaminer theguardian thegatewaypundit
5.3.5 Computing ideological scores
As discussed, the main goal of this thesis is not to meagrely seperate the user and sources into ideological communities but to estimate their ideological positioning on a scale in the range [0,1], 0 being liberal extreme and 1 conservative extreme.
probability vector hαi, βii and compute the user ideology scoreiu, source ideology score iv and source popularity score %v as defined in Equation (29) and Equation (30).
Refer to Figure 4 for a summary of all the experimental steps discussed in this section.
5.4
Evaluation
We evaluate the performance of the proposed method by performing an extensive comparison with well-known NMF based community detection algorithms. The focus our evaluation is twofold:
• A: evaluate the user and source ideological cluster separation • B: evaluate the estimated ideological and popularity scores
One can argue that B is a subset of A. However, since the procedure to compute the ideology score is a new approach proposed in this thesis, we wanted to separate the two. Hence, in order to objectively validate each method in isolation we run two types of evaluation experiments.
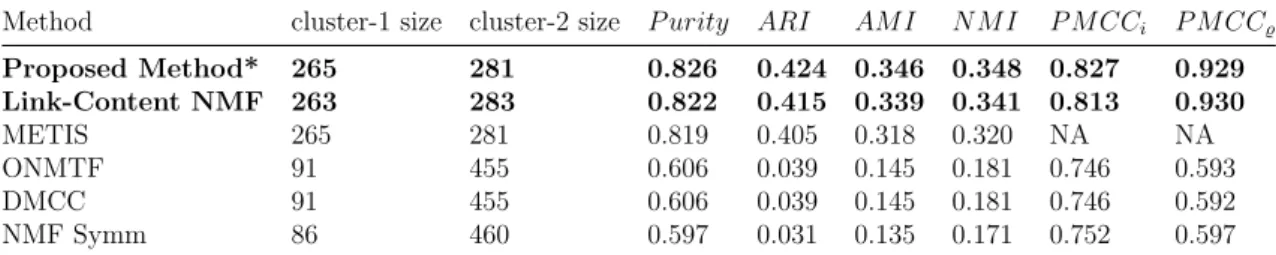
It is noteworthy that the key goal of this thesis is to be able to compute a continuous ideology score (RQ2). While we do evaluate the ability to discover clean ideological clusters, it is a comparatively easy and well studied task. On the other hand, the process of computing a continuous ideology score is more difficult problem and not well-studied problem. As such, the comparison with other competitive clustering approaches is out of the scope of this thesis. However, for the sake of completion and easy of implementation we include a popular graph Partitioning (METIS) Karypis and Kumar [22].
5.4.1 Baseline algorithms
We compare proposed method with three types of community detection methods, i.e., relation-only, content-only, combination of relation and content. As discussed earlier our focus is on NMF based methods since these can be used to compute an ideology score. The methods are introduced as follows:
• Relation-only (R):
– Symmetric NMF (NMFSymm): This approach is described in Ding et al. [12]. It is a 3-factor NMF on user-user and source-source similarity matrices. As it based only on symmetric relationship between rows and columns of same data type, we can only learn one clustering at a time. It is not possible to learn correspondence between the user clusters and source clusters with this method. This method is shown to be equivalent to Normalized Cut spectral clustering [11] [37].
min
U≥0,H≥0,V≥0kX−U HU
Tk2
F, s.t. U U
whereX =CCT for user clustering and X =CTC for source clustering.
– Graph Partitioning (METIS): This is a well-known graph partitioning approach described in Karypis and Kumar [22]. As it based on two separate graph partitions on two different graphs, i.e., user-user graph (CCT) and source-source graph (CTC), we do not have any correspondence between the user and source clusters. Further, since it is a hard clustering algorithm it is not possible to derive continuous scores with this approach. • Content-only (C):
– Orthogonal NMF Tri-Factorization (ONMTF): This method is a co-clustering approach described in [12]. It is a 3-factor nonnegative matrix factorization with orthogonality constraints. It solely uses content matrix.
min
U≥0,H≥0,V≥0kC−U HV
Tk2
F , s.t. U U
T =I, V VT =I
– Co-clustering with Graph Regularization (DMCC): This is a dual manifold co-clustering approach proposed in Cai et al. [9] and [20]. In this approach, in order to retain the geometric structure of graphs based on manifold assumption, we apply graph regularization constraint on both rows and columns of the content matrix. It solely uses content matrix.
min
U≥0,H≥0,V≥0kC−U HV
Tk2
F +α·tr(U
TLuU) +β·tr(VTLvV) • Combination of relation and content (C+R):
– Joint Link-Content Matrix Factorization (Link-Content NMF): This is a joint matrix factorization approach inspired by the formulation described in section 3 of Zhu et al. [42]. It combines both content and link matrices and performs a joint matrix factorization with shared latent variables. In this approach we only add orthogonality constraints.
min U≥0,H1≥0,H2≥0,V≥0 kA−U H1UTk 2 F +kC−U H2VTk 2 F s.t. U U T =I, V VT =I – Proposed Method: This is our approach discussed in Section 3.6. It is
a joint matrix tri-factorization on both content and link matrices with orthogonality and graph regularization constraints.
min U≥0,H1≥0,H3≥0,V≥0kA−U H1U Tk2 F +kC−U H3VTk 2 F +α·tr(UTLuU) +β·tr(VTLvV) s.t. U UT =I, V VT =I