Boston University
OpenBU http://open.bu.edu
Theses & Dissertations Boston University Theses & Dissertations
2014
Improving follow-up adherence in a
primary eye care setting: a
prospective, randomized controlled
trial
https://hdl.handle.net/2144/15339 Boston University
BOSTON UNIVERSITY SCHOOL OF MEDICINE
Thesis
IMPROVING FOLLOW-UP ADHERENCE IN A PRIMARY EYE CARE SETTING: A PROSPECTIVE, RANDOMIZED CONTROLLED TRIAL
by
CATHERINE E. CALLINAN B.S.E., University of Pennsylvania, 2012
Submitted in partial fulfillment of the requirements for the degree of
Master of Science 2014
© 2014 by
Approved by
First Reader
Karen Symes, Ph.D.
Assistant Dean of Student Affairs Associate Professor of Biochemistry
Second Reader
Lisa Hark, Ph.D., R.D.
Director, Glaucoma Research Center and Department of Research
DEDICATION
I would like to dedicate this work to my family and friends for all of their support throughout my journey to medical school.
v
ACKNOWLEDGMENTS
I would like to take the time to acknowledge my readers, Dr. Karen Symes and Dr. Lisa Hark for their support throughout this process. Additionally, thank you is due to the Wills Eye Department of Research for their guidance.
IMPROVING FOLLOW-UP ADHERENCE IN A PRIMARY EYE CARE SETTING: A PROSPECTIVE, RANDOMIZED CONTROLLED TRIAL
CATHERINE E. CALLINAN ABSTRACT
Introduction
Lack of follow-up to recommended appointments can decrease vision outcomes. Research is needed to determine the best approach to scheduling follow-up appointments in the primary eye care setting to help overcome barriers and decrease disparities in vision health. The specific aim of this work is to evaluate the effectiveness of automated and personal telephone interventions to improve follow-up adherence in the primary eye care setting.
Methods
In a prospective, single-blind, randomized, controlled trial, 1,095 patients seen in the Cataract and Primary Care service (CPEC) at Wills Eye Hospital who were due for follow-up appointments were randomly assigned to usual care, automated telephone intervention or personal telephone intervention group. Patients in the usual care group (n=364) received a form letter reminding them to make an appointment and an automated reminder phone call one day prior to their scheduled visit.
Automated intervention participants (n=365) received the usual care form letter and an automated call 1-month prior to their recommended follow-up date,
vii
a mailed appointment reminder if an appointment was scheduled, and an automated telephone reminder the day before the scheduled appointment. If a patient in the automated intervention group did not attend the scheduled
appointment, a reminder postcard was sent.
Personal intervention participants (n=365) received the traditional form letter and a personal telephone call 1-month prior to the recommended follow-up date, a mailed appointment reminder if an appointment was scheduled, and a personal telephone reminder prior to the scheduled appointment. If a patient in the personal intervention group did not attend the scheduled appointment, they received a personal call. Scheduling and attendance data were extracted from the electronic medical record system.
Results
Patients in the personal intervention group had greater adherence to follow-up recommendations than patients in the usual care group (37.70% vs. 27.47%; RR: 1.37; CI 1.24-1.52; p<0.001) and automated intervention group (29.59%; RR: 1.27; CI 1.15-1.41; p=0.02). Patients in the usual care group were not significantly different than patients in the automated intervention group in regards to adherence to follow-up recommendations (27.47% vs. 29.59%; RR: 1.08; CI 0.98-1.18; p=0.53).
Personal intervention improved adherence for patients who have been previously recognized as at risk including men (37.04% vs. 22.39%; RR: 1.65; CI:
1.41-1.94; p=0.01), African Americans (39.58% vs. 29.52%; RR: 1.34; CI 1.16-1.55; p=0.03), patients under 65 (28.93%-18.67%; RR: 1.16-1.55; CI 1.40-1.71; p=0.01), and patients who live greater than 20 miles from Wills Eye Hospital (44.74% vs. 12.50%; RR: 3.58; CI 2.59-4.95; p=0.01). Additionally, personal intervention improved adherence in patients with Medicare (58.42% vs. 43.56%; RR: 1.34; CI 1.01-1.79; p=0.03) and urban patients who live within 2 miles of Wills Eye Hospital (41.18% vs. 17.54%; RR: 2.35; CI 1.81-3.04; p=0.01).
As a secondary endpoint, personal intervention significantly improved appointment scheduling over usual care (51.09% vs. 32.14%; RR 1.59; 95% CI 1.33-1.90; p<0.001) and automated intervention (51% vs. 36%; RR: 1.40; CI 1.18-1.66; p<0.001). Automated intervention did not significantly improve appointment scheduling over usual care (36% vs. 32%; RR: 1.13; CI 0.93-1.39; p=0.22).
Conclusion
Personal intervention improved adherence to recommended follow-up for primary eye care appointments overall and in at-risk populations. Automated intervention had no significant improvement over usual care. The cost
effectiveness of personal intervention to improve outcomes in a primary
ophthalmology setting should be evaluated to determine whether the intervention should be implemented as a process change at Wills Eye Hospital and at other primary ophthalmology care centers.
ix
TABLE OF CONTENTS
TITLE………...i
COPYRIGHT PAGE………..………...ii
READER APPROVAL PAGE………...……..iii
DEDICATION ...iv
ACKNOWLEDGMENTS ... v
ABSTRACT ...vi
TABLE OF CONTENTS ...ix
LIST OF TABLES ...xi
LIST OF FIGURES ... xii
LIST OF ABBREVIATIONS ... xiii
INTRODUCTION ... 1
Importance of vision health ... 1
Barriers in vision health ... 3
Adherence studies ... 6
Rationale and specific aims ... 10
METHODS... 11
Ethical Approval ... 11
Participants ... 11
Randomization ... 11
Intervention ... 13
Main Outcome Measures ... 14
Statistical Analysis ... 14
RESULTS ... 15
Patient characteristics ... 15
Scheduling and adherence ... 17
Age ... 18 Gender ... 19 Race ... 20 Insurance ... 21 Distance ... 24 DISCUSSION ... 26
Considerations of disparities and intervention impact ... 27
Limitations ... 32
Future work ... 33
Conclusions ... 34
REFERENCES ... 36
xi
LIST OF TABLES
Table Title Page
1 Vision care follow-up recommendations for patients with diabetes
3
2 Summary of patients characteristics 16
3 Overall appointment scheduling and adherence across the intervention groups
17
4 Demographic impact on appointment scheduling and adherence
18
5 Impact of different interventions on appointment scheduling and adherence by demographic information
21
6 Insurance impact on appointment scheduling and adherence
22
7 Impact of different interventions on appointment scheduling and adherence by insurance
23
8 Impact by distance from home zip code to Wills Eye Hospital on appointment scheduling and adherence
24
9 Impact of different interventions on appointment scheduling and adherence by distance from home zip code to Wills Eye Hospital
LIST OF FIGURES
Figure Title Page
xiii
LIST OF ABBREVIATIONS
CDC ... Centers for Disease Control and Prevention CI ... Confidence interval (95%) CPEC ... Cataract and Primary Care service CSME ... Clinically significant macular edema DFE ... Dilated fundus examinations ECP ... Eye care provider EMR ... Electronic medical record IRB ... Institutional Review Board NPDR ... Non-proliferative diabetic retinopathy PDR ... Proliferative diabetic retinopathy RR ... Relative risk SD ... Standard deviation
INTRODUCTION
Importance of vision health
Vision health is critical to the overall health of the individual and has a significant impact on quality of life (Qui, Wang, Singh, & Lin, 2014). Low vision and blindness decrease an individual’s ability to walk, read, and drive. They can increase rates of depression, risk of falls and other injuries, social isolation, loss of productivity, and premature death (Zhang et al., 2012).
It has been suggested that from 1990 to 2010 the global burden of vision loss increased by 47% (Murray et al., 2013). Among US adults, visual impairment ranks among the top 10 disabilities (Chou et al., 2012), and more than 28 million adults in the US suffer from an age-related eye disease, a number that could increase by 50% or more by 2020 (Elam & Lee, 2013). Vision disorders in Americans 40 years and older cost the government $35.4 billion per year in addition to costing individuals, caregivers, and non-government health care payers an estimated $16 billion per year (Li, Xirasagar, Pumkam, Krishnaswamy, & Bennett, 2013).
It has been suggested that up to 50% of cases of blindness or visual impairment are preventable by early detection and treatment (Chou et al., 2012). Prior year eye care was associated with better vision in patients with and without significant ophthalmic disease (Li, Xirasagar, Pumkam, Krishnaswamy, & Bennett, 2013). The American Academy of Ophthalmology recommends that eye examinations for people age 40-54 years without risk factors every 2-4
2
years, age 55-64 without risk factors every 1-3 years, and age 65 and older without risk factors every 1-2 years. For those with risk factors, eye examinations are recommended even more frequently. (Elam & Lee, 2013)
One of the most significant risk factors for visual impairment is diabetes mellitus, which can cause diabetic retinopathy. People with type 2 diabetes are recommended to have an eye examination yearly after their initial diagnosis. People with type 1 diabetes are recommended to have an eye examination yearly beginning 5 years after diagnosis. Table 1 shows the specific recommendations for follow-up based on severity of the diabetic retinopathy. Diabetic retinopathy in its early stages requires less frequent follow-up especially when there is no presence of clinically significant macular edema. When the non-proliferative diabetic retinopathy starts to become severe or non-proliferative, more frequent follow-up is recommended. (American Academy of Ophthalmology, 2013)
Table 1: Vision care follow-up recommendations for patients with diabetes (American Academy of Ophthalmology, 2013)
Severity of Retinopathy Presence
of CSME* Follow-up (months) Normal or minimal NPDR No 12 Mild to moderate NPDR No Yes 6-12 2-4 Severe NPDR No Yes 2-4 2-4 Non-high-risk PDR No Yes 2-4 2-4 High-risk PDR No Yes 2-4 2-4 Inactive/involuted PDR No Yes 6-12 2-4 CSME = clinically significant macular edema; NPDR = nonproliferative diabetic retinopathy; PDR = proliferative diabetic retinopathy
Despite these recommendations, most people with diabetes do not receive optimal eye care (Chou et al., 2014). Promotion of vision health requires adequate primary ophthalmologic care, but barriers to vision care and health disparities often preclude adequate care.
Barriers in vision health
Increasing age, being a racial/ethnic minority, diagnosis with diabetes mellitus, and low socioeconomic status are shown to be high risk factors for eye disease (Elam & Lee, 2013). The population of older Americans is increasing as is the population of minority racial and ethnic groups who are more likely to have visual impairment and eye disease than non-minorities (Chou et al., 2012). In
4
addition to their greater risk of disease, some studies report limited access to eye care services for racial and ethnic minorities (Murakami et al., 2011; Elam & Lee, 2013). Other studies report no impact of race on use (Kosoko et al., 2010) or mixed usage by age group (Wagner & Rein, 2013).
In addition to racial minorities, studies report also less usage of eye care services and adherence to recommendations by younger peoples. In a study of health disparities in patients with glaucoma, Gwira et al. found that older people were were more likely to see an ophthalmologist and be compliant with follow-up appointments (2006). Likewise, a study by Perron et al. found that younger age, male gender, follow-up appointment greater than one year, and substance abuse all correlated to lower rates of appointment adherence (2010). Other studies have also determined that men tend to make less use of vision health services (Elam & Lee, 2013; Wagner & Rein, 2013). Wagner & Rein also found that women, whites, and older age groups made greater use of eye care services (2013). These consistent findings across a number of studies strongly suggest that real disparities exist by ethnicity, age, and gender.
A number of studies report that lack of health and vision insurance is a significant barrier to vision care (Elam & Lee, 2013; Li, Xirasagar, Pumkam, Krishnaswamy, & Bennett, 2013; Paksin-Hall, Dent, Dong, & Ablah, 2013; Wagner & Rein, 2013). A recent study in working-age adults found that 40% did not have vision insurance. Those who had vision insurance were significantly more likely than those without vision insurance to attend eye care visits.
Respondents with and without eye disease who had vision care reported higher quality of life. (Li et. al., 2013) In a study of people with diabetes, Paksin-Hall et al. found that insurance status significantly impacted the likelihood of receiving annual dilated eye examinations (2013).
Other barriers include income level, socioeconomic status and education level. In a study by Wagner & Rein, come greater than $35,000 was associated with greater eye care use, while lower education level was associated with less use of services (2013). Similarly, Elam & Lee found that socioeconomic status is strongly correlated with lower rates of health care utilization (2013).
Access to care is a noteworthy barrier to vision health services. Communities with larger proportions of minorities are more likely to have a shortage of physicians. Residents of these communities are more likely to have to travel outside of their neighborhood to be seen by a physician than residents of communities with larger percentages of non-minorities (Elam & Lee, 2013). Similarly, Owsley et al. found that accessibility to the doctor’s office was the most common barrier to receiving regular eye care cited by older African Americans. The lack of accessibility was due to inadequate transportation resources, consistent with other findings in the elderly population. (Owsley et al., 2006) Chou et al. examined diabetic adults’ access to eye care based on geographic density of eye care professionals (ECPs). Insured people with diabetes who lived in a county with a low density of ECPs were less likely to receive an annual
6
dilated eye examination (Chou et al., 2012). Without access to transportation or local ECPs, at-risk patients do not receive the care they need.
Communication between patient and physician is another notable barrier to eye care utilization. Communication of and education about a patient’s diagnosis has been found to be an important factor for use of care by a number of studies (Elam & Lee, 2013; Kosoko et al., 2010; Murakami et al., 2011; Wagner & Rein, 2013). The studies found that if patients fully understand their diagnosis and the risks of not adhering to medication or recommended eye care visits, they are more likely to adhere to both medications and appointments with their ECP.
The relationship between patient and physician impacts use of eye care services as well. Cultural barriers including belief system, trust issues, education level, language, concordance between physician and patient, health literacy, and immigration status can all contribute to lower use of eye care (Elam & Lee, 2013).
Many studies have explored the barriers to ophthalmic care and disparities in vision health, but few very studies have examined how to improve rates of medication and appointment adherence.
Adherence studies
Interventions are needed to overcome barriers to vision care to improve patient adherence to physician recommendations. A quantitative review conducted by DiMatteo of 50 years of research examined variations in patient
adherence to medical recommendations. The study suggests that patients with high adherence have 26% better health outcomes than patients with low adherence. (DiMatteo, 2004) The dependence of healthcare costs and health outcomes on adherence to physician recommendations renders adherence a significant issue requiring more intervention.
System-level research has the potential to improve care by encouraging greater appointment scheduling and adherence. Studies of adherence have been conducted in various fields of medicine. Henry et al. piloted an automated telephone intervention system to reduce the number of appointment no-shows at HIV primary clinics. While the intervention was successful for patients who were not diagnosed with depression, who were not homeless, and who had more frequent appointments scheduled, the intervention was not successful for patients who were homeless, racial/ethnic minorities, or patients with mental health disorders. (Henry, Goetz, & Asch, 2012) This study has important implications for future studies of automated intervention as the intervention was unsuccessful for specific at-risk subpopulations. It is important to examine the intervention’s impact on the most vulnerable, at-risk populations.
Biese et al. examined how personal telephone intervention impacted follow-up with a primary care physician after a visit to the emergency department. The telephone intervention group was significantly more likely to follow-up with their primary care physician when contacted personally via telephone compared to those who were not contacted (Biese et al., 2014). The study was conducted
8
in an older population, and thus the results may not translate for younger individuals, or to other primary care settings.
Studies of telephone intervention have shown promise in improving health outcomes in various fields of ophthalmology. Most studies have been in patients with glaucoma and patients with diabetes mellitus likely due to the severity and prevalence of these diseases. An automated, interactive telephone-based health communication intervention was piloted to improve glaucoma treatment adherence in a study by Glanz et al. (2012). The study demonstrated the severity of glaucoma patient non-adherence to medication and appointments. The telephone-based intervention system improved patient treatment and appointment adherence (Glanz et al., 2012).
A similar intervention study used multiple monthly automated phone calls, an education session, and an appointment with a physician to remind patients with glaucoma to take their medication. However, this automated intervention did not have a significant impact on adherence. Poor adherence was associated with depression and hypochondriasis. (Lim, Watnik, Imson, Porter, & Granier, 2013) Despite these findings, Kowing et al. reports that provider and patient reminder and recall systems are currently used by ophthalmology and other specialty clinics to improve both medication and appointment adherence. Automated systems are currently employed, offering patients the option to confirm or reschedule appointments. (Kowing et al., 2010)
Educational and print interventions have been piloted to increase the rates of diabetic fundus examinations (DFEs) without success (Owsley et al., 2013; Ellish, Royak-Schaler, & Higginbotham, 2011). However, personal phone calls improved rates of return to DFEs in patients over usual care (a letter mailed one month prior to recommended appointment) (Anderson et al., 2003). The study hypothesized that the personalization of the call improved the rates of return. In low-income African Americans with diabetes, telephone interventions increased rates of DFEs (Basch, Walker, Howard, Shamoon, & Zybert, 1999; Walker et al., 2008).
Telephone intervention showed 74% increase in probability of a screening compared with standard print reminders in a study of the urban poor. The study found that the intervention was successful in both English and Spanish-speakers and in both men and women (Walker et al., 2008). Intervention studies in glaucoma and diabetes have shown promise in improving screening, medication adherence, and appointment adherence.
However, there are mixed recommendations about the optimal design for adherence intervention systems. While some studies recommend multiple interventions (Halbert, Leung, Nichol, & Legorreta, 1999), other studies suggest that interventions that are simple yet personalized have been shown to be the most successful (Kosoko et al., 2010). According to a systematic review conducted by Vervloet et al., interventions involving personal reminders, such as telephone calls, had a positive impact on appointment and medication
10
adherence, but required a great amount of time and resources. The study determined electronic reminders tended to save more time and improved medication adherence. (Vervloet et al., 2012)
Rationale and specific aims
To date, there has not been a study in primary eye-care setting examining the best method to contact patients regarding appointment scheduling to improve patient adherence to follow-up recommendations. The objective of this study was to reduce the gap between recommended and actual follow-up adherence in the primary eye-care setting.
Utilizing information from electronic medical records (EMRs), a prospective, randomized, control trial was conducted in 1,095 patients to analyze the impact of automated and personal telephone-based interventions on patient adherence compared with usual care. The study analyzed eye care usage trends and the intervention success based on various patient demographics collected using the EMR system. The study outcomes will allow for recommendations at Wills Eye Hospital’s Cataract and Primary Care Service and other primary eye-care settings regarding the best approach to follow-up process improvement.
METHODS
Ethical Approval
The study was approved by the Institutional Review Board (IRB) according to the tenets of the Declaration of Helsinki. Informed consent was waived by the IRB. This trial was registered at ClinicalTrials.gov (NCT02001129).
Trial Design
The study was a single-blinded, randomized controlled trial.
Participants
Eligible patients attended Wills Eye Hospital Cataract and Primary Care Service (CPEC) between September 1, 2012 and May 31, 2013, were 18 or older, and could both understand and speak English. Between September 1, 2013 and November 30, 2013, patients who were due for 6-month, 1-year, or 2-year follow-up appointments at the Wills Eye Hospital CPEC Service were enrolled in the study. Patients with medical or ocular conditions that required follow-up earlier than 6 months were excluded.
Randomization
Electronic medical records were employed to determine eligible subjects. Subjects were randomized to usual care, automated intervention, or personal intervention. Figure 1 depicts the study protocol in the form of a flow chart.
12
Figure 1: Usual care vs. intervention groups
Usual care
(n=364)
Form letter sent
1-month before
recommended
follow-up date
Automated
reminder call day
before if patient
scheduled
appointment
Automated
intervention
(n=365)
Reminder
postcard sent to
no-shows
Personal
intervention
(n=365)
Appointment
reminder mailed if
patient scheduled
appointment
Personal
reminder call day
before if patient
scheduled
appointment
Personal call for
no-shows to
reschedule
No appointment
reminder mailed if
patient scheduled
appointment
Appointment
reminder mailed if
patient scheduled
appointment
Automated
reminder call day
before if patient
scheduled
appointment
No reminder for
no-shows
Form letter sent
and automated
call 1-month
before
recommended
follow-up date
Form letter sent
and personal call
1-month before
recommended
Intervention
Patients assigned to the usual care group (n=364) received a brief, form letter, reminding them to make an appointment 1-month prior to the recommended follow-up date. Patients received no active assistance in scheduling appointments. Patients who made appointments received automated reminder calls the day before their scheduled appointments.
Patients in the automated intervention group (n=365) received the standard form letter and an automated telephone call one month prior to the recommended follow-up date encouraging them to schedule an appointment. If the patient scheduled an eye examination appointment, an appointment reminder was mailed, and the patient received an automated telephone reminder prior to the scheduled appointment. If the patient did not attend the scheduled appointment, a reminder postcard was sent.
Patients in the personal intervention group (n=365) received the standard form letter and one or two personal phone calls to offer assistance with making an appointment. Explanations for declined appointments were noted in FileMaker Pro, a research tracking software database (FileMaker, Inc.). Patients who scheduled appointments received an appointment reminder letter and a personal telephone reminder prior to the scheduled appointment. Patients who did not attend their appointment were contacted up to three times to assist them with scheduling.
14
The EMR was utilized to confirm scheduled appointments and assess patient adherence to keeping appointments.
Main Outcome Measures
The primary outcome measure was adherence to a follow-up vision care appointment in CPEC at Wills Eye Hospital. Adherence was defined as attendance at a recommended follow-up appointment. A patient was adherent if they scheduled and attended their appointment. Appointment scheduling was a secondary outcome, obtained from the EMR.
Statistical Analysis
The following data were obtained from the EMR at baseline: gender, ethnicity, age, home zip code, and insurance. The patients’ home zip code was used to calculate their approximate distance from Wills Eye Hospital. Scheduling and attendance data were also extracted from the EMR after completion of the follow-up period.
Frequency counts with percentages were tabulated for categorical variables and means with standard deviations were calculated for continuous variables. Patient appointment scheduling and adherence rates in the automated intervention group and personal intervention group were compared with those who received the usual care. A chi-square test was conducted to compare the proportions of participants scheduling and adhering to their appointments.
Relative risks (RR) are presented with 95% confidence intervals (CI). A p value of 0.05 was considered significant.
RESULTS
Patient characteristics
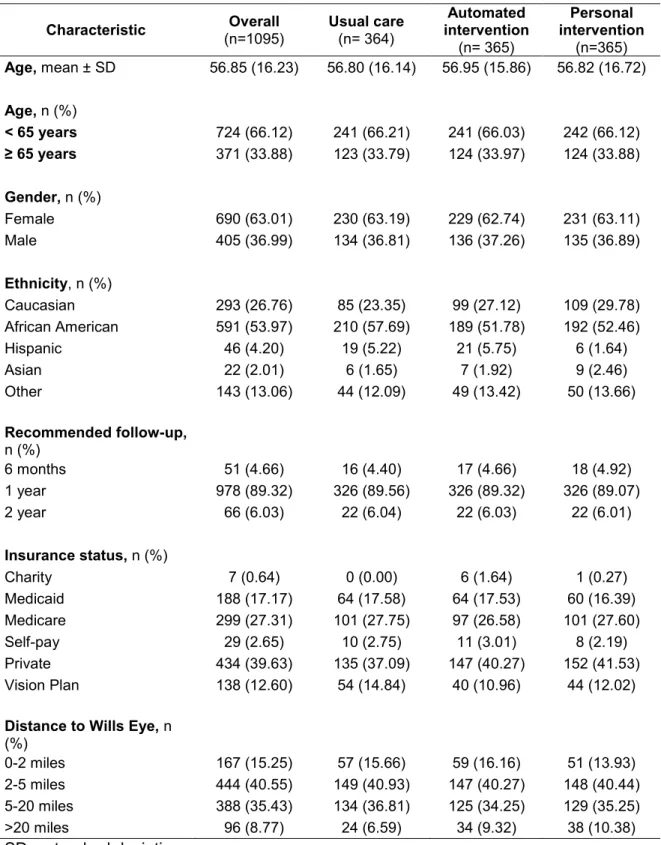
From September to November 2013, 1095 patients were due for follow up care and randomly assigned, 364 to the usual care group, 365 to the automated intervention, and 365 to the personal intervention group. Required time to follow-up appointment (6-months, 1-year, and 2-years) was stratified across the three groups. Patients in each group had similar demographics in regards to age, gender, and ethnicity. The majority of patients were less than 65 years old (66.12%), female (63.01%), and African American (53.97%). The majority of the patients were due for a 1-year follow-up appointment (89.32%). Private was the most commonly held insurance type (39.63%). The majority of patients lived in zip codes within 5 miles of Wills Eye Hospital (55.80%). Table 2 summarizes these patient characteristics.
16
Table 2: Summary of patients characteristics (n=1,095)
Characteristic (n=1095) Overall Usual care (n= 364) intervention Automated
(n= 365) Personal intervention (n=365) Age, mean ± SD 56.85 (16.23) 56.80 (16.14) 56.95 (15.86) 56.82 (16.72) Age, n (%) < 65 years 724 (66.12) 241 (66.21) 241 (66.03) 242 (66.12) ≥ 65 years 371 (33.88) 123 (33.79) 124 (33.97) 124 (33.88) Gender, n (%) Female 690 (63.01) 230 (63.19) 229 (62.74) 231 (63.11) Male 405 (36.99) 134 (36.81) 136 (37.26) 135 (36.89) Ethnicity, n (%) Caucasian 293 (26.76) 85 (23.35) 99 (27.12) 109 (29.78) African American 591 (53.97) 210 (57.69) 189 (51.78) 192 (52.46) Hispanic 46 (4.20) 19 (5.22) 21 (5.75) 6 (1.64) Asian 22 (2.01) 6 (1.65) 7 (1.92) 9 (2.46) Other 143 (13.06) 44 (12.09) 49 (13.42) 50 (13.66) Recommended follow-up, n (%) 6 months 51 (4.66) 16 (4.40) 17 (4.66) 18 (4.92) 1 year 978 (89.32) 326 (89.56) 326 (89.32) 326 (89.07) 2 year 66 (6.03) 22 (6.04) 22 (6.03) 22 (6.01) Insurance status, n (%) Charity 7 (0.64) 0 (0.00) 6 (1.64) 1 (0.27) Medicaid 188 (17.17) 64 (17.58) 64 (17.53) 60 (16.39) Medicare 299 (27.31) 101 (27.75) 97 (26.58) 101 (27.60) Self-pay 29 (2.65) 10 (2.75) 11 (3.01) 8 (2.19) Private 434 (39.63) 135 (37.09) 147 (40.27) 152 (41.53) Vision Plan 138 (12.60) 54 (14.84) 40 (10.96) 44 (12.02)
Distance to Wills Eye, n (%) 0-2 miles 167 (15.25) 57 (15.66) 59 (16.16) 51 (13.93) 2-5 miles 444 (40.55) 149 (40.93) 147 (40.27) 148 (40.44) 5-20 miles 388 (35.43) 134 (36.81) 125 (34.25) 129 (35.25) >20 miles 96 (8.77) 24 (6.59) 34 (9.32) 38 (10.38) SD = standard deviation
Scheduling and adherence
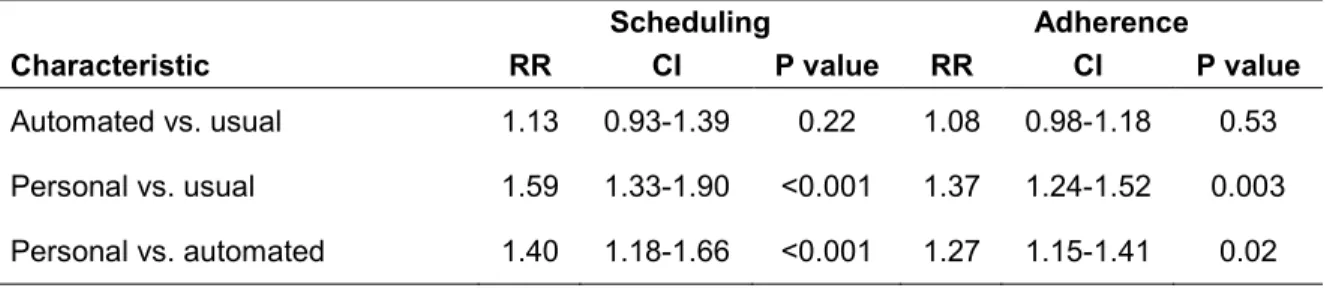
Personal intervention significantly improved appointment scheduling over usual care (51.09% vs. 32.14%; RR 1.59; 95% CI 1.33-1.90; p<0.001) and automated intervention (51.09% vs. 36.44%; RR: 1.40; CI 1.18-1.66; p<0.001). Automated intervention did not significantly improve appointment scheduling over usual care (36.44% vs. 32.14%; RR: 1.13; CI 0.93-1.39; p=0.22).
Patients in the personal intervention group had greater adherence to follow-up recommendations than patients in the usual care group (37.70% vs. 27.47%; RR: 1.37; CI 1.24-1.52; p<0.001) and automated intervention group (29.59%; RR: 1.27; CI 1.15-1.41; p=0.02). Patients in the usual care group were not significantly different than patients in the automated intervention group with regards to adherence to follow-up recommendations (27.47% vs. 29.59%; RR: 1.08; CI 0.98-1.18; p=0.53). Table 3 displays these results.
Table 3: Overall appointment scheduling and adherence across the intervention groups
Scheduling Adherence
Characteristic RR CI P value RR CI P value
Automated vs. usual 1.13 0.93-1.39 0.22 1.08 0.98-1.18 0.53 Personal vs. usual 1.59 1.33-1.90 <0.001 1.37 1.24-1.52 0.003 Personal vs. automated 1.40 1.18-1.66 <0.001 1.27 1.15-1.41 0.02
18
Age
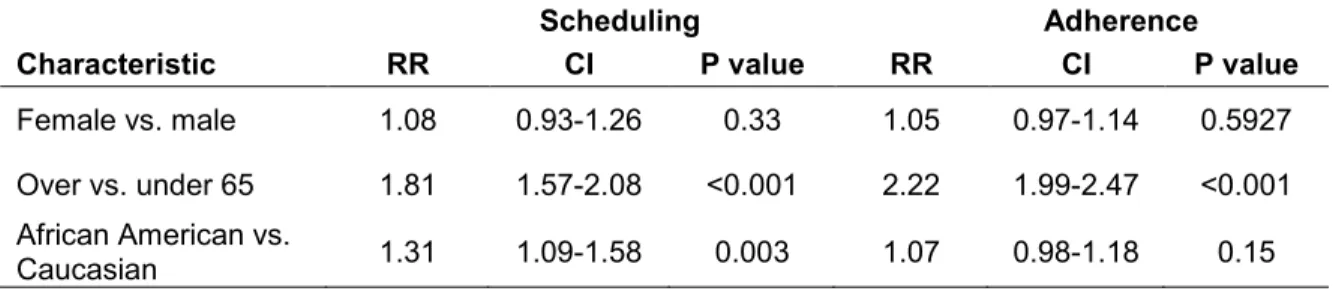
Patients over age 65 were significantly more likely to schedule an appointment (56.60% vs. 31.35%; RR: 1.81; CI 1.57-2.08; p<0.001) and adhere to follow-up recommendations (49.60% vs. 22.38%; RR: 2.22; CI 1.99-2.47; p<0.001) than patients younger than 65. The results are shown in Table 4.
Table 4: Demographic impact on appointment scheduling and adherence
Scheduling Adherence
Characteristic RR CI P value RR CI P value
Female vs. male 1.08 0.93-1.26 0.33 1.05 0.97-1.14 0.5927 Over vs. under 65 1.81 1.57-2.08 <0.001 2.22 1.99-2.47 <0.001 African American vs.
Caucasian 1.31 1.09-1.58 0.003 1.07 0.98-1.18 0.15
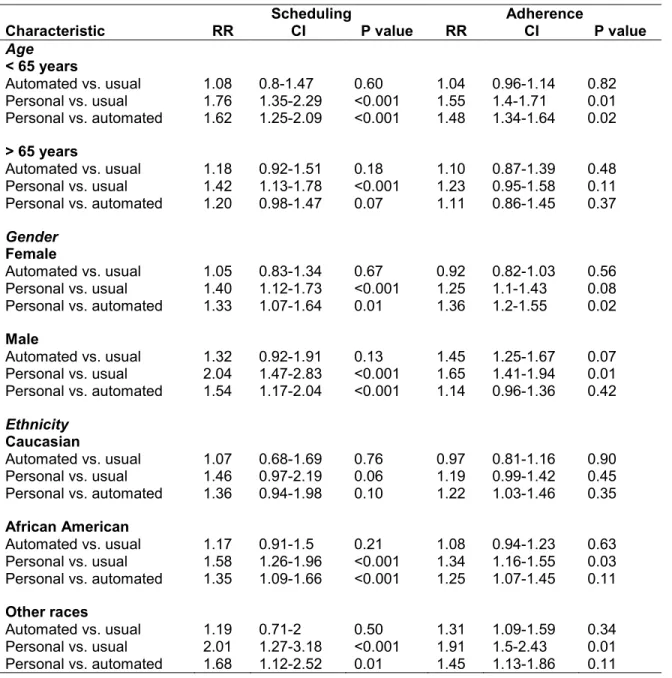
Regardless of age, patients were more likely to schedule an appointment if they received personal intervention rather than usual care (under 65: 42.98% vs. 24.48%; RR: 1.76; CI 1.35-2.29; 65 and over: 66.94% vs. 47.15%; RR: 1.42; CI 1.13-1.78; p<0.001). Additionally, patients younger than 65 were more likely to schedule an appointment if they received the personal intervention rather than the automated intervention (42.98% vs. 26.56%; RR: 1.62; CI 1.25-2.09; p<0.001). The results are displayed in Table 5.
Patients younger than 65 were significantly more likely to adhere to follow-up recommendations if they received the personal intervention instead of the automated intervention (28.93% vs. 19.50%; RR: 1.48; CI 1.34-1.64; p=0.02) or usual care (28.93%-18.67%; RR: 1.55; CI 1.40-1.71; p=0.01), while for patients
older than age 65, there was no significant difference on follow-up adherence between the intervention groups. The results are displayed in Table 5.
Gender
Gender did not significantly impact rates of scheduling appointments (women: 41.01% vs. men: 38.02%; RR: 1.08; CI 0.93-1.26; p=0.33) or follow-up adherence (women: 30.62% vs. men: 32.17%; RR: 1.05; CI 0.97-1.14; p=0.59). However, there were significantly more women than men in the study (63.01% vs. 36.99%; p<0.001). The results can be seen in Table 4.
Both male and female patients who received personal intervention were more likely to schedule an appointment than those who received automated intervention (male: 53.33% vs. 34.56%; RR: 1.54; CI 1.17-2.04; p<0.001; female: 49.78% vs. 37.55%; RR: 1.33; CI 1.07-1.64; p=0.01) and those who receive usual care (male: 53.33% vs. 26.12%; RR: 2.04; CI 1.47-2.83; p<0.001; female: 49.78% vs. 35.65%; RR: 1.40; CI 1.12-1.73; p<0.001). The results are displayed in Table 5.
Male patients who received personal intervention were more likely to adhere to follow-up recommendations than those who received usual care (37.04% vs. 22.39%; RR: 1.65; CI: 1.41-1.94; p=0.01). There was no significant difference in adherence between female patients who received usual care and either intervention (automated: 27.95% vs. 30.43%; RR: 0.92; CI 0.82-1.03;
20
p=0.56; personal: 38.10% vs. 30.43%; RR: 1.25; CI: 1.10-1.43; p=0.08). Table 5 displays these results.
Race
African Americans were significantly more likely than Caucasians to schedule appointments (44.33% vs. 33.79%; RR: 1.31; CI 1.09-1.58; p<0.0013). However, ethnicity was not a significant factor in adherence to follow-up recommendations (33.50% vs. 28.67%; RR: 1.07; CI 0.98-1.18; p=0.15). Table 4 details these results.
For African Americans, personal intervention resulted in higher rates of scheduling and adherence than usual care (scheduling: 56.25% vs. 35.71%; RR: 1.58; CI 1.26-1.96; p<0.001; adherence: 39.58% vs. 29.52%; RR: 1.34; CI 1.16-1.55; p=0.03). Personal intervention also resulted in higher rates of scheduling than automated intervention (56.25% vs. 41.80%; RR: 1.35; CI 1.09-1.66; p<0.001). No significant difference in appointment scheduling or adherence was found across the three groups for Caucasians. These results are found in Table 5.
Table 5: Impact of different interventions on appointment scheduling and adherence by demographic information
Scheduling Adherence
Characteristic RR CI P value RR CI P value
Age < 65 years Automated vs. usual 1.08 0.8-1.47 0.60 1.04 0.96-1.14 0.82 Personal vs. usual 1.76 1.35-2.29 <0.001 1.55 1.4-1.71 0.01 Personal vs. automated 1.62 1.25-2.09 <0.001 1.48 1.34-1.64 0.02 > 65 years Automated vs. usual 1.18 0.92-1.51 0.18 1.10 0.87-1.39 0.48 Personal vs. usual 1.42 1.13-1.78 <0.001 1.23 0.95-1.58 0.11 Personal vs. automated 1.20 0.98-1.47 0.07 1.11 0.86-1.45 0.37 Gender Female Automated vs. usual 1.05 0.83-1.34 0.67 0.92 0.82-1.03 0.56 Personal vs. usual 1.40 1.12-1.73 <0.001 1.25 1.1-1.43 0.08 Personal vs. automated 1.33 1.07-1.64 0.01 1.36 1.2-1.55 0.02 Male Automated vs. usual 1.32 0.92-1.91 0.13 1.45 1.25-1.67 0.07 Personal vs. usual 2.04 1.47-2.83 <0.001 1.65 1.41-1.94 0.01 Personal vs. automated 1.54 1.17-2.04 <0.001 1.14 0.96-1.36 0.42 Ethnicity Caucasian Automated vs. usual 1.07 0.68-1.69 0.76 0.97 0.81-1.16 0.90 Personal vs. usual 1.46 0.97-2.19 0.06 1.19 0.99-1.42 0.45 Personal vs. automated 1.36 0.94-1.98 0.10 1.22 1.03-1.46 0.35 African American Automated vs. usual 1.17 0.91-1.5 0.21 1.08 0.94-1.23 0.63 Personal vs. usual 1.58 1.26-1.96 <0.001 1.34 1.16-1.55 0.03 Personal vs. automated 1.35 1.09-1.66 <0.001 1.25 1.07-1.45 0.11 Other races Automated vs. usual 1.19 0.71-2 0.50 1.31 1.09-1.59 0.34 Personal vs. usual 2.01 1.27-3.18 <0.001 1.91 1.5-2.43 0.01 Personal vs. automated 1.68 1.12-2.52 0.01 1.45 1.13-1.86 0.11 Insurance
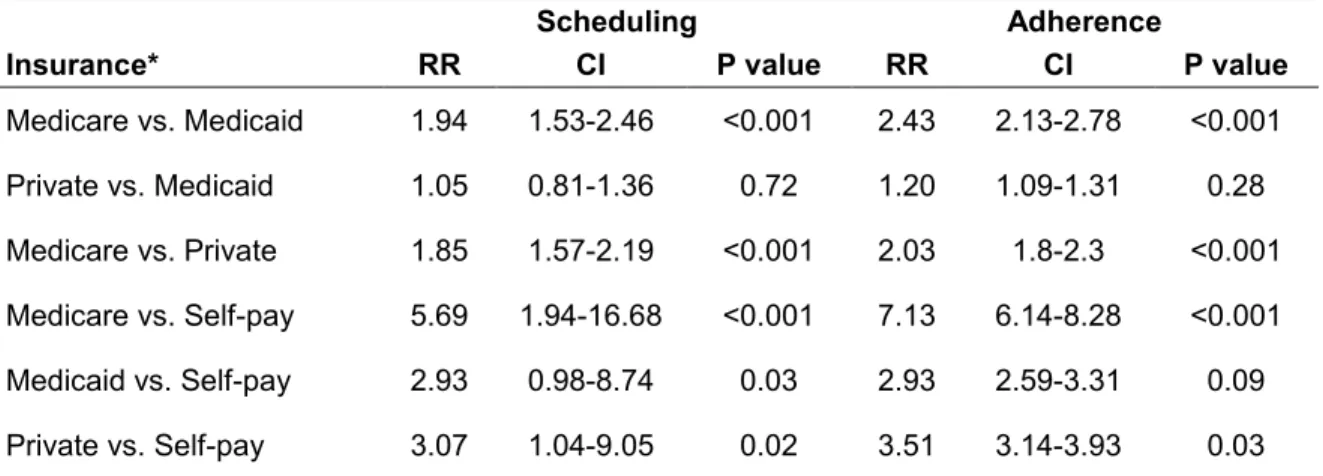
Patients with Medicare and private insurance were more likely to schedule and adhere to appointments than patients without insurance (self-pay) (Medicare: 58.86% vs. 10.34%; RR: 5.69; CI 1.94-16.68; p<0.001; private: 31.80% vs.
22
10.34%; RR: 7.13; CI 6.14-8.28; p<0.001). Patients with Medicare were significantly more likely than patients with Medicaid and private insurance to both schedule an appointment (Medicaid: 58.86% vs. 30.32%; RR: 1.94; CI 1.53-2.46; p<0.001; private insurance: 58.86% vs. 31.80%; RR: 1.85; CI 1.57-2.19; p<0.001) and adhere to the appointment (Medicaid: 49.16% vs. 20.21%; RR: 2.43; CI 2.13-2.78; p<0.001; private insurance: 24.19%; RR: 2.03; CI 1.80-2.30; p<0.001). The results may be seen in Table 6.
Table 6: Insurance impact on appointment scheduling and adherence
Scheduling Adherence
Insurance* RR CI P value RR CI P value
Medicare vs. Medicaid 1.94 1.53-2.46 <0.001 2.43 2.13-2.78 <0.001 Private vs. Medicaid 1.05 0.81-1.36 0.72 1.20 1.09-1.31 0.28 Medicare vs. Private 1.85 1.57-2.19 <0.001 2.03 1.8-2.3 <0.001 Medicare vs. Self-pay 5.69 1.94-16.68 <0.001 7.13 6.14-8.28 <0.001 Medicaid vs. Self-pay 2.93 0.98-8.74 0.03 2.93 2.59-3.31 0.09 Private vs. Self-pay 3.07 1.04-9.05 0.02 3.51 3.14-3.93 0.03 *Note: Charity, self-pay, and Vision Plan were not included due to the small number of patients with those insurance types.
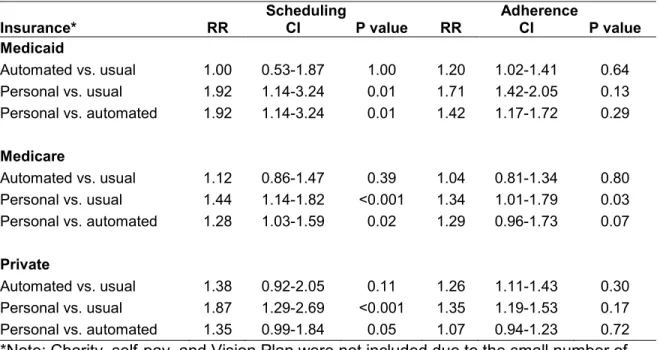
Both Medicare and Medicaid patients who received personal intervention were more likely to schedule appointments than patients in the usual care (Medicare: 71.29% vs. 49.50%; RR: 1.44; CI 1.14-1.82; p<0.001; Medicaid: 45.00% vs. 23.44%; RR: 1.92; CI 1.14-3.24; p=0.01) and automated intervention groups (Medicare: 71.29% vs. 55.67%; RR: 1.28; CI 1.03-1.59; p=0.02; Medicaid: 45% vs. 23.44%; RR: 1.92; CI 1.14-3.24; p=0.01). Patients with private
insurance were significantly more likely to schedule an appointment if they received personal intervention than if they received usual care (41.45% vs. 22.22%; RR: 1.87; CI 1.29-2.69; p<0.001). These results detailed in Table 7.
While Medicare patients who had personal intervention were more likely to adhere to follow-up recommendations than those who received the usual care (58.42% vs. 43.56%; RR: 1.34; CI 1.01-1.79; p=0.03), there was no significant difference in follow-up adherence in patients with private insurance or Medicaid across the three intervention groups. These results are found in Table 7.
Table 7: Impact of different interventions on appointment scheduling and adherence by insurance*
Scheduling Adherence
Insurance* RR CI P value RR CI P value
Medicaid Automated vs. usual 1.00 0.53-1.87 1.00 1.20 1.02-1.41 0.64 Personal vs. usual 1.92 1.14-3.24 0.01 1.71 1.42-2.05 0.13 Personal vs. automated 1.92 1.14-3.24 0.01 1.42 1.17-1.72 0.29 Medicare Automated vs. usual 1.12 0.86-1.47 0.39 1.04 0.81-1.34 0.80 Personal vs. usual 1.44 1.14-1.82 <0.001 1.34 1.01-1.79 0.03 Personal vs. automated 1.28 1.03-1.59 0.02 1.29 0.96-1.73 0.07 Private Automated vs. usual 1.38 0.92-2.05 0.11 1.26 1.11-1.43 0.30 Personal vs. usual 1.87 1.29-2.69 <0.001 1.35 1.19-1.53 0.17 Personal vs. automated 1.35 0.99-1.84 0.05 1.07 0.94-1.23 0.72 *Note: Charity, self-pay, and Vision Plan were not included due to the small number of patients with those insurance types.
24
Distance
Distance from Wills Eye Hospital did not impact appointment scheduling or appointment adherence. Table 8 presents these results.
Table 8: Impact by distance from home zip code to Wills Eye Hospital on appointment scheduling and adherence
Scheduling Adherence
Distance RR CI P value RR CI P value
0-2 vs. 2-5 0.92 0.74-1.15 0.47 0.89 0.79-1 0.36 0-2 vs. 5-20 1.06 0.84-1.33 0.63 1.06 0.94-1.19 0.69 0-2 vs. >20 1.05 0.77-1.45 0.75 0.98 0.83-1.16 0.90 2-5 vs. 5-20 1.15 0.97-1.35 0.11 1.19 1.09-1.31 0.08 2-5 vs. >20 1.14 0.86-1.51 0.34 1.10 0.95-1.28 0.55 5-20 vs. >20 1.00 0.75-1.33 0.98 0.92 0.8-1.07 0.65
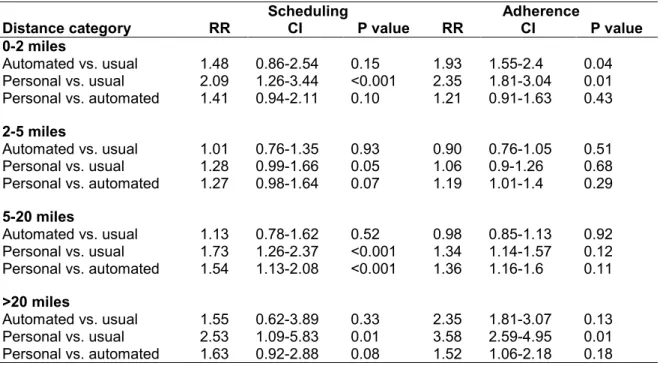
However, patients who live within 0-2 miles of, within 5-20 miles of, or greater than 20 miles from Wills Eye Hospital were more likely to schedule an appointment if they received personal intervention rather than usual care (0-2 miles: 54.90% vs. 26.32%; RR: 2.09; CI 1.26-3.44; p<0.001; 5-20 miles: 50.39% vs. 29.10%; RR: 1.73; CI 1.26-2.37; p<0.001; >20 miles: 52.63% vs. 20.83%; RR: 2.53; CI 1.09-5.83; p=0.01). Patients who live 5-20 miles from Wills Eye Hospital and were part of the personal intervention group were significantly more likely to schedule a follow-up appointment compared with patients in the automated intervention group (50.39% vs. 32.80%; RR: 1.54; CI 1.13-2.08; p<0.001). Table 9 details these results.
For patients who live within 2 miles of Wills Eye Hospital, both personal and automated intervention improved follow-up adherence over usual care (personal intervention: 41.18% vs. 17.54%; RR: 2.35; CI 1.81-3.04; p=0.01) (automated intervention: 33.90% vs. 17.54%; RR: 1.93; CI 1.55-2.4; p=0.04). For patients who live greater than 20 miles from Wills Eye Hospital, personal intervention significantly improved adherence to follow-up recommendations (44.74% vs. 12.50%; RR: 3.58; CI 2.59-4.95; p=0.01). For patients who live between 2-5 miles and 5-20 miles of Wills Eye Hospital, there was no significant difference between the study groups on follow-up adherence. The results may be viewed in Table 9.
Table 9: Impact of different interventions on appointment scheduling and adherence by distance from home zip code to Wills Eye Hospital
Scheduling Adherence
Distance category RR CI P value RR CI P value
0-2 miles Automated vs. usual 1.48 0.86-2.54 0.15 1.93 1.55-2.4 0.04 Personal vs. usual 2.09 1.26-3.44 <0.001 2.35 1.81-3.04 0.01 Personal vs. automated 1.41 0.94-2.11 0.10 1.21 0.91-1.63 0.43 2-5 miles Automated vs. usual 1.01 0.76-1.35 0.93 0.90 0.76-1.05 0.51 Personal vs. usual 1.28 0.99-1.66 0.05 1.06 0.9-1.26 0.68 Personal vs. automated 1.27 0.98-1.64 0.07 1.19 1.01-1.4 0.29 5-20 miles Automated vs. usual 1.13 0.78-1.62 0.52 0.98 0.85-1.13 0.92 Personal vs. usual 1.73 1.26-2.37 <0.001 1.34 1.14-1.57 0.12 Personal vs. automated 1.54 1.13-2.08 <0.001 1.36 1.16-1.6 0.11 >20 miles Automated vs. usual 1.55 0.62-3.89 0.33 2.35 1.81-3.07 0.13 Personal vs. usual 2.53 1.09-5.83 0.01 3.58 2.59-4.95 0.01 Personal vs. automated 1.63 0.92-2.88 0.08 1.52 1.06-2.18 0.18
26 DISCUSSION
Patients in the personal intervention group were significantly more likely to schedule and keep an appointment than patients in the automated or usual care groups. Automated intervention did not significantly improve scheduling or adherence over usual care. These findings are supported by previous literature that demonstrated that personal communication and multiple interventions components are more beneficial to adherence than a single, impersonal strategy (Anderson et al., 2003; Biese et al., 2014; Halbert et al., 1999; Kosoko et al., 2010; Walker et al., 2008).
It is theorized that personal intervention allowed for a connection to be made between the patient and the researcher in order to stress the importance of following up with their ophthalmic care. Automated intervention and the usual care form letter were likely unable to stress the same urgency of scheduling a follow-up appointment as a person with healthcare affiliation. People most likely disregard mail and automated appointment reminders because they are impersonal and often these reminders fail to explain the specific benefits of following up. When speaking with a person affiliated with a healthcare institution about the importance of scheduling and attending a follow-up appointment, however, a sense of necessity and concern is communicated, and people are more likely to both schedule and adhere to their recommended appointments.
In addition to analyzing the impact of intervention on adherence, this study was able to analyze differences in usage of primary eye care services at Wills
Eye Hospital. The use of the EMR system was beneficial to the study because demographic data could be easily collected about the patients in the different intervention groups. The demographic data was useful in analyzing how patients with different characteristics use primary eye care and how intervention impacted their use compared with usual care. Studies about usage of healthcare services are important to track whether individuals are getting the care they need. Identifying disparities in healthcare is critical so that strategies, such as personal intervention to improve follow-up, can be tailored to address the barriers preventing individuals from receiving adequate care. This study analyzed how age, sex, race, insurance, and distance to the eye care facility influence use of eye care services and success of intervention on adherence.
Considerations of disparities and intervention impact
Older patients were significantly more likely to schedule and adhere to appointments than younger patients. This is in agreement with previous studies showing that seniors are more likely to adhere to eye care services than younger adults (Gwira et al., 2006; Lee et al., 2009; Perron et al., 2010). This may be due to the fact that patients older than 65 are more likely to be retired and have time to attend primary eye care appointments. Another likely factor is the increased burden of vision disease on older patients due to age-related diseases such as age-related macular degeneration, cataract, diabetic eye disease, glaucoma, dry eye, and low vision (National Eye Institute, 2014). A study by the Centers for
28
Disease Control (CDC) found that people aged 40-64 were more likely to report “cost or lack of insurance” as the primary reason for not seeking eye care, while “no need” was the most common reason cited by those older than 65, suggesting that younger people who may need eye care are not seeking it due to real or perceived cost barriers (2011).
For patients younger than 65, personal intervention led to higher rates of both appointment scheduling and adherence, suggesting that personal intervention may improve follow-up adherence recommendations among this age group at other primary eye care centers. As Lee et al. discusses in a study of barriers to eye care utilization, it is important to establish good eye care screening practices in middle aged people so that care does not start too late (2009). The slow progression of many age-related eye diseases means that patients may not notice changes until significant disease progression, which is why it is crucial that all patients receive regular eye examinations per the American Academy of Ophthalmology’s recommendations (National Eye Institute, 2014). It is therefore significant that personal intervention improved follow-up in the younger adult group that has been reported to underutilize vision health services.
In contrast, for patients 65 and older, there was no significant difference in appointment adherence between patients who received personal intervention versus the usual care. Usual care (an appointment form letter sent one month
prior to appointment and reminder call the day before the scheduled appointment) may be adequate for this older patient group.
While previous research suggests that men are less likely to adhere to follow-up recommendations, this study did not find any gender-related differences in appointment scheduling or adherence (Elam et al., 2013; Lee et al., 2009; Perron et al., 2010; Wagner & Rein, 2013). Male patients who received personal intervention were more likely to adhere to follow-up recommendations than those who received usual care. However, there was no significant impact of intervention for female patients. Personal intervention may improve adherence to follow-up in male patients who reportedly utilize eye care resources less than females at other vision health centers, while usual care may be adequate for the female population.
There were more African Americans than Caucasians in this study (53.97% vs. 26.76%). Previous literature is not in agreement about eye-care utilization by race as some studies report lower usage of eye care services by minorities while other studies report greater usage than Caucasian patients (Elam & Lee, 2013; Murakami et al., 2011; Kosoko et al., 2010; Wagner & Rein, 2013). Wills Eye Hospital is located in an urban center with a large African American population. Thus, the greater percentage of African Americans than Caucasians utilizing care at Wills Eye Hospital does not mean that African Americans are utilizing eye care services more than Caucasians on the whole.
30
Further study is needed to fully evaluate disparities in vision care use in this population.
No significant difference in adherence to follow-up recommendations was found between African Americans and Caucasians. Because African Americans are at greater risk than Caucasians to develop certain preventable or manageable eye diseases (Elam & Lee, 2013), adequate use of primary vision care is crucial in this population and intervention to encourage greater follow-up is particularly important. Personal intervention improved appointment scheduling and adherence compared with usual care for African Americans, but not for Caucasians. Previous studies of personal telephone intervention in the ophthalmology field to improve glaucoma medication adherence and DFEs in African American populations have also shown promising results (Anderson et al., 2003; Basch, Walker, Howard, Shamoon, & Zybert, 1999; Walker et al., 2008). Usual care may be sufficient for Caucasian patients to ensure adequate adherence; however, personal intervention in the at-risk African American population can help improve follow-up to primary eye care appointments at Wills Eye Hospital and potentially at other eye care centers as well.
The findings of this study are similar to previous studies with respect to insurance impact on adherence (Chou et al., 2014; Li, Xirasagar, Pumkam, Krishnaswamy, & Bennett, 2013; Wagner & Rein, 2013). Patients with Medicare or private insurance were more likely to schedule and adhere to recommended follow-up appointments than patients without insurance. The rollout of the
Affordable Care Act will hopefully help alleviate disparities in vision care created by insurance and cost by increasing the number of people with vision care coverage.
Additionally, patients with Medicare were significantly more likely than patients with Medicaid and private insurance to both schedule and adhere to an appointment. This is in agreement with previous literature finding that patients with public and both public and private insurance are more likely than patients with private insurance only to utilize eye care services (Lee et al., 2009).
Patients with Medicare, Medicaid and private insurance were all more likely to schedule an appointment with personal intervention. Only Medicare patients, however, were more likely to adhere to recommended follow-up instructions with personal intervention. Since patients with Medicare insurance are more likely to schedule appointments than patients with Medicaid and private insurance, personal intervention may not have a significant impact on adherence based on insurance.
In contrast to previous studies that note accessibility as a barrier to utilization of eye care services, there was no significant impact of distance from Wills Eye Hospital on appointment scheduling or appointment adherence (Chou et al., 2012; Elam & Lee, 2013). For patients who lived within 2-20 miles of Wills Eye Hospital, there was no significant impact of either intervention on appointment adherence. However, for patients who lived greater than 20 miles from Wills Eye Hospital, personal intervention significantly improved adherence
32
to follow-up recommendations, suggesting that for these patients personal intervention may improve follow-up adherence among this suburban/rural population.
Limitations
A number of limitations should be considered when reviewing the results this study. Missing or inaccurate contact information prevented contact in the intervention groups and the usual care group. It is strongly recommended that full, current contact information for the patient and relatives be collected at each patient encounter. It is likely that missing contact information affected the intervention groups equally and did not impact results significantly. Additionally, the insurance status obtained from the EMR system may not have reflected the current status of the patient.
It is possible that some patients received eye care in other settings but were counted as non-adherent. Thus, the follow-up rates may be underestimated. Another, notable limitation of this study was the small number of uninsured patients did not allow for a complete analysis of personal and automated intervention impact on these at-risk patients. The small number of study subjects without insurance is probably due to the fact that they are less likely to access primary eye care at Wills Eye Hospital.
Finally, the study was conducted in an urban setting in which most of the patients are African American with Medicare or Medicaid coverage and therefore
may not be applicable to practices with other demographic distributions or in rural communities.
Future work
Further statistical analysis of the data collected in this study may yield intriguing results for the field. The EMR system at Wills Eye Hospital has the capacity collect primary, secondary, tertiary and quaternary diagnosis data for each patient. Previous studies have found that a clear diagnosis and medication prescription improve adherence to future appointments (Kosoko et al., 2010; Wagner & Rein, 2013). Future work for this study could include evaluating whether patient diagnosis/diagnoses impacted follow-up adherence. Additionally, examination of adherence by type of ocular diagnosis could have important implications for what diseases require education about the importance of follow-up care.
The impact of time to follow-up on appointment adherence is another statistical analysis that could be performed with the data collected by the EMR system. Previous studies have suggested that more frequent visits lead to greater appointment adherence (Henry, Goetz, & Asch, 2012). An examination of the impact of time to follow-up on adherence could yield interesting results with clinical implications for follow-up recommendations.
Future work may also include the evaluation of the cost-effectiveness of personal intervention at Wills Eye Hospital. While the results of this study were
34
encouraging with respect to personal intervention, it is important to conduct a full cost-benefit analysis as personal intervention requires significant resources, including time, personnel, and funding (Vervloet et al., 2012). Furthermore, follow-up adherence’s impact on patient vision outcomes should be considered when calculating the cost-effectiveness of personal intervention. Murakami et al. notes that little attention has been given to inconsistent adherence to recommended follow-up visits as a predictive factor for vision loss (2011). This type of endpoint will help fully evaluate cost-effectiveness of personal intervention to improve follow-up adherence to primary eye care appointments.
Finally, evaluation of this type of intervention in other ophthalmic care centers is necessary to determine whether other centers would benefit from similar process changes. Personal intervention may not be feasible at other primary eye care centers due to personnel and resource constraints.
Conclusions
This study has shown that in a primary eye care setting, personal intervention consisting of a mailed letter, phone call to schedule an eye examination appointment, and a reminder phone call prior to the appointment can increase patient adherence to recommended follow-up appointments. Personal intervention improved follow-up over usual care by more than 10%, from 27.47% to 37.70%.
Personal intervention improved adherence for patients who have been previously recognized as at risk including men, African Americans, patients younger than 65, and patients who live greater than 20 miles from Wills Eye Hospital. The information about intervention impact overall and by demographic information will help inform institutional decisions about implementing personal intervention to improve follow-up care.
36
REFERENCES
American Academy of Ophthalmology. (2013). Diabetic retinopathy summary benchmarks for Preferred Practice Pattern ® guidelines. Retrieved May/21, 2014, from
http://one.aao.org/summary-benchmark-detail/diabetic-retinopathy-summary-benchmark--october-20
Anderson, R. M., Musch, D. C., Nwankwo, R. B., Wolf, F. M., Gillard, M. L., Oh, M. S., et al. (2003). For the patient. eye screening can prevent eye
disease. personalized follow-up increases return rate at urban eye disease screening clinics for African Americans with diabetes: Results of a
randomized trial. Ethnicity and Disease, Winter(13), 149.
Basch, C. E., Walker, E. A., Howard, C. J., Shamoon, H., & Zybert, P. (1999). The effect of health education on the rate of ophthalmic examinations among African Americans with diabetes mellitus. American Journal of Public Health, 89(12), 1878-1882. doi:10.2105/AJPH.89.12.1878
Biese, K., LaMantia, M., Shofer, F., McCall, B., Roberts, E., Stearns, S. C., et al. (2014). A randomized trial exploring the effect of a telephone call follow-up on care plan compliance among older adults discharged home from the emergency department. Academic Emergency Medicine, 21(2), 188-195. doi:10.1111/acem.12308
Centers for Disease Control and Prevention (CDC). (2011). Reasons for not seeking eye care among adults aged >/=40 years with moderate-to-severe visual impairment--21 states, 2006-2009. Morbidity and Mortality Weekly Report, 60(19), 610-613. doi:mm6019a3 [pii]
Chou, C., Barker, L. E., Crews, J. E., Primo, S. A., Zhang, X., Elliott, A. F., et al. (2012). Disparities in eye care utilization among the United States adults with visual impairment: Findings from the behavioral risk factor
surveillance system 2006-2009. American Journal of Ophthalmology, 154(6), S45-S52.e1. doi:10.1016/j.ajo.2011.09.025
Chou, C., Sherrod, C. E., Zhang, X., Barker, L. E., Bullard, K. M., Crews, J. E., et al. (2014). Barriers to eye care among people aged 40 years and older with diagnosed diabetes, 2006–2010. Diabetes Care, 37(1), 180-188. doi:10.2337/dc13-1507
Chou, C., Zhang, X., Crews, J. E., Barker, L. E., Lee, P. P., & Saaddine, J. B. (2012). Impact of geographic density of eye care professionals on eye care among adults with diabetes. Ophthalmic Epidemiology, 19(6), 340-349. doi:10.3109/09286586.2012.722244
DiMatteo, M. R. (2004). Variations in patients' adherence to medical
recommendations: A quantitative review of 50 years of research. Medical Care, 42(3), 200-209. doi:00005650-200403000-00002 [pii]
Elam, A. R., & Lee, P. P. (2013). High-risk populations for vision loss and eye care under-utilization: A review of the literature and ideas on moving forward. Survey of Ophthalmology, 58(4), 348-358.
doi:10.1016/j.survophthal.2012.07.005 [doi]
Ellish, N. J., Royak-Schaler, R., & Higginbotham, E. J. (2011). Tailored and targeted interventions to encourage dilated fundus examinations in older African Americans. Archives of Ophthalmology, 129(12), 1592-1598. doi:10.1001/archophthalmol.2011.190 [doi]
Glanz, K., Beck, A. D., Bundy, L., Primo, S., Lynn, M. J., Cleveland, J., et al. (2012). Impact of a health communication intervention to improve glaucoma treatment adherence. Archives of Ophthalmology, 130(10), 1252-1258. doi:10.1001/archophthalmol.2012.1607
Gwira, J. A., Vistamehr, S., Shelsta, H., Bashford, K., Forster, S., Palmisano, P., et al. (2006). Factors associated with failure to follow up after glaucoma screening: A study in an African American population. Ophthalmology, 113(8), 1315-1319.e1. Retrieved from
http://www.sciencedirect.com/science/article/pii/S0161642006005653 Halbert, R., Leung, K., Nichol, J., & Legorreta, A. (1999). Effect of multiple patient
reminders in improving diabetic retinopathy screening - A randomized trial.
Diabetes Care, 22(5), 752-755. doi:10.2337/diacare.22.5.752
Henry, S. R., Goetz, M. B., & Asch, S. M. The effect of automated telephone appointment reminders on HIV primary care no-shows by Veterans.
Journal of the Association of Nurses in AIDS Care, 23(5), 409-418. Retrieved from
http://nursesinaidscarejournal.org.marlin-prod.literatumonline.com/article/S1055-3290(11)00239-1/abstract Kosoko, O., Quigley, H. A., Vitale, S., Enger, C., Kerrigan, L., & Tielsch, J. M.
(1998). Risk factors for noncompliance with glaucoma follow-up visits in a resident’s eye clinic. Ophthalmology, 105(11), 2105-2111. Retrieved from http://www.sciencedirect.com/science/article/pii/S0161642098911344 Kowing, D., Messer, D., Slagle, S., Wasik, A., & V-POAG Study Group. (2010).
Programs to optimize adherence in glaucoma. Optometry, 81(7), 339-350. Doi:10.1016/j.optm.2009.09.021 [doi]
38
Lee, D.J., Lam, B.L., Arora, S., et al. (2009). Reported eye care utilization and health insurance status among us adults. Archives of Ophthalmology, 127(3), 303-310. doi:10.1001/archophthalmol.2008.567
Li, Y., Xirasagar, S., Pumkam, C., Krishnaswamy, M., Bennett, C. L. (2013). Vision insurance, eye care visits, and vision impairment among working-age adults in the United States. Journal of American Medical Association Ophthalmology, 131(4), 499-506. doi:10.1001/jamaophthalmol.2013.1165 Lim, M. C., Watnik, M. R., Imson, K. R., Porter, S. M., & Granier, A. M. (2013).
Adherence to glaucoma medication: The effect of interventions and association with personality type. Journal of Glaucoma, 22(6), 439-446. doi:10.1097/IJG.0b013e31824cd0ae
Murakami, Y., Lee, B. W., Duncan, M., Kao, A., Huang, J. Y., Singh, K., et al. (2011). Racial and ethnic disparities in adherence to glaucoma follow-up visits in a county hospital population. Archives of Ophthalmology, 129(7), 872-878. doi:10.1001/archophthalmol.2011.163 [doi]
Murray, C. J. L., Vos, T., Lozano, R., Naghavi, M., Flaxman, A. D., Michaud, C., et al. (2012). Disability-adjusted life years (DALYs) for 291 diseases and injuries in 21 regions, 1990-2010: A systematic analysis for the global burden of disease study 2010. The Lancet, 380(9859), 2197-2223. Retrieved from
http://www.sciencedirect.com/science/article/pii/S0140673612616894 National Eye Institute. (2014). Age-related eye diseases. Retrieved 6/10, 2014,
from https://www-nei-nih-gov.ezproxy.bu.edu/healthyeyes/aging_eye.asp Owsley, C., McGwin, G., Scilley, K., Girkin, C. A., Phillips, J. M., & Searcey, K.
(2006). Perceived barriers to care and attitudes about vision and eye care: Focus groups with older African Americans and eye care providers.
Investigative Ophthalmology & Visual Science, 47(7), 2797-2802. doi:10.1167/iovs.06-0107
Paksin-Hall, A., Dent, M. L., Dong, F., & Ablah, E. (2013). Factors contributing to diabetes patients not receiving annual dilated eye examinations.
Ophthalmic Epidemiology, 20(5), 281-287. doi:10.3109/09286586.2013.789531
et al. (2010). Reduction of missed appointments at an urban primary care clinic: A randomised controlled study. BMC Family Practice, 11, 79-2296-11-79. doi:10.1186/1471-2296-11-79 [doi]
Qiu, M., Wang, S. Y., Singh, K., & Lin, S. C. (2014). Association between visual field defects and quality of life in the united states. Ophthalmology, 121(3), 733-740. doi:10.1016/j.ophtha.2013.09.043 [doi]
Vervloet, M., Linn, A. J., van Weert, J. C. M., de Bakker, D. H., Bouvy, M. L., & van Dijk, L. (2012). The effectiveness of interventions using electronic reminders to improve adherence to chronic medication: A systematic review of the literature. Journal of the American Medical Informatics Association, doi:10.1136/amiajnl-2011-000748
Wagner, L. D., & Rein, D. B. (2013). Attributes associated with eye care use in the United States: A meta-analysis. Ophthalmology, 120(7), 1497-1501. doi:10.1016/j.ophtha.2012.12.030
Walker, E., Schechter, C., Caban, A., & Basch, C. (2008). Telephone intervention to promote diabetic retinopathy screening among the urban poor.
American Journal of Preventive Medicine, 34(3), 185-191. doi:10.1016/j.amepre.2007.11.020
Zhang, X., Cotch, M. F., Ryskulova, A., Primo, S. A., Nair, P., Chou, C., et al. (2012). Vision health disparities in the united states by Race/Ethnicity, education, and economic status: Findings from two nationally
representative surveys. American Journal of Ophthalmology, 154(6, Supplement), S53-S62.e1.