IMPROVING COMMUNICATION OF SCHEDULING INFORMATION OF EARTHWORK CONSTRUCTION PROCESS USING 4D VISUALISATION MODEL IN ROAD PROJECTS
R. K. Shah
Ph. D. Student, Centre for Construction Innovation Research (CCIR), School of Science & Technology, University of Teesside, UK
N. Dawood
Professor, School of Science and Technology (SST), University of Teesside, Middlesbrough, UK
ABSTRACT
Innovative visualization technology applied to construction simulation and optimization has the potential to improve communications and coordination amongst the project stakeholders. In this context and in the drive for innovation in construction management, this paper introduces a framework of a 4D prototype for the automatic generation of visual terrain surfaces during earthwork construction processes. The framework has been designed and developed by integrating road design data, quantities of cut and fill, productivity models, algorithms for modelling terrain profiles and a road profile visualiser. The paper details the prototype of 4D visualization model (4DVM) that has been designed and developed in this research using innovative methodology where 4D models of terrain surfaces are generated based on coordinate data and the productivity of earthwork. The model has been demonstrated with a case study that was used to validate the model. The 4DVM is intended to assist project planners/construction managers in logical decision making processes for construction scheduling and resource planning. It will also improve the communication gap amongst the construction team and consequently improve site coordination and operations.
KEYWORDS
Earthwork operations, innovative methodology, road profile generation, schedule communication, 4D visualization model (4DVM).
1. INTRODUCTION
Construction industry is very traditional and there is a lack of process visualization particularly in construction planning and scheduling. Retik et. al. (1990) explored the potential application of computer graphics to construction scheduling to represent scheduling of construction progress in terms of graphical images at any time during the construction process.
Williams (1996) designed a demand-driven 4D model for the generation of a graphical construction plan based on simulation, visualization, and communication. In a large scale project, a visual representation of the schedule can be extended to monitoring not only the construction progress, but also all the auxiliary activities, including onsite plant and equipment (Adjei-Kumi et al. 1996). Collier and Fischer (1996) demonstrated visual-based 4D modelling and scheduling in a case study of the San Mateo County Hospital. McKinney et al. (1996) proposed a 4D computer-aided design (4D-CAD) tool with visual and communicative functions to facilitate the design process.
Note: * contacting author
Adjei-Kumi and Retik (1997) applied the concept of virtual reality to visualize construction plans using library-based 4D models. McKinney et al. (1998) demonstrated the capability of 4D-CAD models to identify construction problems prior to their actual occurrence. Andrej, T., Branko, K. and Danijel, R. (1999) introduced a new level of support to engineers throughout the product life cycle to deal with a platform independent language for 3D visualisation and product modelling using roads as an example.
(CPM) to provide information regarding the spatial aspects of a construction plans, have motivated the research effort to incorporate visualisation into project scheduling and progress control (Koo and Fischer 2000). Dawood et al (2002) developed an integrated database to act as information resource base for 4D/VR construction process simulation.
The work has been applied to a building project in the UK.
Kamat and Martinez (2003) described a general purpose visualisation system that can generate accurate 3D objects of construction operations and the resulting products.
Dawood et. al. (2005) introduced innovative visual planning tools aiming to assist construction planners to make accurate and informed planning decisions of the spatial aspect of activity during execution of construction projects and concluded that the visual planning tools need to be practical and add high value to communications. Ragip A.
(2005) introduced a new approach for geometric based modelling and simulation of construction processes. Several research efforts in the visualisation of construction planning have been conducted and linked to scheduling; they are, however, mostly in the building construction and there has been limited research in infrastructure construction projects. For example, Liapi (2003) focused on the use of visualisation methods during construction of highway projects to facilitate collaborative decision making on construction scheduling and traffic planning, however, this research ignored the visualisation of construction schedules for the intermediate stages of the construction processes.
Castro and Dawood (2005) developed “RoadSim” simulator system, which is a construction site knowledge based simulation system, is used to develop master construction schedules in road projects based on calculated productivity of road earthwork activities under available resources with a different set of equipment and site working conditions. The productivity of earthwork activity provided by the RoadSim has been considered as one of inputs in this research. Kang et. al. (2006) suggested an approach to simulate 4D models for the movement of earthwork activity for the intermediate stage of construction process in civil engineering projects using morphing techniques for the realisation of construction processes in the graphical form. 4D modelling of earthwork operations were developed in a 3DCAD model with equal volume at different stages during construction operations and linked with the construction schedule.
Previous research efforts did not address the interface of production rate, which is based on available resources and site conditions for the development of 4D models. The key issue faced in road construction is variable productivity from one day to another due to the special characteristics of the road construction projects such as fluctuation in daily weather conditions, working conditions in open sky, resource unavailability in time and other unpredictable factors. The study focuses on integrating the variable productivity due to the aforesaid reasons by introducing new approach for the automatic generation of terrain surface with the variable production rate provided throughout the earthwork construction operations.
This paper presents innovative methodology for the development of 4D modelling (3D surface based on coordinate data plus time derived from productivity) of earthwork construction processes applied in road projects. The model generates terrain surfaces road profiles automatically using variable productivity data at intermediate stages during the earthwork processes. The model is intended to assist in improving the communication of road construction scheduling information and to produce efficient construction scheduling and resource planning. The remainder of this paper introduces the framework of the prototype, terrain surface generation, case study demonstration and conclusion followed by acknowledgement and references.
2. FRAMEWORK OF THE 4D VISUALISATION MODEL
The general specification of the framework 4D visualisation model (4DVM) is outlined in figure 1. The framework integrates road design data, sectional quantities of cut and fill, productivity models, algorithms for modelling terrain profiles and a road profile
visualiser. The model assists in generating visual terrain surfaces of road profiles throughout the earthwork operations. The next section describes in detail the input, process and the output of the 4DVM.
Figure 1: Frame
work specifi cation of 4D visualisation model (4DVM).
2.1 INPUT
The sectional quantities of cut/fill of earthwork activity along the working road section, productivity of the activity and construction site knowledge base are key components of the framework. The sectional cut/fill quantities are calculated using the road design data such as L-section and X-section at required intervals of chainage. The productivity of earthwork activity is produced by “RoadSim” simulator developed by the Castro and Dawood (2005). This is based on available resources, equipment sets and site working conditions. This is incorporated with the model to determine the total duration of the earthwork operations. The soil characteristics along the working road section, types of available equipment set for a selected activity, haulage distance of soil, working conditions and all other factors including weather conditions that control productivity has been incorporated within the “RoadSim” simulator.
Additionally, the construction knowledge base assists in identifying the possible location and numbers of site access points, methods of construction for different types of soils, selection of equipment set for a particular activity and soil characteristics. The site operational knowledge-base assists in establishing sequential relationships amongst listed activities during the construction operations. The following section describes and demonstrates the process of a detailed schedule development including the information flow diagram.
2.2 PROCESS
The process of the framework includes two modules, these are: data module and
visualisation module. The data module processes the Input data to produce a detailed schedule and to generate the coordinate data of terrain surfaces based on production rate i.e. on weekly basis in this study. The visualisation module processes the coordinate data produced by the data module and converts it into terrain surfaces of the road profile in a regular triangular grid. The difference of level with a colour index shows the height of cuts and fills with a red and blue colour respectively. Details of schedule development, mathematical formula derivation and algorithms for terrain generation are presented in sections 2.2.1, 2.2.2 and 2.2.3 respectively.
2.2.1 SCHEDULE DEVELOPMENT
The flow chart of schedule development presented in Figure 2 shows the main steps of input, processing and output of activities together with a logical interaction for the development of details schedule. The lists of sections are defined at required intervals along the road using an L-section profile. Road design data such as L-section & Xsection are used to identify list of locations as per the required interval and accuracy. Site information provides possible initial points where earthwork operations can start and the information concerning haulage distance and access routes condition for the transportation of soil mass from borrow pit to site and depositing the extra or unsuitable soil mass at dumping sites. The location of access point is a key factor that affects construction planning and visual scheduling. The mass quantity is calculated at every listed locations of a road project. In this study, “RoadSim” is used to identify productivity information and required resources at selected locations and construction activities. The productivity is used to determine the duration of activities and the precedence relationship between activities is established based on the construction operation knowledge base.
Figure 2: Information flow diagram of schedule development.
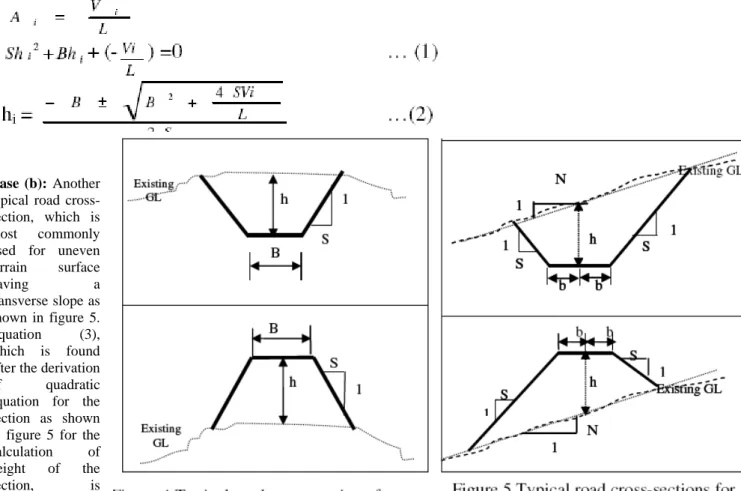
2.2.2 MATHEMATICAL FORMULA DERIVATION FOR HEIGHT CALCULATION:
The typical cross-sections shown in figures 4 and 5 are commonly applied and are thus considered to formulate the mathematical formula for the shapes shown in case (a) and
(b). There are other typical sections that are rarely used and are not considered in this paper.
Case (a): A typical road cross-section, which is mostly used in road project as shown in figure 4, is used to demonstrate how the height is calculated at different stages of cutting and filling.
During the derivation of a mathematical formula, the following assumptions are made: • Road cross-section is considered as a trapezoidal shape having side slope S: 1. • Ai = Cross-sectional area of trapezoidal at section i. = Bhi + Shi
• i = number of section varies from (i = 1……..n) along the road. • S: 1 = Horizontal: Vertical
• B = Design Width of Road
• h = Height between exiting ground level and design level at a road section. • Vi = Volume of earthwork for Cut/Fill at section i
• L= length between two sections.
Case (b): Another typical road cross-section, which is most commonly used for uneven terrain surface having a transverse slope as shown in figure 5. Equation (3), which is found after the derivation of quadratic equation for the section as shown in figure 5 for the calculation of height of the section, is presented below:
Where:
• hi = height of cross-section at section i
• i = number of section varies from (i = 1……..n) along the road. • N = Transverse slope of existing ground Horizontal: Vertical (N: 1) • S = Side slope of cross-section Horizontal: Vertical (S: 1)
• b = half width of road section.
• Vi = volume of mass earthwork Cut/Fill at cross-section i • L = Length between two section.
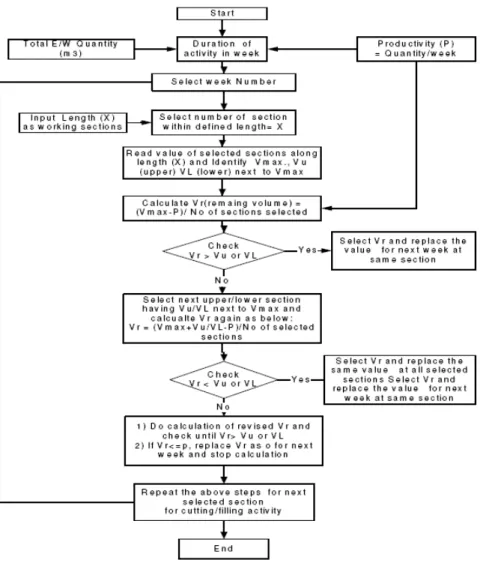
2.2.3 TERRAIN SURFACE GENERATION
To automate the generation of terrains of earthwork activities at different stages of the construction process, a set of algorithms have been developed. This was based on quadratic equations which determine progress for earthwork activity. A flow diagram of the arithmetic algorithms presented in figure 3 is used for calculation of weekly coordinate data of terrain surfaces. Figure 3 describes the stepwise process for the height calculation of cutting and filling sections using the algorithms presented in Equations 2 and 3.
Figure 3 Flow diagrams of arithmetic algorithms of data generation of terrain surfaces.
According to the construction site knowledge rule, top points of cut and fill sections is selected at first to start the excavation operation and excavating horizontally at rate of production based on available resources for a period of time such as a weekly basis considered in the study . The remaining earthwork profile at the excavated section along a road section is determined by reducing the production for a selected period. The
height of the remaining section is identified using equations 2 or 3 depending upon the type of road cross-section. This process is repeated until the final design level of the road is achieved as defined in L-cross-section. The production rate determines the duration for the selected section. Similarly the next working section for cut and fill is selected where soil mass allocation is suitable and the process is repeated to complete the earthwork operations of a road project.
3. CASE STUDY DEMONSTRATION
A 1.0 km (98+000 to 99+000) section from station no 1 to 41 of lot no. 3 a road project in Portugal was selected for a real life case study. The 4DVM model for earthwork operations is demonstrated with the case study. For this purpose, road design parameters and geometric data of L - section and X-section is considered and sectional quantity of earthwork is calculated assuming the typical trapezoidal sections having side slopes 1.5:1 and at 25 m intervals along the selected road section. The site access points are identified for cut/fill operations according to site conditions and the construction site knowledge. The site access points and productivity data provided by “RoadSim” system are the key inputs of the model and Equation (2) is used to determine visual terrain model based on variable equipment productivity and soil types.
The outputs of the model are virtual terrain surface of road profiles that were generated on a weekly basis throughout the construction period of 7 weeks to complete the earthwork operations of the road project. The output of the model includes; virtual surface of progress profiles generated by the model during earthwork operations and presented in figures 6 (a) and 6(b). Figure 6 (a) shows the ground profiles and corresponding
terrain surface at the end of week 1 and figure 6 (b) shows virtual terrain of earthwork progress profiles generated by the model from week 1 to 3 during earthwork operations including location of transforming the earthwork quantity from cut to fill section.
4. CONCLUSION
The research has introduced an innovative methodology and developed a prototype of 4D visualisation model (4DVM) using the methodology to visualise the earthwork construction process throughout the road construction operations. The developed model used coordinate data to generate terrain surfaces and time as the 4th dimension, derived from the productivity of earthwork activities. This is considered as a new approach
for 4D modelling of earthwork. The 4DVM represents the virtual construction progress profiles of earthwork activities.
The 4DVM generates visual terrain surfaces throughout the construction process of earthwork operations based on productivity data calculated by the “RoadSim”. The model has flexibility to interface with user defined variables such as productivity data and site access points according to topographical constraints; this is considered as the key achievement of this research study. The model will assist project planners/construction managers to analyse “what-if” scenario through visual simulation during the construction scheduling and resource planning processes.
The paper concludes that the new approach introduced by the research to design and develop the 4DVM for automatic generation of terrain surface throughout earthwork operations is considered to be a new methodology to visualise the earthwork construction process. The model will facilitate a logical decision-making process for construction scheduling and resources planning activities and will consequently improve communication gap between construction teams and improve the coordination amongst the project stakeholders.
ACKNOWLEDGEMENTS
The present research was supported by the Centre for Construction Innovation and Research (CCIR), University of Teesside, UK and Portugal based International
Construction Company, MOTA-ENGIL. Sincere appreciation is given to the sponsor from the authors.
REFERENCES
Adjei-Kumi, T., and Retik, A. (1997), ‘‘A library-based 4D visualization of construction processes’’, Proc., Information Visualization Conf., Institute of Electrical and Electronics Engineers, Piscataway, N.J., 315–321. Adjei-Kumi, T., and Retik, A. and Shapira, A. (1996), ‘‘Integrating on site tasks into planning and scheduling of construction projects.’’, Proc., shaping theory and practice, managing the construction project and managing risk: Int. Symp. On organization and management of construction, D.A. Langford and A. Retik., eds., E & FN Spon, Glasgow, U.K., 283-292.
Adrian, J.J., (1994): “Short Interval Scheduling: A technique for increasing productivity”, Construction and Real Estate Newsletter, Vol.10, No.2
Andrej, T., Branko, K. and Danijel, R.(1999), “Fast 3D Visualization of Road Product
Models”, Proceedings of the 1999 International Conference on Information, Visualisation, pp, 572 , 1999. Castro, S. and Dawood, N. (2005), “RoadSim: A Road Construction Knowledge-Based
Simulation System”, Proceedings of the CIB W102 Conference, 2005, Lisbon, Portugal.
Chau, K.W., Anson, M., and Zhang, J. P., (2004), “Four- Dimensional Visualisation of construction Scheduling and Site Utilization”, Journal of Construction Engineering and Management, ASCE 130 (4) pp. 598-606
Collier, E., and Fischer, M. (1996), ‘‘Visual-based scheduling: 4D modelling on the San Mateo County Health Centre’’ Proc., 3rd Congress on Computing in Civil
Engineering, ASCE, New York, 800–805.
Dawood N., Eknarine S., Mallasi, Z. and Hobbs B. (2002) “Development of an integrated information resource base for 4D/VR construction processes simulation” Automation in Construction, (12) pp 123-131 Dawood N., Scott D., Eknarine S. and Mallasi, Z. (2005) “The virtual construction site
(VIRCON) tools: an industrial evaluation” IT Con. Vol. 10, pp 43-54
Kamat, V. R. and Martinez, J. C. (2003), “Automated generation of dynamic, operation level virtual construction scenarios” IT Con. Vol. 8 (2003), pp. 65-84.
Kang, L.S., Jee, S.B., Kim, C.H., Pak, S.Y., and Moon, H.S. (2006), “4D System for visualisation scheduling progress of horizontal construction project including earth work”, Proceedings of the CONVAR Conference 2006, 4-6 August,
Florida, USA.
Koo, B. and Fischer, M. (2000), “Feasibility study of 4D CAD in commercial construction” Journal of construction engineering and management, 126(4),
251-260
Liapi A. K. (2003), “4D visualisation of highway construction projects” Proceedings of the 7th International Conference on Information Visualisation (IV’03), 1093-
9547/03 ©2003 IEEE
McKinney, K., and Fischer, M. (1998), ‘‘Generating, evaluating, and visualizing construction schedules with CAD tools’, Automation in Construction, 7(6), 433–
447.
McKinney, K., Kim, J., Fischer, M., and Howard, C. (1996), ‘‘Interactive 4D-CAD’’, Proc., 3rd Congress on Computing in Civil Eng., ASCE, New York, 383–389
Ragip Akbas (2005), “Geometry based modelling and simulation of construction processes”, PhD Dissertation (CIFE technical Report #151).
Retik A., Warszawaski A, and Banai A. (1990) “The use of computer graphics as a scheduling tool”. Building and Environment; 25(2) pp. 132-142.
Retik, A. (1997), “Planning and monitoring of construction projects using virtual reality.” Project Management Journal, 97(1), 28-31
Williams, M. (1996), ‘‘Graphical simulation for project planning: 4D-planner’’, Proc., 3rd Congress on Computing in Civil Eng., ASCE, New York, 404–409.