Does Spatial Disaggregation Matter in Job
Creation and Destruction Flows?
Elena CEFIS
*
Roberto GABRIELE
†*Utrecht School of Economics, Utrecht University, and University of Bergamo
†
DISA, University of Trento
2005/09
May 2005
L
L
E
E
M
M
Laboratory of Economics and Management
Sant’Anna School of Advanced Studies
Piazza Martiri della Libertà, 33 - 56127 PISA (Italy)
Tel. +39-050-883-343 Fax +39-050-883-344
Email: [email protected] Web Page: http://www.lem.sssup.it/
Does spatial disaggregation matter in job creation and
destruction flows?
∗
Elena Cefis
†Utrecht School of Economics, Utrecht University and Bergamo University
Roberto Gabriele
‡D.I.S.A. - Trento University
March, 2005
Preliminary Version
Abstract
The paper investigates the changes in job creation and destruction flows considering a very disaggregate level of analysis. If institutional setup plays a more important role compared to other factors, than at lower levels of aggregation we should observe that job flows regularities are in line with national ones. We explore the issue using a unique database on the population of firms in Trentino (a North-Eastern Province of Italy) from 1991 to 2001. We find that: (a) job flows show a ”fractal” nature, i.e. many regularities appear to be scale invariant (magnitude of flows and their persistence). In particular job flows magnitude is in line with the average values for Italy; (b) there are some qualifications to ”fractality”: entrant firms’ contribution to job creation process is lower than the corresponding contribution at national level, whereas the job destruction share accounted for by exit firms is around 30%, in line with stylized facts; (c) size and age shape the job flows; (d) shifts of jobs between macro sectors are rare.
Keywords: Labour reallocation, job flows, sample selection, two-stage Heckman estimator.
JEL-Codes: C34, J23, L11.
∗We would like to thank Rob Alessie, Giovanni Dosi, Christopher L. Gilbert, Giorgio Fagiolo, Karen Klomp, Paola Villa,
Enrico Zaninotto for interesting comments and helpful suggestions. We also thank Giampaolo Sassudelli (ISTAT, Trento) for the support in the database creation. The financial support of the University of Bergamo (grant ex 60%, n. 60CEFI04, Dept. of Economics) and of Provincia Autonoma di Trento is gratefully acknowledged. Usual disclaimers apply.
†Elena Cefis, Utrecht School of Economics, Utrecht University, Vredenburg 138, 3511 BG Utrecht, The Netherlands.
E-mail: [email protected]
‡Roberto Gabriele, Department of Management and Computer Sciences, University of Trento, Trento Italy. E-mail:
1
Introduction
One of the questions that arises when studying the flows of job creation and destruction is related to their pervasivity and their capacity of replicating regular patterns at different levels of analysis. Using
a new database (DM10TN) with data collected by INPS1(the Italian Social Security Institution) and
by the local bureau of ISTAT2 (National Statistics Institute), we explore a regional labour market
with a particular emphasis on job flow dynamics. The analysis can be considered a paradigmatic example of a local labour market analsysis based on “genuine” microdata obtained from the direct observation of the units of analysis (firms) on the field, without any filter or extrapolation from national data.
The paper investigates how job creation and destruction flows change when we consider a more disaggregate level of analysis. The issue is particularly important once we recognise as determinants of job flows institutional setups and/or idiosyncratic characteristics of firms. We can expect that if institutional setup plays a more important role compared to other factors, than at lower levels of aggregation we should observe job flow regularities to be in line with national ones. In other words, we could say that job flow regularities posses a “fractal” nature (Blanchflower, 1994). To be more precise, one can ask what regularities are eventually maintained when descending to lower levels of analysis. Moreover, it is interesting to investigate if the labour supply tightness of a local labour market can alter job flows.
The empirical and theoretical literature has often highlighted the importance of the analysis of job flows (Burda and Wyplosz, 1994; Davis et al., 1996; Blanchard and Diamond, 1990; Pissarides, 2000).
The general picture that emerges shows how labour markets are continually shaped by phenomena of creation and destruction of jobs. The magnitude of job flows is crucial for alternative theories of unemployment and salaries determination. On the one side, the large size of job flows in the United States has enhanced theories modelling unemployment as a frictional phenomenon (Pissarides, 2000). The geographical dispersion of jobs as well as the heterogeneity of the available skills with regard to firm requirements is, among others, a source of frictions in the labour market. On the other side, the persistence of job flows in the labour market limits the validity of theories based on the contraposition of different groups of employed (insiders) and unemployed (outsiders) that try to explain the existence of persistent positive unemployment rates in the economy.
The empirical studies on gross job flows represent an important step in the analysis of the employment dynamics at the firm/plant level. Davis and Haltiwanger (1999) find that the largest job flows characterise the youngest firms/plants. Their result establishes a solid relationship among the firm age and the firm heterogeneity. Furthermore, their analysis supplies empirical evidence of the importance of the market selection mechanisms and its effects in the evolution of industries (Dosi et al., 1995). In addition, the great magnitude of job flows shows the limits of modelling industrial dynamics using representative firms The relevant and persistent heterogeneity of firms implies that the aggregation processes function as smoothing mechanisms of the asymmetries and non-linearities of the employment dynamics at the firm level.
Olley and Pakes (1992) and Baily et al. (1996) show that reallocation of jobs and productive inputs from less efficient to more efficient firms explain a large fraction of the productivity gains at the industry level. More generally, job flows data are very useful in analysing the relationship between the reallocation process and the productivity and salary growth.
1INPS: Istituto Nazionale della Previdenza Sociale. 2ISTAT: Istituto Nazionale di Statistica.
Finally, job flows are a good instrument for investigating the nature of the business cycle and
its relation with the reallocation of jobs and employees. Different phases of business cycles are
characterised by different degrees of creation and destruction, but even if we observe an expansion (contraction) of the economy, job destructions (creations) are still present. We do observe contemporaneous creations and destructions that demonstrate the importance of heterogeneity of firms in labour market and of underlining selection processes (Davis et al., 1996).
In this study we make use of an original database,DM10TN, to address some of the most important
questions about local labour market functioning. The database collects observations on employees and on demographic aspects of the population of firms that are active in Trentino during the period 1991-2001. It provides monthly data on all the sectors in the economy, including manufacturing, construction, and services. In particular, we study the magnitude of job flows, their stability, and their cyclicity over the period analysed. We use different levels of disaggregation in order to disentangle sectoral dynamics, the role of firm size in shaping flows, and the role of firm age in changing labour market dynamics. Then we analyse the role of firms’ entry and exit processes and their contribution to job flows and labour market dynamics. Finally, an analysis of structural determinants of job creation and destruction is conducted.
The analysis reveals a sort of “scale invariant” nature of job flows for many aspects, as suggested by many researchers (cf. Faggio and Konings (2003), Stahl et al. (2002) and Barnes and Haskel (2002)). In fact, the study shows the role of institutional factors in governing job flows at local level, most of which are in line with the average values of Italy. Nevertheless, some of the national level patterns are not reproduced at local level. In particular, the magnitude of job flows due to incumbent firms at local level is in line with national level, whereas the role of entrant firms appears to be lower. Sectoral patterns of job flows are reproduced at local level, whereas the degree of shifts of jobs between sectors is reduced. in addition, results on persistence of job flows reveal that the majority of jobs created and destroyed represents permanent changes of employment levels for firms as it emerges for Italian job creations and destructions. The structural analysis of the determinants of job flows shows that observable heterogeneity explain part of the variance in job creations and destructions, even if unobservable heterogeneity plays a role.
The paper is structured as follows: section 2 and 3 respectively describe the data and the methodology, followed by the results in section 4 and 5. Section 6 concludes.
2
The data
The data used in the analysis come fromDM/10 forms submitted to INPS every month by employers
who hold residence in the province of Trento. The DM/10 model includes all the firms with at least
1 employee and has monthly frequency3. The data are physically collected by the local INPS office
and the local ISTAT office of Provincia Autonoma di Trento (PAT)4.
The available data are organised in a series of yearly data sheets for a period running from 1991 to 2001. A single record in these tables regards a social security declaration of an employer with at least 1 employee residing in the province of Trento. The data cover the population of employers who are residents of the province of Trento during the period under analysis. There are two remarks to make about the coverage: (a) The data are missing for the year 1997 and for some months in other years; (b) There is a neglectable reduction in the population size due to errors in the data collection
3Details about DM/10 model can be found in Gallo (2003).
and/or in the inputations/transcriptions of data sheets into the database.
As we noted above the original database is composed of records regarding the monthly social security registrations of employers. We rearranged the data in order to change the unit of observation. The structure of the survey allows employers to span their social security registrations over more than one record, given the different ATECO2002 sector the workers are employed. Hence, we group records corresponding to the same firm into a single record looking at legal ID of the employer linked to each observation. The resulting database refers to ”firms” identifiable through their legal ID. Moreover, we merge the yearly files into a panel in which all the information is collected.
The panel is composed of around 24000 observations per year, and the variables are divided into two groups: the first one with demographic information about the firms, and the second one containing the information about the employees of these firms.
The demographic section gives us the following information about the firms: id, ATECO2002 code (SIC code of 5 digits), day, month and year of entry into the data sheets, date of exit from the database, the age (in months of activity). The ATECO2002 code was assigned to each firm according to its prevalent activity identified by the sector in which the firm employs the higher number of workers.
The second part of database contains the following monthly variables for every firm: number of employees, job creations and destructions, job creation and destruction rates, net employment gains, net employment rates of change, total job reallocation, and excess job reallocation, job reallocation and excess job reallocation rates.
The data suffer a break for the year 1997 due to the changes in the Italian law concerning privacy. As a result ISTAT did not publish any data for that year.
We also calculate annual averages for the above variables and we group age and size into classes5.
3
Methodology
3.1
Basic definitions
The analysis of job destructions and creations uses many definitions and conventions that are currently well based in the literature dealing with labour market flows. In particular, the pioneering work of Davis et al. (1996) provides the guidelines for job flows analysis that we follow in our analysis.
A preliminary remark regards the non availability of microdata suited to measure the flows of jobs into and among firms directly, where a job is defined as an employment position filled by the
worker6. As a consequence, we employ a methodology that provides us with an estimation of the
number of jobs created and destroyed within a specified period of time.
The capacity of an economy to generate jobs can be measured by looking at employment level changes occuring during a certain interval of time.
The standard way to measure the jobs created in a firm is to look at the number of employees.
The job creations in a sectorI at timetis defined by the employment gains in expanding firms plus
5A detailed definition and a discussion about the size and age classes is provided below.
6In literature there are some studies that make ”direct” observations of job flows. They are only small sample data
collections and refer to a limited geographical region and for a limited period of time. One of these examples is the IDA database in which information about the Danish economy is collected. More information about it can be found on the Denmark statistic website at the address: http://www.dst.dk/HomeUK/Guide/Varedeklarationer/emnegruppe/. Another branch of literature deals with matched data employer-employees, cf. Abowd and Kramarz (1999).
the employees of the new entrant firms: J CIt= X i∈S+I (Nit−Nit−1) + X i∈EIt Nit, (1)
in which:J CItis the job creations at timetin sectorI;S+I is the set of expanding firms, andEItis
the set of the newcomers into the sector at timet.
In a similar way we measure job destructions at timetas the sum of the absolute value of losses
in the employment level of firms in the sector (S−I) and the losses of employees due to exits of firms from that sector (XIt):
J DIt= X i∈SI− |Nit−Nit−1|+ X i∈XIt Nit−1. (2) .
Once the levels of job creation and destruction have been defined, we can calculate their growth rates. These rates can be obtained by dividing job creation and destruction levels by a measure
of sector size. To start with, we define the size of a firmi as the average size in period (t, t−1):
Zit= 1/2(Nit+Nit−1),and the correspondent employment growth rate is given by:
git=
∆Nit
Zit
. (3)
Note that the growth rate is bound between [−2,2] and behaves symmetrically in contractions
and expansions7. The sectoral rate of job creation can be written as:
jcIt= X i∈S+,i∈EIt Zit ZIt git= J CIt ZIt . (4)
Similarly the job destruction sectoral rate is given by:
jdIt= X i∈S−,i∈XIt−1 Zit ZIt |git|= J DIt ZIt . (5)
Equations 4 and 5 show that sectoral rates of creation and destruction can be obtained through a weighted average of individual growth rates weighted with employment shares. Other important definitions are:
• the net employment growth rate: netIt =jcIt−jdIt, which gives us the net change in
employment level as a result of the job creation and destruction activities;
• the total job reallocation: jrIt = jcIt+jdIt, which is a measure of the degree of gross
“activity” of the labour market;
• theexcess job reallocation:xjrIt=jrIt− |netIt|, which provides an indicator of the labour
market capacity to reallocate jobs once we clear for the effect of growth.
It is worthwhile to note that the total job reallocation measures the overall capacity of the system to create and destroy jobs, whereas the excess job reallocation provides a measure of the job changes necessary to accommodate changes in employment.
All the measures introduced above can be calculated at system level -i.e. for the whole economy-using a natural extension of the meanings. It is possible to calculate the above rates for subsets of
the economy obtained through different disaggregation directions, namely age, size and regions. The above definitions apply directly.
3.2
The regression analysis
A second group of results is obtained through a regression analysis aiming to quantify the influence of structural determinants of job creation and destruction flows.
The first strategy is related to the so-called separate regressions,which we briefly introduce: we
divided firms into two groups: expanding firms and contracting firms. Then we estimated a linear regression using as dependent variable the rate of job creation for the first group, and the rate of job destruction for the second group.
However, such a procedure produces biased estimations of the parameters, due to a possible selection bias in the data. More specifically, during one year a firm can be in three different states: expansion, contraction and inaction, depending on the sign of its net employment change. Such subdivision is endogenous with respect to the firm’s characteristics, i.e. firms can be self-selected into one of the three groups due to their characteristics. To correct for such a bias, and consequently correcting estimation results, we use an alternative econometric model: a modified two stages Heckman estimator (HMM), which generates consistent estimations of parameters.
We consider three latent variables (jc∗i, jd
∗
i, I
∗
i) for which it is possible to write the following
equations: jc∗i =x 0 iβjc+ui,jc (6) jd∗i =x 0 iβjd+ui,jd (7) Ii∗=z 0 iγ+i (8)
xiis an array containing all the explanatory variables,ziis an array of variables that are used to select
firms. Equation 6 is the job creation equation, 7 is the job destruction equation, and 8 represents the self selection equation.
We define wi as the whole set of explanatory variables that are contained in xi and zi. Let
vi= (ui,jc, ui,jd, i). Finally we assume:
vi|wi∼N(0,Σ) (9)
in which the elements of the conditional variance-covariance matrix Σ are allowed to be nonzero. Note that the above stated hypothesis synthesises the endogeneity of selection. Our problem can be rewritten as follow: Ji= jci if Ii∗> µ + 0 if µ−< Ii∗< µ+ jdi if Ii∗< µ − (10)
in whichµ−andµ+ represent the thresholds entailed in self-selection equation 8 that allows firms to
Moreover, we do not fully observeIi∗, we only observe the variableIithat signals its sign: Ii= 1 if Ii∗> µ+ 0 if µ−< Ii∗< µ + −1i if Ii∗< µ − (11)
In these assumptions it can be shown that we can write the expectation ofjci conditional on: (a)
dependent variablesxi, and (b) an additional term representing the self-selection:
E[(Ji|wi, I ∗ i)> µ + ] =x0iβjc+E(ujc,i|wi, I ∗ i) =x 0 iβjc+ σ1, σ ·λ(µ +−z0 iγ σ ) (12)
where λ(.) is the inverse Mills’ ratio calculated at the point: µ
+−z0 iγ
σ . Similarly we can write the
expression for the conditional expectation of job destructionsjdi:
E[Ji|wi, Ii∗)< µ − ] =x0iβjd+E(ujd,i|wi, Ii∗) =x 0 iβjd+ σ2, σ ·λ∗(µ −− z0iγ σ ) (13)
whereλ(.)∗is the complement of the Mills’ ratio calculated at the point: µ −−z0
iγ σ .
¿From equations 12 and 13 we derive a more appropriate functional form to use in our analysis: two augmented regressions for job creation and destruction in which respectively the Mill’s ratio and its complement are present as additional explanatory variables. The joined estimation of these regressions can be made using a modified Heckmann two-stages procedure. The standard Heckmann procedure is composed of a first stage in which a ordered probit model with two possible outcomes for independent variable is estimated through a maximum-likelihood criterion. From this preliminary estimation it is possible to obtain an estimation of Mills’ ratio. The second step is a regression in
which the Mills’ ratio is included as regressor using the standard OLS estimator8.
The modification we use implies that the estimation of an ordered probit has three possible
outcomes at the first step instead of only two. The independent variable is represented by the
selectivity termIi -indicating the sign of the net employment change-, which, as we noted above,
can have three values: -1, 0, 1. The result of the probit estimation provides a consistent estimation of both the Mills’ ratio and its complement. We use such estimations in a second step in which
augmented regressions are estimatedvia OLS9.
Given the number of variables available we run the two stages using the same set of independent variables, which could raise an issue of identification of the system we estimate at the second stage. In this respect it is important to note that the non-linearity of Mills’ ratio -and of its complements-together with the assumption of linearity of second step functional forms ensure the identification of the system (Maddala (1985)).
8For details about the procedure see Greene (2003), p.784-787.
9See Frazis (1993) for an application of the same procedure on the study of degree effects on performances of a group
of students. Alonso-Borrego and Collado (2001) apply the method to study the role of innovation in job creation and destruction flows.
0 10000 20000 30000 40000 50000 60000 70000 80000 90000
Jan-91 Jan-92 Jan-93 Jan-94 Jan-95 Jan-96 Jan-98 Jan-99 Jan-00 Jan-01
Months
total number of employees
All macrosectors manufacturing construction services ma(12)
Figure 1: Monthly employment volumes in Trentino during the period 1991-2001: all the macrosectors together, manufacturing, construction, and services.
4
Results
4.1
Employment dynamics in Trentino during the period 1991-2001
A descriptive analysis of the evolution of employment is conducted to shed light both on the data available and on the framework in which we are going to conduct our analysis of job flows. Figure 1 presents monthly numbers of employees in the three macro-sectors and in the whole local economy.
The level of total employment in the period analysed is stable until 1996, and presents an
upward trend starting in 199810. From 1991 to 2001 the total number of employees increases from
around 70.000 to around 80.000. The main contribution to employment growth has to be accounted to services, while construction and manufacturing portray stability. In particular manufacturing suffered a decline during the 1996-1998, showing negative peaks at the end of those years. A general characteristic of the data is their seasonality: in particular services and construction show high monthly variability over a year. The highest number of employees in all macrosectors is reached in September, while a negative peak can be found in November. Services present the highest seasonality. Moreover, we observe an upward trend for services and construction starting in 1998, and a parallel increase in their contribution to overall employment.
4.2
Magnitude of flows
The first question to address is whether job flows phenomena in a local labour market present common traits with national ones. Table 1 shows the average values of flow rates for Italy, for some European countries, and for Trentino. The results of the comparison are interesting: Trentino shows flows of creation and destruction of a magnitude similar to cross-country patterns. The reallocation rate for Trentino is around 22%, and is in line with the results for Italy. We underline that the shortage of available data does not allow us to make comparisons over the same period of time. In particular, only recently INPS produces data until 1998 for Italy, but they have not been already used in any studies.
Additional information that can be derived from the table is about the contribution of entering firms to job creation process and of exiting firms to job destruction. Trentino entrant firms contribution to job creation process is below the average compared to national levels for European countries and in particular they result to be below the national average value: in Trentino one fifth of the job creation rate is explained by entrants, while the percentage for Italy raises to a half. Trentino exiting firms present a job destruction rate that is in line with the other exiting firms presented in the table.
An analysis of the evolution of the structure of flows over the years is provided in figure 2. The analysis takes into account yearly average job creation and job destruction rates, and the net employment changes for the whole economy. In the figure we also reported the GDP growth rate for the years 1992-2001. Cyclical features of job creation and destruction seem to be confirmed: job creation moves pro-cyclically and job destruction moves anti-cyclically. Net employment growth, calculated as the difference between yearly creation and destruction rates, is pro-cyclical too. In figures 3, 4, and 5 we also can observe the cyclical behaviour of the three macrosectors. These figures confirm the cyclical patterns observed at the aggregated level.
The break in data availability for 1997 distorts results for 1998, in that these appear to be not in line with the rest of the series. Both services and construction show a negative trend for job destruction and a positive one for job creation. The manufacturing macrosector presents a stable pattern for both job creation and job destruction rates.
These results show how the existence of job flows over the business cycle is pervasive at local levels too. Standard theoretical framework (Pissarides, 2000) that makes use of homogeneity of perfect rational agents and of equilibrium assumptions seems to be ill suited to deal with such evidence. Such empirical evidence provides a natural counterpart for an evolutionary view of the economic system (Nelson and Winter, 1982; Dosi and Winter, 2002). In particular, job flows can be interpreted as the result of the heterogeneity of firms -and workers- in labour markets. The heterogeneity of firms’ behaviour leads to differential competitive advantages and to selection in the market (Leombruni, 2003; Fagiolo et al., 2004).
4.3
Job flows and size of firms
There are many studies available emphasising the importance of small businesses (Barnes and Haskel, 2002; Davis and Haltiwanger, 1999; Picot and Dupuy, 1996). There is evidence that small firms are more ”active” in creating and destroying jobs than larger firms.
Several US studies revealed that most of the net creation of jobs is due to small firms (Birch, 1987). Subsequent analysis revealed that the proposition still holds even if the methodology used to measure the impact of small firms has to be changed slightly (Davis et al. (1996)). This observation has an important effect on the design of public policies, and it seems to be particularly crucial when
Co u n tr ies Time Job Creat ion Jo b Destruct ion Job R ea llo catio n Job Creat ion rate Job Destru cti on NET co v er ag e rat e rate rate En tries I ncum b en ts In cum b en ts Ex its Germa n y 1987-1992 9. 00 7. 50 16. 50 2. 50 6. 50 5. 60 1. 90 1. 50 ( 28% ) ( 72% ) ( 75% ) ( 25% ) F ran ce 1984-1991 12. 70 11 .80 24. 40 6. 10 6. 60 5. 50 6. 30 0. 90 ( 48% ) ( 52% ) ( 47% ) ( 53% ) Austria 1978-1998 8. 90 8. 90 17. 9 3. 10 5. 80 6. 00 3. 00 0. 00 ( 35% ) ( 65% ) ( 66% ) ( 34% ) Sw ed en 1987-1995 11. 2 12 .1 23. 30 5. 40 5. 80 10. 40 1. 70 -0. 90 ( 48% ) ( 52% ) ( 86% ) ( 14% ) U. K. 1985-1991 8. 70 14 .60 23. 30 2. 70 6. 00 9. 60 5. 00 2. 10 ( 31% ) ( 69% ) ( 66% ) ( 34% ) It al y 1987-1992 11. 00 10 .00 21. 00 3. 80 7. 20 6. 20 3. 80 1. 00 ( 35% ) ( 65% ) ( 62% ) ( 38% ) T ren tin o 1991-2001 11. 94 9. 53 21. 47 2. 20 9. 74 6. 37 3. 16 2. 41 ( 18% ) ( 82% ) ( 67% ) ( 33% ) T ab le 1: The role of exits an d e n tr ies in determini ng the fl o ws: a cross -coun try c ompar is on . Sour ce: authors’ own el ab or ations on da ta DM10T N , Stah l et al . (2002) and L eombr uni (2 003).
-4 -2 0 2 4 6 8 10 12 14 16 18 1992 1993 1994 1995 1996 1998 1999 2000 2001 year
jc, jd, net and PIL
Job Creation rate Job Destruction rate GDP changes Trentino (1995) net employment growth
Figure 2: Aggregate yearly job creation and destruction rates, net employment growth and rate of growth of GDP in Trentino over the years 1991-2001. Authors’ own elaborations on database DM10TN, PAT (2001) and PAT (1998). Manufacturing -5 0 5 10 15 20 25 1992 1993 1994 1995 1996 1998 1999 2000 2001 year jc, jd and PIL Job Creation rate Job Destruction rate rate of growth GDP Trentino (1995) net employment growth
Figure 3: Manufacturing macrosector’s yearly job creation and destruction rates, net employment growth and rate of growth of GDP in Trentino over the years 1991-2001. Authors’ own elaborations on database DM10TN, PAT (2001) and PAT (1998).
Construction -10 -5 0 5 10 15 20 25 1992 1993 1994 1995 1996 1998 1999 2000 2001 year jc, jd and PIL Job Creation rate Job Destruction rate rate of growth GDP Trentino (1995) net employment growth
Figure 4: Construction macrosector’s yearly job creation and destruction rates, net employment growth and rate of growth of GDP in Trentino over the years 1991-2001. Authors’ own elaborations on database DM10TN, PAT (2001) and PAT (1998)
Services 0 5 10 15 20 25 1992 1993 1994 1995 1996 1998 1999 2000 2001 year jc, jd and PIL Job Creation rate Job Destruction rate rate of growth GDP Trentino (1995) net employment growth
Figure 5: Services macrosector’s yearly job creation and destruction rates, net employment growth and rate of growth of GDP in Trentino over the years 1991-2001. Authors’ own elaborations on database DM10TN, PAT (2001) and PAT (1998)
we focus the analysis on local labour markets. In our case Trentino policies aimed to enhance the entrepreneurial activity in the Province for several years with different forms of incentives. In this respect, the main concern is related to the capacity of such policies in generating and sustaining the growth of employment and, in general, of the local economy. The analysis we propose tries to disentangle the role of small firms in generating new jobs.
The study of job creation and destruction for different firms’ sizes involves a subdivision of the firms into size classes. Such an operation utilises a measure of firms’ size that is ”arbitrary” in some senses; moreover, if the choice of a particular measure allows to underline phenomena of interest, might it pose some limitations and can induce some distortions that we need to know about.
A possible source of this class of distortions in organising data about plant and firm into size
classes using longitudinal data is pointed out by many authors as the ”distribution fallacy”11. The
distribution fallacy as noted by Davis et al. (1996) is related to the eventual migration of firms among the size classes into which firms are subdivided. The larger the migration, the higher the overestimation of the relative weight of small firms in creating or destroying jobs. In addition the problem could be exacerbated by the temporary nature of these fluctuations.
Hence, the estimation of creations and destructions for firms divided into size classes has to be done carefully and with the aim of reducing the possible distortions. The problem can be tackled with the choice of the right ”measure” of firm size that is able to limit the distribution fallacy.
In literature there are at least three different size’s measures to adopt when using longitudinal data: (a) base year employment size; (b) current average size; (c) long run average size. The first method uses the base year employment of firms as a measure of the firm’s size. The current average size measure utilises the average number of employees in two contiguous periods. The last measurement of size makes use of the average number of employees over a long period of time to smooth employment
-and the consequent temporary migrations in the classes12. The use of the methods reveals substantial
changes in results and in the consequent interpretations. For example, studies on small U.K. firms show that when the average size method is used the rates of creations (destructions) accounted for by small firms are sensibly lower (higher) than when the corresponding estimations are done using the base year size measurement (Barnes and Haskel (2002) table n.12).
We use long average size measure to analyse the role of size in shaping job flows. In particular we consider long run average size as the average number of employees, where the average is computed referring to yearly employees for the period of time available.
Table 2 reports the contributions to job creations as a percentage by each size class.
Small firms from 1 to 9 employees are responsible for the majority of creations and destructions in the system. With current average measure of size we find that 50% of creations and 71% of destruction are concentrated in this class. Other classes present shares of creations and destructions that do not exceed 14%. An additional clear pattern emerges from the table: the contributions of classes to job flows decrease as we consider those classes that refer to larger firms. In particular job destruction seems to be more concentrated when compared to job creation in classes accounting for smaller firms. Once we consider long run average measure of size instead of current average measure of size, we find that the contribution of small firms to creations is exacerbated while their contribution to destruction is mitigated. The first class, from 1 to 9 employees, accounts for 60% of creations and for 59% of destructions.
The above results confirm the important contribution of smaller firms to flow dynamics in absolute
11Cf. Baldwin et al. (1998), Barnes and Haskel (2002) and Davis et al. (1996).
12Note that the long average size method overcomes other problems like the measurements errors and the transitory
current average size
jc jd jr xjr net
All Macrosectors average values 11.94 9.53 21.47 19.06 2.41
from 1 to 9 empl. 15.98 13.27 29.25 26.54 2.71 from 10 to 19 11.12 6.36 17.48 12.73 4.75 from 20 to 49 10.45 5.02 15.47 10.04 5.43 from 50 to 199 8.88 4.54 13.42 9.09 4.33 from 200 to 499 8.96 3.31 12.27 6.62 5.65 500+ 7.02 3.86 10.88 7.71 3.17
long run average size
jc jd jr xjr net
All Macrosectors average values 11.94 9.53 21.47 19.06 2.41
from 1 to 9 empl. 16.84 13.29 30.13 26.58 3.55 from 10 to 19 10.53 8.12 18.65 16.24 2.41 from 20 to 49 8.97 7.13 16.09 14.25 1.84 from 50 to 199 7.23 6.18 13.41 12.36 1.05 from 200 to 499 9.67 6.54 16.21 13.07 3.13 500+ 5.24 6.02 11.26 10.49 -0.77
Table 2: Job flows by size classes using current and long average estimations: comparative results.
Legenda: jc: job creation rate, jd: job destruction rate, jr: job reallocation rate, xjr: excess job reallocation, net: net employment growth.
terms. An open question regards the relative capacity of smaller firms in creating and destroying jobs. One can argue that, even if their contribution to flows is high in the Trentino economy, this fact can be accounted for by the bias towards small firms that this local economy exhibits, but nothing can be concluded about the capacity of firms of different sizes in creating and destroying jobs. To disentangle the dynamic capacity of firms we calculate job creation and destruction rates for each class. Table 2 shows disaggregated rates of creation and destruction for different size classes. The two different measures presented in the two sections of the table do not show significant differences related to patterns of job creation and destruction rates, but some differences do emerge in the excess job reallocation rate and the net employment growth. Both measures indicate: the smaller the size of firms, the higher the corresponding job creation and destruction rate. The reallocation rate for the class of 1-9 employees is around 36% and it decreases as we move towards larger firms’ classes, reaching its minimum value at 10%. The role played by small firms becomes clearer if we consider the excess job reallocation rates. A negative correlation between firms’ size and excess job reallocation is evident: the small firms excess reallocation rate is around 32% and it declines when the classes are grouping larger firms; the reallocation rate for firms with over 500 employees reaches 9.6%. The size of firms matters wih respect to the capacity of reallocating jobs. Once we clear the distortions entailed in the current average measure using the long average measure, we are able to reassess the capacity of growth of small firms. The average growth rate of employment on annual base is around 3%, and small firms account for a rate of growth of around 5% for the first class, a value that is above the average. The growth rate declines with the size, the only exception being the class from 200 to 499 employees with a rate of 3.36%. The last result is in line with evidence presented by Picot and Dupuy (1996) for Canadian firms in the period 1978-92.
0.00 10.00 20.00 30.00 40.00 50.00 60.00 70.00 80.00 from 1to 9
empl. from 10 to 19emp. from 20 to 49emp. from 50 to 199 emp. from 200 to499 emp. 500+ size classes (long average)
percentages of job creation
manufacturing construction services
Figure 6: Average percentage contribution to job creation over the years 1991-2001 by size classes using annual data and long average size measure.
jc jd jr xjr net All Macrosectors 11.94 9.53 21.47 19.06 2.41
manufacturing 9.90 9.09 18.99 18.18 0.81
construction 13.26 12.23 25.49 24.46 1.02
services 13.18 8.99 22.17 17.97 4.19 Table 3: Average job flows over the period 1991-2001 for macrosectors.
4.4
The sectoral distribution of flows
The macrosectors show different dynamics in terms of job flows. Table 3 present the average annual job flows for the three macrosectors. The manufacturing sector presents a lower level of job creation and destruction than services and construction. The higher job reallocation rate presented by services is explained by a high job creation rate -with a correspondent lower job destruction rate than other the macrosectors. As a consequence, most of the net creation of jobs can be attributed to the services sector.
Looking at excess job reallocation we can see that the services sector has lower gross reallocation to create jobs compared to other macrosectors, due to the lowest job destruction rate. This empirical evidence is in line with stylised facts, cf. Davis and Haltiwanger (1999).
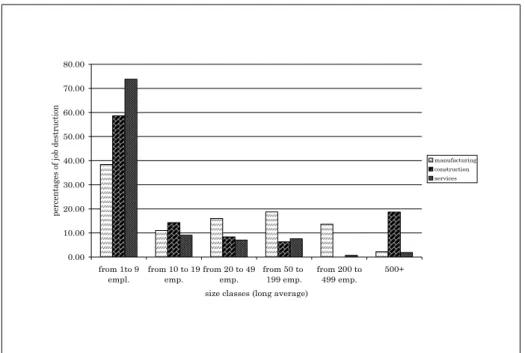
Figures 6 and 7 present, respectively, the percentage distribution of job creations and job destructions,
both by macrosectors and size classes using the long average method13. The macrosectors show a
common pattern regarding the relatively high number of creations and destructions in firms of the first size class (1-9 employees) compared to the other classes. Small manufacturing firms give smaller contribution to total job creations and destructions than small firms in the other macrosectors;
0.00 10.00 20.00 30.00 40.00 50.00 60.00 70.00 80.00 from 1to 9
empl. from 10 to 19emp. from 20 to 49emp. from 50 to 199 emp. from 200 to499 emp. 500+ size classes (long average)
percentages of job destruction
manufacturing construction services
Figure 7: Average percentage contribution to job destruction over the years 1991-2001 by size classes using annual data and long average size measure.
moreover, the percentage flows are over 10% in the size classes 10-19, 20-49, 50-199, and 200-499. Apart from the first class, we observe an increasing percentage in contributions, with a peak for the 50-199 class for both creations and destructions. Small firms from 1 to 9 employees in the services and construction macrosectors are responsible for 70% of flows, other classes present decreasing percentages of job flows with larger firms accounting for smaller percentages.
Looking at table 4, we find that the manufacturing sector presents higher rates of creation and destruction for smaller firms. The same pattern can be observed for excess job reallocation. The net employment growth is negative for larger firms (belonging to classes: 200-499 and 500+), and the engine of growth is represented by the firms from 10 to 19 employees.
The pattern shown by the construction macrosector confirms the importance of small firms in generating and destroying jobs, but the last class, which groups large firms with more than 500 employees, presents high reallocation rate and excess reallocation. The magnitude of reallocation is principally explained by job destruction (around 9%) as confirmed by the negative rate of net employment growth. The rationale of the evidence is related to the contraction of a small number of large construction firms along the period considered.
in the services sector the job flows are more equally distributed over the size classes, and the net growth of the macrosector over the period under analysis is the result of balanced contributions of firms belonging to different classes. In particular, large firms with 200-499 employees play a major role. This deviating evidence is the result of the composition of two combined effects: an expansion of the macrosector per se and a different structure of services firms, in terms of capital intensity of the technologies employed.
c u rr en t a v era g e siz e lon g run a v era g e siz e jc jd jr xjr ne t jc jd jr x jr ne t A ll Macr ose ctors av er a ge va lues 11 .94 9.5 3 21 .47 19. 06 2.4 1 11. 94 9.53 2 1.47 19 .06 2.41 ma nu facturi ng av er a ge va lues 9.9 0 9. 09 1 8.99 18 .18 0. 81 9.9 0 9. 09 18.9 9 18.1 8 0. 81 fr om 1 to 9 em pl. 14 .20 1 7.54 31 .74 28. 40 -3.3 4 15. 50 14 .49 2 9.99 28 .98 1.02 fr om 10 to 19 10 .00 7.8 2 17 .83 15. 65 2.1 8 11. 11 8.13 1 9.25 16 .27 2.98 fr om 20 to 49 9.8 5 6. 17 1 6.02 12 .35 3. 68 9.0 3 8. 20 17.2 3 16.4 0 0. 83 fr o m 50 to 1 99 8.3 4 4. 84 1 3.19 9.69 3. 50 6.8 8 6. 16 13.0 4 12.3 3 0. 71 fr om 200 to 4 99 7.9 1 3. 46 1 1.37 6.92 4. 45 8.6 1 9. 62 18.2 3 17.2 3 -1 .00 50 0+ 8.3 3 3. 07 1 1.40 6.14 5. 26 3.4 1 3. 75 7 .16 6. 81 -0 .35 c onstructi o n av er a ge va lues 13. 26 12 .23 25 .49 24.4 6 1.02 13. 26 12 .23 2 5.49 24 .46 1.02 fr om 1 to 9 emp l. 19. 23 15 .15 34 .38 30.2 9 4.08 19. 93 14 .83 3 4.76 29 .66 5.10 fr om 10 to 19 11. 33 6.81 18 .14 13.6 1 4.53 9.9 3 9. 26 19.1 9 18.5 2 0. 67 fr om 20 to 49 9.6 8 5. 44 1 5.12 10 .88 4. 24 7.0 0 5. 68 12.6 8 11.3 6 1. 32 fr om 50 to 1 99 7.4 4 5. 96 1 3.40 11 .93 1. 48 4.0 8 9. 63 13.7 1 8. 17 -5 .54 fr om 200 to 4 99 0.0 0 12.60 1 2.60 0.00 -12.6 0 2.4 8 23.60 26.0 8 4. 95 -21.1 2 50 0+ 2.3 6 8. 84 1 1.20 4.72 -6. 48 5.4 8 25.14 30.6 2 10.9 6 -19.6 6 servic es av er a ge vlaues 13. 18 8.99 22 .17 17.9 7 4.19 13. 18 8.99 2 2.17 17 .97 4.19 fr om 1 to 9 emp l. 15. 63 11 .33 26 .96 22.6 6 4.30 16. 40 12 .39 2 8.79 24 .78 4.01 fr om 10 to 19 11. 96 4.87 16 .83 9 .74 7.08 10. 34 7.45 1 7.79 14 .89 2.90 fr om 20 to 49 11. 67 3.37 15 .04 6 .73 8.30 10. 07 6.42 1 6.50 12 .85 3.65 fr om 50 to 1 99 10. 22 3.65 13 .88 7 .31 6.57 8.5 4 5. 47 14.0 1 10.9 3 3. 07 fr om 200 to 4 99 11. 53 1.57 13 .10 3 .14 9.96 11. 56 1.03 1 2.58 2.0 5 10 .53 50 0+ 8.2 9 1. 57 9.8 6 3.1 4 6. 72 7.2 3 2. 31 9 .54 4 .61 4. 93 T ab le 4: A c ompar ison of a v erage an n ual b as ed job cre at ion and d e stru c ti on flo ws b y size c las se s an d b y m acrosec tor s using c u rren t vs lon g a v e rage me asur e of fi rms ’ siz e.
rates subdivision: percentage contributions to job flows:
jc jd jc% jd%
all macrosectors 11.94 9.53
from 0 to 1 year old 2.20 0.03 18% 0%
from 2 to 5 years 3.96 1.90 33% 20%
from 6 to 10 years 1.59 1.79 13% 19%
>10 years 4.19 5.80 35% 61%
Table 5: Age classes distribution of job creation and destruction flows.
4.5
The role of firms’ age in determining flows
An important question about flow dynamics is related to the role of a firms’ age in job creation and destruction activity. In particular, the role of entrant firms in job creation process it is important given the implications this has on local industrial and labour market policies.
We define the entrant firms as those firms that operate in the market for less than 12 months, consistently with the literature (see, Davis et al. (1996)).
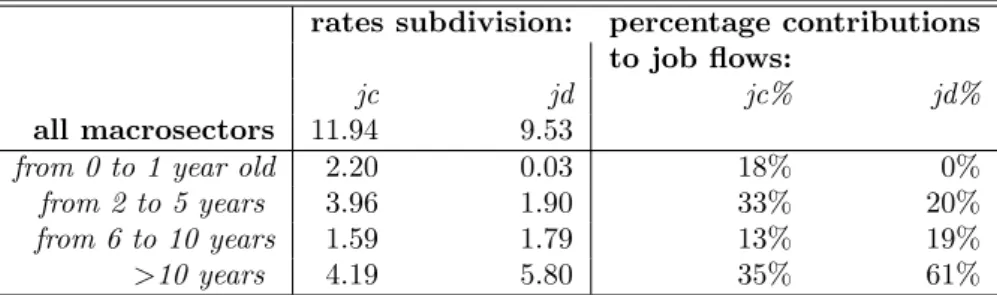
In table 5 we observe the job flows disaggregated between age classes. We notice once again the contribution to job creation of entrant firms (18%). Young firms account for a consistent creations (353%) together with old firms (35%). The majority of jobs are destroyed by old firms (61%). firms belonging to middle classes (firms from 2 to 10 years old) account for one fifth of destructions.
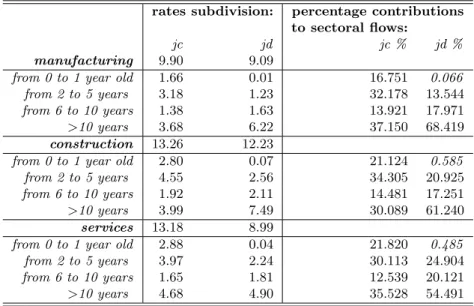
Deepening the analysis we study creation and destruction rates for each macrosector, disaggregated by age classes (table 6). Each flow is decomposed in order to single out the contribution of each age class. In the second section of table the contribution of the age classes to flows is calculated.
We begin our analysis considering the role of entrant firms in the job creation process, given the important role they play in the point of view of industry dynamics. The share of job creation attributed to entrant firms appears to be lower than the average values for Italy, see table 1. At international level both lower and higher contributions of entrant firms can be found. Such evidence can be explained by different institutional setups and different degrees of opportunity in the market. Figure 8 shows the contribution of entrant firms to the process of job creation year by year. The annual creation flow due to entrant firms varies from 10% to around 26%, and it is directly correlated with the phases of the economic cycle.
At sectoral level, in the manufacturing sector entrant firms account for 16.7% of the average job creation. Job creation and destruction rates for entrant firms in the services and construction sectors are above 20%, and they are higher than the average contributions shown in manufacturing.
This sectoral ranking with respect to creation activity represents a stylised fact (see, for example, Davis and Haltiwanger (1999)).
The contribution to job creation in other age classes reveals a non-linear relation between the intensity of flows and the age of firms. Firms that are 2 to 5 years old and those that are over 10 years old account for around 30% each in overall creation. Job destruction patterns within age classes in the manufacturing sector seem to reveal a negative correlation between age and destructions. We can note that the majority of destructions has to be attributed to older firms.
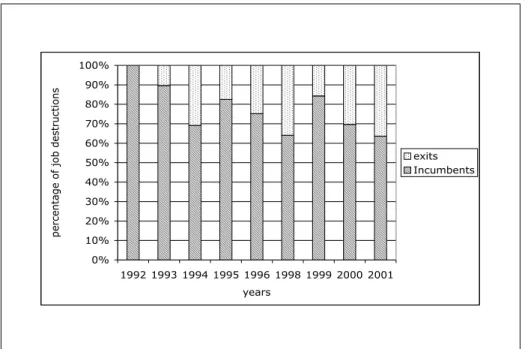
Finally we focus on exit dynamics of firms and on the effects related to job flows that exiting firms induce in the system.
0% 10% 20% 30% 40% 50% 60% 70% 80% 90% 100% 1992 1993 1994 1995 1996 1998 1999 2000 2001 years
percentage of job creations
Entrants Incumbents
Figure 8: Yearly percentage job creation contribution of entrant firms.
rates subdivision: percentage contributions
to sectoral flows:
jc jd jc % jd %
manufacturing 9.90 9.09
from 0 to 1 year old 1.66 0.01 16.751 0.066
from 2 to 5 years 3.18 1.23 32.178 13.544
from 6 to 10 years 1.38 1.63 13.921 17.971
>10 years 3.68 6.22 37.150 68.419
construction 13.26 12.23
from 0 to 1 year old 2.80 0.07 21.124 0.585
from 2 to 5 years 4.55 2.56 34.305 20.925
from 6 to 10 years 1.92 2.11 14.481 17.251
>10 years 3.99 7.49 30.089 61.240
services 13.18 8.99
from 0 to 1 year old 2.88 0.04 21.820 0.485
from 2 to 5 years 3.97 2.24 30.113 24.904
from 6 to 10 years 1.65 1.81 12.539 20.121
>10 years 4.68 4.90 35.528 54.491
0% 10% 20% 30% 40% 50% 60% 70% 80% 90% 100% 1992 1993 1994 1995 1996 1998 1999 2000 2001 years
percentage of job destructions
exits Incumbents
Figure 9: Yearly percentage job destruction contribution of exit firms. Source: Our elaborations on database DM10TN.
can observe that the business cycle shapes the destruction flows accounted for by exits. On average two thirds of destructions are due to exits. The job flows comparison presented in table 1 shows that the contribution of exiting firms to destructions in Trentino is of a similar magnitude as in Italy.
5
The determinants of job creation and destruction flows
In this section we perform a multivariate analysis to investigate the determinants of job flows. Equations 14 15 give the linear functional forms with which we have modelled, respectively, job creation and job destruction.
jci=α+β1log(Size) +β2log(Age) +β3age2+β4Size∗Age+
+β5Dconst+β6Dserv+β7Dune+jc (14)
jdi=α+β1log(Size) +β2log(Age) +β3age2+β4Size∗Age+
+β5Dcons+β6Dserv+β7Dune+jd (15)
in which: (a)log(Size) is the log of the average annual size of a firm; (b)log(age) is the log of a firm’s
age expressed in months of activity, (c)age2is a squared transformation of age used to clean-out for
non-linear effects of age, (d)Size∗Ageis the interaction term between the size and the age of a firm, (e)DconsandDservare, respectively, dummy variables for the construction and the services sectors,
(f)Dune is the rate of changes in unemployment rate to control for the business cycle. variables
of interest using separate regressions and the two step HMM augmented regressions. In table 7 we report the estimation results for respectively job creation and job destruction rates, based on both
methods14.
A preliminary observation is that the selectivity term we included is strongly significant for both the job creation and the job destruction equations. This indicates the existence of a selection bias for the firms, which distorts the standard OLS estimations and confirms the need of a correction of the results.
The F test allows us to reject the null hypothesis of joint zero value for the whole set of parameters,
both for the separate regressions and for the HMM regressions. TheR2values reveal that we account
for around 15% of variance of the sample for job creation equation and around 25% in the case of
job destruction using separate regressions. Once we apply HMM, we observe an increase inR2 in
both equations for job creation and destruction. All the explanatory variables used are significant. In particular, size and age are negatively correlated with creation and destruction rates.
The logarithm of size is negatively correlated with job creation and destruction rates, and when we consider the correction its effect is even stronger. Indeed, for job destruction the estimated parameter value changes from -23.89 to -36.69 while job creation varies from -15.57 to -97.86.
A similar pattern emerges for the role of firms’ age. From the descriptive results it was not possible to disentangle its role on job flows clearly. The regression results show that the age of firms is negatively correlated with creation and destruction rates, strengthening the role of young firms in generating jobs dynamics.
The interaction term (Age∗Size) reveals the existence of a combined effect of age and size, but
the magnitude seems to be low. Similarly the non linear effect of age (age2) is significant too, but its
effect is small. The HMM estimation does not noticeably change the estimation and the significance of these two variables.
The sectoral dummy for the construction macrosector shows that, other things being equal, this macrosector presents the highest job creation and destruction rates, contrary to what has been found analysing the descriptive statistics. The difference in the results is obviously due to the possibility of controlling contemporaneously for age, size, and their interaction. The HMM estimation does not provide additional insights. Looking at the separate regressions results, the dummy for the services sector reveals a negative correlation with job flows that does not seem to be in line with the previous descriptive results. The use of the HMM estimation in this case corrects the estimations in such a way that we are able to reconcile them with the empirical evidence previously observed. The estimated coefficient for job creation regression becomes positive when using HMM, indicating that the services
sector shows a higher job creation rate compared to manufacturing15. Instead, the coefficient for
job destruction is negative and its sign remains negative when HMM is used. This evidence seems to be coherent with the positive trend experienced by the services sector in the time frame that we study: job destruction in the services sector fluctuates less than in the other macrosectors, and this determines the growth of the sector in terms of the number of employees.
Changes in the rate of unemployment appear to be negatively related to job creation rate, and positively related to job destruction rate. Using HMM the effects on job flows are amplified. The result confirms the role played by macroeconomic conditions in generating job flows. Moreover, given that we rejected the level of unemployment as regressor in favour of changes in unemployment rate, we underline that firms’ activities of job creations and destructions are not sensitive to the stock of unemployment accumulated in the system, but are highly responsive to changes from one period to
14We do not report other versions of regression in which we used different variables to capture business cycle phases. In
particular, we tested the significance of the level of unemployment rate, but results were not satisfactory.
15Note that we excluded the manufacturing sectoral dummy, so that the basic formulation of regression is referred to
another.
6
Conclusions
The study analyses job flows in Trentino from 1991 to 2001. The high quality of the data allows us to study complementary aspects to shed light on the dynamics of the Trentino labour market. The empirical findings can be summarised in a series of key issues: (a) job flows show a “fractal” nature, i.e. many regularities appear to be scale invariant (magnitude of flows and their persistence). In particular the magnitude of the job flows is in line with the average values for Italy; (b) There are some qualifications to “fractality”: the contribution of entrant firms to the job creation process is lower than the corresponding contribution at national level, whereas the job destruction share attributed to exiting firms is around 30%, which is in line with stylised facts; (c) size and age strongly shape the job flows; (d) shifts of jobs are rare between macro sectors.
The resulting picture of the Trentino labour market presents some interesting issues. The magnitude of flows that appears to be in line with the Italian level can be interpreted as the direct effect of national institutions governing the labour market and thereby constraining local performances.
Sectoral differences in job flows confirm the common wisdom about the different behaviours of sectors: the services and construction sectors appear to be more dynamic than the manufacturing sector, even if changes in individual employment levels are more probable; compared to services, the manufacturing sector is more sticky given the charateristics of the sector, e.g. the nature of the production process, the degree of capital intensity, etc..
The size and age of firms are the two major structural determinants of job flows. A strong negative correlation emerges between job flows and these variables. Small and young firms are in particular
responsible for the higher percentage of creations and destructions16.
However, our results suggest that geographical disaggregation matters in job creation and destruction flows. Indeed, the above evidence coupled with the low contribution of entrant firms to job flows represent a critical aspect of the Trentino region. In particular, it seems that small young firms do create jobs, but are unable to grow.
Sectoral differences as described above, coupled with the evidence of extremely low shifts of jobs between the sectors, seem to reflect the inability of the local level to seek more efficient utilisation of production factors.
This evidence supports interpretations of industry dynamics based on both observable and unobservable heterogeneity of firms. In this respect, we find evidence that structural variables are able to account
for 1/5th of the variance in job creation and destruction flows. Moreover, we show that heterogeneity
of flows persists even within firms with similar characteristics.
16Elaborations show that the variables age and size of firms are positively correlated between themselves, results are not
jo b crea ti on jo b d es t ruction se pa ra te regres sio n es tim atio ns HMM se pa ra te regres sio n es tim atio ns HMM P ar. Es ti m. P ar. E sti m. P ar. Es ti m. P ar. E sti m. std. Err. Pr > | t | std. Err. Pr > | t | std. Err. Pr > | t | std. Err. Pr > | t | in ter c ep t 118. 9941 < .0 001 74. 4943 0.0254 85. 0650 < .0 001 546. 6216 0.0015 2.8 759 33 .334 4 3.7 197 17 2.19 39 lo g(size) -15 .5678 < .0 001 -9 7.8638 < .0 001 -23 .8900 < .0 001 -3 6.6881 < .0 001 0.2 717 14 .889 2 0.2 887 4.1 180 lo g(a g e) -14 .2032 < .0 001 -9 5.0074 < .0 001 -4. 6640 < .0 001 -5 5.3748 0. 0018 0.6 401 11 .681 9 0.8 234 17 .759 5 age 2 0. 0001 < .0 001 0. 0003 0. 0075 0. 0001 < .0 001 -0. 0003 0.05 26 0.0 000 0.0 001 0.0 000 0.0 001 si ze*age 0. 0005 < .0 001 -0. 0029 < .0 001 0. 0009 < .0 001 0. 0012 < .0 001 0.0 000 0.0 005 0.0 000 0.0 002 Dun e -2. 6520 < .0 001 -3 6.3985 < .0 001 20. 1922 < .0 001 46. 5842 0.0006 0.5 255 5.9 486 0.5 842 13 .592 8 Dco n s 3. 3225 < .0 001 31. 9422 < .0 001 2. 9923 < .0 001 15. 1684 0.0098 0.6 807 6.3 955 0.7 266 5.8 751 Ds er v -2. 8120 < .0 001 16. 4084 0.0006 -8. 0531 < .0 001 -2 7.3809 < .0 001 0.5 389 4.8 091 0.5 771 6.6 011 selec t ivit y term 466. 6935 < .0 001 376. 5851 < .0 001 58 .422 3 98 .080 4 R squared 0. 1484 0. 2063 0. 2551 0. 2853 Adj R s qua red 0. 1482 0. 2060 0. 2549 0. 2850 F v alue 659. 1 < .0 001 859. 65 < .0 001 1071. 48 < .0 001 938. 46 < .0 001 Do F 7 8 7 8 L ege nd: Dune: change s o f u n em pl o y m e nt ra te ; Dc o ns: dumm y varia b le for constructio n ; Dserv: dumm y varia b le for servic es. T ab le 7: Str uctur al dete rm inan ts of job c reation and d e stru c ti on flo ws : a regres sion an alysis.
References
Abowd, J. M. and Kramarz, F. (1999), The analysis of labor markets using matched
employer-employee data, in O. Ashenfelter and R.Layard, eds, ‘Handbook of labor economics
vol.3b’, North Holland, chapter 26, pp. 2629–2710.
Acs, Z., Armington, C. and Robb, A. (1999), Measures of job flows dynamics in the U. S., discussion Paper ces 99-1, Center for Economic Studies, Bureau of the census, Washington.
Alonso-Borrego, C. and Collado, M. D. (2001), Innovation and job creation and destruction: evidence from Spain, Statistics and Econometrics Working Paper ws013824, Universidad Carlos III, Departamento de Estad´ıstica y Econometr´ıa.
Baily, M., Bartelsmann, E. and Haltiwanger, J. (1996), ‘Downsizing and productivity growth: Myth
or reality?’,Small Business Economics8(4), 259–278.
Baldwin, J., Dunne, T. and Haltiwanger, J. (1998), ‘A comparison of job creation and job destruction
in canada and united states’,The Review of Economics and StatisticsLXXX(3), 347–355.
Barnes, M. and Haskel, J. (2002), Job creation, job destruction and the contribution of small businesses: Evidence from UK manifacturing, Working Paper 461, Department of Economics, Queen Mary University.
Birch, D. L. (1987), Job creation in America: How our smallest companies put the most people to
work, New York, The Free Press.
Blanchard, O. and Diamond, P. (1990), ‘The cyclical behavior of gross flows of workers in the united
states’,Brooking Papers on Economic Activity28, 85–155.
Blanchflower, D. G. (1994), Job creation and job loss: research questions arising from the use of
establishment based data, in ‘Job Creation and Loss. Analysis, Policy and Data Development’,
Paris, OECD.
Burda, M. and Wyplosz, C. (1994), ‘Gross worker and job flows in europe’, European Economic
Review38(6), 1287–1315.
Davis, S. J. and Haltiwanger, J. C. (1999), Gross job flows,inO. C. Ashenfelter and R. Layard, eds,
‘Handbook of labor economics vol.3b’, North Holland, chapter Gross Job Flows, pp. 2711–2805.
Davis, S. J., Haltiwanger, J. C. and Schuh, S. (1996),Job Creation and Destruction, Cambridge, MA,
MIT Press.
Dosi, G. and Winter, S. (2002), Interpreting economic change: Evolution, structures and games,in
M. Augier and J. March, eds, ‘The Economics of Choice, Change, and Organizations’, Cheltenham, Edward Elgar Publishers.
Dosi, G., Marsili, O., Orsenigo, L. and Salvatori, R. (1995), ‘Learning, market selection and the
evolution of market structure’,Small Business Economics7, 411–436.
Faggio, G. and Konings, J. (2003), ‘Job creation, job destruction and employment growth in transition
Fagiolo, G., Dosi, G. and Gabriele, R. (2004), ‘Matching, bargaining and wage setting in an
evolutionary model of labor market and output dynamics’, Advances in Complex Systems
7(2), 1–30.
Frazis, H. (1993), ‘selection bias and the degree effect’,Journal of Human Resources28(3), 538–554.
Gallo, B. (2003),DM10/2, manuale di compilazione, INPS, Direzione Centrale Entrate Contributive.
Greene, W. H. (2003),Econometric Analysis, fifth edn, Prentice Hall.
Leombruni, R. (2003), Osservatorio sulla mobilit`a del lavoro in Italia, Il Mulino, Bologna, chapter
Creazione e distruzione di posti di lavoro, pp. 89–109.
Maddala, G. S. (1985), Limited-dependent and qualitative variables in econometric, New York,
Cambridge University Press.
Nelson, R. and Winter, S. G. (1982),An evolutionary theory of economic change, Cambridge, MA,
Harvard University Press.
Olley, A. and Pakes, A. (1992), ‘The dynamics of productivity in the telecommunications equipment
industry’,Economic studies92(2), 538–554.
PAT (1998), Rapporto sulla situazione economica e sociale del Trentino, Provincia Autonoma di
Trento, Servizio Statistica.
PAT (2001), Rapporto sulla situazione economica e sociale del Trentino, Provincia Autonoma di
Trento, Servizio Statistica.
Picot, G. and Dupuy, R. (1996), Job creation by company size class: concentration and persistence of job gains and losses in Canadian companies, Research Paper 93, Business and labour market Analysis Division, Statistics Canada.
Pissarides, C. A. (2000),Equilibrium Unemployment Theory, Oxford, Blackwell.
Stahl, F., Stiglbauer, A. M., Winter-Ebmer, R. and Zweimuller, J. (2002), Job creation and job destruction in a regulated labor market: The case of Austria, Discussion Paper 3497, CEPR.
A
Appendix: The level of analysis
The measures of job flows that we created are consistent with the definitions of Davis et al. (1996). The availability of monthly data leads us to estimations of job flows rates referring to a yearly based measure.
Monthly estimations have the characteristic of also capturing cyclical movements of firms, and hence represent a ”real” measure of micro turbulence in the labour market of the Trentino region. The choice of working with monthly data is based on the need of being able to reason on the finest detail available, and on the aim of exploiting the database as much as possible. Knowing that shortening the period of observation can lead to distortions in the job flows estimations due to overestimation of transitory phenomena and to misspelled workers movements, we decided to conduct our analysis on the basis of annual estimations, even if we provide some tables with monthly estimations. The estimation of the annual flows consists of two steps: (a) the estimation of the yearly average number of
employees per firm; (b) the estimation of annual job flows -using the Davis et al. (1996) methodology.
Annual estimation offers the advantage of comparability to other studies. Note that we employ
monthly information in the construction of the average number of employees per year, which in turn reduces distortions about job flows estimations.
We are aware that results on job flows obtained through the methodology proposed by Davis et al. (1996) have to be interpreted with care. In fact, the measurement of ”real” job creations and job destructions implies, from a theoretical point of view, the possibility of measuring the actual number of jobs -i.e. productive locations- entailed by each firm, but there are no databases available that are based on this direct observation.
It is worthwhile to note that comparability of studies is difficult in any case as noted by many researchers (Davis and Haltiwanger (1999), Faggio and Konings (2003), Acs et al. (1999), and Blanchflower (1994)).
Nevertheless, we prefer annual based estimations to ”position” our study in the international evidence, to make comparisons, and to interpret the results correctly. Where possible we also provide monthly based estimations, trying to interpret the dissimilarities between the different methods.