Volume 8•Number 2•June 2017•pp. 57–68 DOI: 10.1515/mper-2017-0018
WORKPLACE INNOVATION: EXPLORATORY
AND CONFIRMATORY FACTOR ANALYSIS
FOR CONSTRUCT VALIDATION
Warit Wipulanusat, Kriengsak Panuwatwanich, Rodney A. Stewart
Griffith University, Griffith School of Engineering, Australia
Corresponding author:
Kriengsak Panuwatwanich Griffith School of Engineering Griffith University
Gold Coast campus Queensland 4222 Australia phone: (+61) 07 5552 7357
e-mail: [email protected]
Received: 15 December 2016 Abstract
Accepted: 16 March 2017 Workplace innovation enables the development and improvement of products, processes and services leading simultaneously to improvement in organisational performance. This study has the purpose of examining the factor structure of workplace innovation. Survey data, extracted from the 2014 APS employee census, comprising 3,125 engineering professionals in the Commonwealth of Australia’s departments were analysed using exploratory factor analysis (EFA) and confirmatory factor analysis (CFA). EFA returned a two-factor structure explaining 69.1% of the variance of the construct. CFA revealed that a two-factor structure was indicated as a validated model (GFI = 0.98, AGFI = 0.95, RMSEA = 0.08, RMR = 0.02, IFI = 0.98, NFI = 0.98, CFI = 0.98, and TLI = 0.96). Both factors showed good reliability of the scale (Individual creativity:α= 0.83, CR = 0.86, and AVE = 0.62; Team Innovation: α = 0.82, CR = 0.88, and AVE = 0.61). These results confirm that the two factors extracted for characterising workplace innovation included individual creativity and team innovation.
Keywords
workplace innovation, exploratory factor analysis, confirmatory factor analysis.
Introduction
Today’s global competition and public pressure have prompted the public sector to focus on innova-tion as a means of improving productivity and per-formance. In Australia, due to public management reform in the 1990s, the literature on innovation in the public sector has rapidly expanded [1, 2]. Addi-tionally, the Australian Public Service (APS) has un-dergone significant administrative reforms since the introduction of the National Competition Policy in 1993 [3] with public sector organisations adopting a more commercial orientation, and becoming more focused on efficiency, effectiveness and accountabili-ty [4]. In 2009, the Advisory Group on the Reform of Australian Government Administration was formed with the mission of seeking innovative means of im-proving the performance of Australian federal
de-partments, leading to an upbeat report ‘Ahead of the Game’ [5, 6]. To promote innovation, the Australian National Audit Office (ANAO) published a ‘better practice’ guide which provided a framework to un-derstand the innovation process in the public sec-tor [7]. It gives practical insights on how to search for, assess, implement, and evaluate innovative ideas to improve the quality of services delivered to cit-izens. In 2010, the Australian Public Service Com-mission (APSC) published the report ‘Empowering Change: Fostering Innovation in the Australian Pub-lic Service’ which considered how to encourage and strengthen a culture of innovation in the APS [8]. These initiatives suggest that innovation has become an important focus for the APS.
Workplace innovation is viewed as a contextu-al psychologiccontextu-al construct which identifies and mea-sures the behavioural aspects of innovation
prac-tices by individuals in their workplace [9]. In this study, the dimensionality of workplace innovation was analysed using an exploratory factor analysis (EFA) and confirmatory factor analysis (CFA). EFA was employed to analyse the inter-relationship be-tween variables and to explore the factor structure of their measure, then the fit of the model was test-ed by CFA.
EFA can be used to identify appropriate variables and analyse the relationships among large numbers of variables in the most general form by explaining them in terms of their common underlying dimen-sions [10]. The results from the EFA in this study provided a number of factors to retain in the work-place innovation construct and a clear estimation of the factor structures for the measures of this con-struct. To strengthen the outcomes of EFA, CFA was sequentially conducted to confirm the validity of the measurement scale by supporting the recognised fac-tor structures discovered from the EFA process. CFA is a theory-driven technique used to test the hypothe-ses for a factor structure, which determines the va-lidity of theoretical structures through testing the causal links among variables [11, 12]. By conducting CFA, researchers can assess the structure of factors, identify the dimensions of a construct, and deter-mine whether particular patterns of loadings match the data [10].
The paper begins with a literature review of workplace innovation, then explains the methodol-ogy employed, followed by the research results. The paper then discusses the findings and ends with key conclusions from the study.
Workplace innovation
Workplace innovation is created when an indi-vidual or a team of indiindi-viduals focus on improv-ing organisational management and technology [13]. This definition highlights the interactive characteris-tics of workplace innovation. Pot [14] defines work-place innovation as the implementation of interven-tions which advance organisational systems, human resource management and supportive technologies. When workplace innovation is aligned with an or-ganisation’s strategic objectives, it enables the de-velopment and improvement of products, processes and services leading simultaneously to an increase in organisational performance. In order to be success-ful, workplace innovation depends on creating innov-ative and self-sustaining processes of learning, reflec-tion, and change. This demands a commitment to; learning from a variety of sources, and enabling staff to develop and use their competencies and creative
abilities to the fullest extent, including empowering job design, self-organised teamwork, engagement in innovation processes, and employee participation in strategic management [13].
Many researchers have emphasised the role of an organisation in the success of workplace innovation [15, 16]. More specifically, most scholars have assert-ed the role of organisational culture in the success-ful management of innovation in the public sector [17, 18]. In particular, many studies have defined the culture for innovation from a cultural perspective as supporting creativity, openness and receptiveness to new ideas, risk taking and promoting an entrepre-neurial mindset [19, 20]. According to Kim and Yoon [17], culture for innovation is a primary element for creativity and innovation in government organisa-tions.
It has been widely accepted that leadership play a key role in determining innovation and creativity in organisations. Leaders build the process, structures, and climate for an organisation to become innovative and to motivate team expectations toward innova-tions [21]. Leaders also not only act as behavioural role models for innovative ideas, but can also act as critical champions to boost innovative behaviours and adapting attitudes that are conducive to innov-ative initiinnov-atives [22]. As such, culture and leadership are significant in creating a workplace innovation.
Innovation is generally related to creativity. Cre-ativity is defined as the process of an individual or small group of individuals working together to form novel, useful and appropriate ideas in order to solve problems and increase effectiveness [15, 23] and can be construed as the idea generation element of inno-vation [24]. Amabile [15] proposes a model in which creativity is a function of three elements: task mo-tivation (a sense of being excited by the work it-self and attracted by the challenge of problems); domain-relevant knowledge (knowledge and talents relevant to the task at hand), and creative-relevant skills (a cognitive style favourable to bringing new perspectives to problems). Scott and Bruce [25] com-prehended creativity as a notion related to gener-ating novel ideas, and innovation as a notion that includes not only generating but also adopting and implementing novel ideas. Thus, creativity is regard-ed as the first phase of the innovation process, rather than a separate entity.
Developing the creativity and innovation of both individuals and teams needs strong championship of supervisors and senior leaders [26]. This may come in the form of empowering employees to take action for change and to have a propensity for risk-taking [27], providing incentives for innovation [28],
supply-ing enough budgets to generate innovations [2], ussupply-ing pilot projects to test initiatives [29], and providing freedom for employees and protecting them from bu-reaucratic hindrances [5].
Individual creativity
Many of the world’s most successful organisations implement new business models based on applying individual creativity to promote organisational in-novation [30]. Individual creativity at work involves the development of practical and new solutions to workplace challenges, providing a tangible and use-ful outcome for an organisation [15]. It is a social interaction embedded in the work environment in which the communication and interaction between coworkers can significantly improve individual cre-ativity [23, 31]. When employees perceive a work en-vironment that fails to stimulate individual creativ-ity, a void may occur between the level of individual creative ability and the actual amount of individual creativity practised within the organisation. Howev-er, bureaucratic practices in public sectors often pre-vent leaders’ efforts to promote individual creativity [32]. Thus, to encourage individual creativity, lead-ers should try to undlead-erstand subordinates’ motiva-tions.
Team innovation
Team innovation is an important determinant in the capability of organisations to respond to rapidly changing and challenging working environ-ments. Organisations are increasingly dependent on teams, which are the basic building blocks of mod-ern organisations, to innovate through the effective cross-fertilization of ideas [33, 34]. Team innova-tion refers to the introducinnova-tion or applicainnova-tion with-in a team of ideas, processes, products, or proce-dures that are novel to the team and are designed to be useful [35]. It is the team’s ability to devel-op novel ideas (i.e. creativity) and the ability to put these ideas into practice such that they yield benefits to organisations (i.e. implementation). Im-plementation processes include selling ideas to oth-er memboth-ers and making ideas available in the or-ganisation [36]. Team innovation thus can be oper-ationalised as the merger of the quality and quan-tity of ideas that are generated and implement-ed. Teamwork is a vital factor of team innova-tion. Innovative teams frequently have clearly de-fined objectives and goals, effective leaders, good balance of team roles, effective conflict resolution, and efficient connections with external organisa-tions [37].
Methodology
Opportunities for replicating large data sets in public management studies are starting to emerge. Governments in industrialised countries are now sur-veying their employees to consider their views and at-titudes about the workplace, management, and hu-man resources. For example, the Australian Public Service Commission (APSC) conducts a State of the Service Employee Census to measure employees’ per-ceptions of whether, and to what extent, conditions characterising successful organisations are present in their departments.
This study uses data from the 2014 APS employ-ee census, conducted by the APSC. This survey in-strument was administered to gather data from civil servants in Commonwealth departments using an on-line survey. Although utilising secondary data limits the available sample to a pre-determined selection of respondents, the large sample size of this nation-al survey yielded a sufficient sample for this study Secondary data sets have been previously used by researchers interested in investigating innovation in the APS [38, 39].
This study draws on the perspectives of engineers as key informants. Therefore, the target population is the engineering profession which is classified in the APSC Job Family Model as the Engineering and Technical Family. 3,570 APS survey respondents re-ported their type of work as Engineering and Techni-cal profession. Responses with missing values across all of the variables were excluded leaving a total of 3,125 observations available for this study.
The sample population represented a gender mix of 14% female and 86% male the predominantly aged was between 45 and 59 (49%) and 73% had a total length of service of more than 5 years; 68% worked in an operational role (APS 1-6) and were well educat-ed, with 78% holding tertiary qualifications (Bach-elor or higher); 86% worked in operational agen-cies and 91% worked in large agenagen-cies (>1,000 em-ployees). The distribution of the demographic profile of participants approximated the distribution of the population from which they were drawn.
The differences in personal attitudes according to different demographic groups (e.g. age, gender, ed-ucation level) were tested using the mean difference and the effect size of the difference. From the results, there was neither a large mean difference nor a large effect size. This means no significant differences ex-isted in personal attitudes according to the different demographic groups.
The 7 survey items were selected and grouped according to workplace innovation theory. The
sur-vey items were measured on a 5 point Likert scale (Strongly Disagree = 1 and Strongly Agree = 5). To clean the data and decrease systematic errors, missing values, outliers, and the distribution of all measured variables were examined. The missing re-sponses were imputed by the Expectation Maximi-sation approach prior to factor analysis.
The validity of this workplace innovation scale was evaluated using factor analysis, which was con-ducted using two sequential approaches: (1) Ex-ploratory Factor Analysis (EFA) and (2) Confirma-tory Factor Analysis (CFA). EFA was conducted to condense the large number of items into a small-er, more controllable set of dimensions .[10]. In this study, EFA was applied to the construct to determine the adequate number of latent factor structures and to disclose the number of factors underlying, concep-tually and statistically, the set of items in each model construct. The results were then affirmed using CFA to provide a foundation for subsequent model assess-ment and refineassess-ment. The CFA results were used to demonstrate whether the model had acceptable lev-els of fit, convergent validity, discriminant validity and unidimensionality.
Results
Descriptive analysis
Descriptive analysis was employed to gain a feel for the data These results are presented in Table 1 based on the values of mean and standard devia-tion. Mean value is the central tendency measument, used to describe the average opinion of the spondents and to obtain an overall picture of the re-spondents’ perceptions regarding each variable. This section evaluates and interprets the mean values of all 7 variables.
Employees’ personal attitudes towards innova-tion seemed to be quite positive with all mean values within this scale higher than medium level, ranging from 3.12 to 3.89. Most employees reported feeling their individual creativity was supported. They felt comfortable to voice opinions differing from their
col-leagues, as indicated by the highest mean value in this construct (variable W4; 3.89). The majority of employees also felt they received support for inno-vation, including autonomy (variable W1; 3.73) and opportunity to experiment (variable W2; 3.59). How-ever, employees were less likely to agree that they had the opportunity to be innovative in terms of time (variable W3; 3.12), Employees were also asked to provide their views on aspects of innovation in their work group. Most employees reported the work group analysed their work for process improvement (variable W5; 3.69) and improved service delivery (variable W7; 3.76). Employees were likely to believe it was their personal responsibility to improve the quality of their work (valuable W6; 3.82).
The normality of the data was calculated using statistics of skewness and kurtosis and comparing them with the ‘rule of thumb values’ of±2.58 [10]. Skewness measures symmetry which affects tests of means, while kurtosis measures how the peaked-ness of a distribution impacts tests of variances and covariances. The skewness values were inside the threshold as they ranged from −1.18 to −0.31, in-dicating similar participant responses for these ques-tions. The kurtosis values also fell within the recom-mended range with result of−0.67 to +1.77, which again fell within the recommendation range (see Ta-ble 1). This is in accordance with the assumption that in samples of 200 or more, the effect of skew-ness and kurtosis disappears [40].
Exploratory factor analysis
In order to assess the factorability of the data and ensure sampling adequacy, Bartlett’s test of spheric-ity and the Kaiser-Meyer-Olkin (KMO) measure of sampling adequacy were applied. The KMO value of the variables was 0.847, which indicated sampling adequacy such that the values in the matrix was suf-ficiently distributed to conduct factor analysis [41]. The value obtained by Bartlett’s test of sphericity,
χ2(21) was 9,258.44, which was highly significant at
p < 0.001 level, indicating that the data were
ap-proximately multivariate normal [41, 42]. Table 1
Covariance structure analysis: descriptive statistics.
Variable Mean SD Skewness Kurtosis
W1: I am able to explore new ideas. 3.73 0.88 −0.93 1.07
W2: I would be supported if I tried a new idea. 3.59 0.98 −0.70 0.20 W3: I have the time to explore new ideas. 3.12 1.08 −0.31 −0.67 W4: I feel comfortable to voice a different opinion. 3.89 0.88 −1.18 1.77 W5: My work group looks for ways of doing a better job. 3.69 0.82 −0.68 0.61 W6: Improving the quality of our work is our responsibility. 3.82 0.70 −0.70 1.39 W7: My work group improves the service we provide. 3.76 0.84 −0.87 1.08
A principal component analysis (PCA) with vari-max rotation was initially conducted to examine the validity of the construct. PCA was chosen as a data extraction method because its primary objective was to summarise and reduce data as well as define the factors needed to represent the structure of a vari-able [10]. PCA takes the data set and extracts the maximum variance from each component. Varimax rotation, which can load variables to factors clear-ly, was conducted to maximise the variance of fac-tor loadings and minimise the number of variables that had high loadings on each other [40, 42]. A total of seven variables were selected to operationally de-fine the workplace innovation (WIT) construct. The presence of two components with eigenvalues greater than 1 was indicated by the initial principal compo-nent analysis.
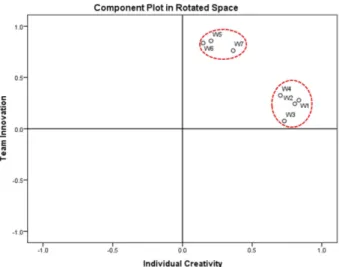
A geometrical approach can be utilised by the EFA where factors in a coordinate system can be vi-sualized by variables plotted on the axes of a graph [43]. When variable coordinates are close together on each axis, this represents a strong relationship between that variable and the particular factor. As shown in Fig. 1, the variables were plotted as func-tions of each factor. The variable coordinates on the factor axis act as a reference frame for the fac-tor loadings. High facfac-tor loadings for four variables (W1, W2, W3, and W4) show strong relationships with factor 1 (Individual Creativity: horizontal axis) but these variables has a low correlation with fac-tor 2 (Team Innovation: vertical axis). In compar-ison, three variables have strong relationships with team innovation but low correlation with individual creativity.
Fig. 1. A geometrical representation of factor analysis. The Catell’s scree test uses a graphical plot of the eigenvalue of the factor in the order of the extracts where an abrupt change of slope in the graph shows the maximum number of factors to be extracted and
the number of factors which need to be retained [42]. A horizontal and a vertical line starting at each end of the curve were inserted to determine whether an abrupt change of slope had occurred. The result was that after the second component, an abrupt change of slope was present for the scree plot (see Fig. 2).
Fig. 2. Scree plot for workplace innovation. Prior to extracting factors, communality esti-mates must be generated. Communality is the pro-portion of observed variance accounted for by the common factors. These values represent the total amount of variance for an item explained by the ex-tracted factors. The communality is denoted by h2
and is the summation of the squared factor loadings of a variable across factor [40]. The aim of factor analysis is to explain variance through common fac-tors. This means, usually if a variable has low com-munalities (less than 0.20) where 80% is unique vari-ance, it is excluded from the analysis [44]. To obtain the communalities, the following formula is used [45]:
h2j =a2j1+a2j2. . .· · ·+a2jm, (1) where aequals the loadings forj variables.
Using the factor loadings in Table 2, the com-munality of variable W1 was calculated using the aforementioned formula:
h2W1= 0.8362+ 0.2792= 0.776. (2)
The factor loadings and the contribution of each variable to the factors is shown in Table 2. As illus-trated, W1 has the highest contribution to Factor 1. Based on the indicated communality and the knowl-edge of the two factors 77.6% of variable W1 can be predicted. High variable communality indicates the set of factors can explain much of the variance of a variable [12]. From the result, there was no commu-nality less than 0.20 [44]. Thus, all 7 variables were retained for further analysis.
Table 2
Rotated factor loadings of the WIT construct.
Variable: description Rotated component Communalities
1 2
W1: I am able to explore new ideas. 0.836 0.279 0.776
W2: I would be supported if I tried a new idea. 0.807 0.245 0.711 W3: I have the time to explore new ideas. 0.731 0.076 0.540 W4: I feel comfortable to voice a different opinion. 0.703 0.326 0.600 W5: My work group looks for ways of doing a better job. 0.205 0.857 0.776 W6: improving the quality of our work is our responsibility. 0.148 0.836 0.721 W7: my work group improves the service we provide. 0.364 0.762 0.713 Based on the eigenvalue and the Catell’s scree
test criterion, two factors were extracted from the WIT construct. This two-factor solution explained 69.1 percent of the total variance. As presented in Table 2, the factor loadings of all seven variables were well above the 0.50 cut-off loading. All seven variables making up each of these two factors were significant without cross loadings. For component 1, the variables with high loadings were mainly con-cerned with individual creativity (WIT1). For com-ponent 2, the variables with high loadings centred on team innovation (WIT2).
The level of overdetermination indicates the de-gree to which each factor is clearly shown to have a sufficient number of variables and the extent to which each factor is adequately defined by a set of indica-tors [46]. Highly overdetermined facindica-tors occur when high factor loadings exist for at least three to four variables. These factors have moderate to high com-munalities (i.e., between 0.40 and 0.70 or higher), and demonstrate good simple structure [47]. Both factors had three or more items per factor, with fac-tor loadings ranging from 0.703 to 0.857 and com-munalities ranging from 0.540 to 0.776, suggesting relatively strong data.
Confirmatory factor analysis
The EFA results presented in the previous sec-tion provided valuable insights into the dimensional-ity of the latent variables and confirmed the reliabili-ty of the measurement scales underpinning the model constructs. However, while the EFA provided pre-liminary results for the factor structure of each con-struct, the analysis was insufficient to conclusively establish the appropriate dimensionality of the mea-sures. Therefore, confirmatory factor analysis (CFA) was performed to assess the overall goodness-of-fit of all the constructs to determine the validity of the measures [16, 48]. The CFA was conducted to assess construct validity and unidimensionality, which were critical elements in the measurement theory [10, 11]. Construct validity is concerned with whether there
is sufficient accuracy in reflection of theoretical con-cepts and if the items in a scale meaningfully mea-sure the construct. The unidimensionality refers to the existence of a single construct underlying a set of observed variables, thus unidimensionality is es-tablished when an empirical item is significantly as-sociated with the empirical representation of a sin-gle construct [10, 11]. A unidimensionality test was performed to examine the measurement errors and eliminate weak factor loadings as well as to check the adequacy of the model through a re-specified model and measure reliability.
To develop the CFA, the researcher should have reasonable prior knowledge of the factors and oth-er theoretical findings to clarify the intoth-errelationship among the measured variables. In this study, work-place innovation was not only theoretically estab-lished, but also had been empirically tested in pre-vious studies. Therefore, the CFA was supplemen-tarily conducted for scale refinement and validation purposes and the factor structure illustrated a set of relationships to represent how the measured items represented latent factors. The process examined the factor structures for each construct to check how well they fitted the data and analysed the models’ indices for construct validity and unidimensionality.
To determine how well the specified factor model represented the data, goodness-of-fit indices were ex-amined. There are several indices to assess model-fit and they are categorised into two groups, namely absolute fit indices and incremental fit indices. Ab-solute fit indices are a direct measure of the degree to which the specified model reproduces the observed data, which can determine how well the theory fits the sample [10, 49]. The most fundamental absolute fit index is a Chi-square (χ2) statistic used to
mea-sure the discrepancy between a hypothesised model and data [50]. However, the chi-squared test has been found to be sensitive and bias to sample size, thus this value will tend to rise as the sample size increas-es [12]. Root mean squared error of approximation (RMSEA) is also widely reported to estimate the
lack of fit to the saturated model. The root mean square residual (RMR) is the square root of the mean of the squared residuals which is an average of the residuals between the observed and estimated measures. Goodness-of-fit index (GFI) indicates the proportion of the variance in the sample variance-covariance matrix. Adjusted goodness-of-fit index (AGFI) can be used to compensate the GFI index in which the value of the index is adjusted for the number of parameters [49].
Incremental fit indices are concerned with the de-gree to which the model of interest is superior to the alternative baseline models by computing based on a comparison between the baseline model and expect-ed model [49]. Incremental-fit index (IFI), normexpect-ed fit index (NFI), comparative fit index (CFI), and Tucker Lewis index (TLI) are the most commonly indices reported in this category. The IFI indicates the issues of parsimony and sample size. The NFI compares the improvement of the overall fit of the researcher’s model to a null model, while the CFI is a modified version of the NFI taking the sample size into account. The TLI indicates a correlation for model complexity [48].
Model fit is assessed through an inferential Chi-square (χ2) and several descriptive goodness-of-fit
in-dices. Since the Chi-square (χ2) is known to be
in-flated in samples with N >200[51], the Chi-square (χ2) and degree of freedom (df) are reported as
de-scriptive information rather than a strong inferential test of whether a model can be accepted or rejected. According to Hair et al. [10], at least one incremental index (CFI or TLI) and one absolute index (RMSEA or SRMR) must be reported. However, the availabil-ity of many different fit indices presents problems of selection to researchers because there is a lack of consensus regarding which absolute and incremen-tal goodness-of-fit indices are optimal for gauging model-fit and should be reported [12, 50]. Therefore, multiple alternative fit indices were employed to mea-sure the degree of model-fit [49]. For the model to be considered as having an acceptable fit, all eight in-dices were measured against the criteria as shown in Table 3.
In addition to producing goodness-of-fit indices, the modification indices (MI) and standardised resid-uals are useful statistical calculations for detecting model misspecification [11, 48]. The decrease in Chi-square if the two error term variables are allowed to correlate is shown by modification indices. The standardised differences between individual observed covariance and the estimated covariance are indi-cated as standardised residuals. Variables associat-ed with modification indices which are greater than the threshold level of 5.0 justify further investigation for potential re-specification [11, 48], whilst stan-dardised residuals between−2.58 and 2.58 are con-sidered acceptable. Standardised residual values be-tween−2.58 and−4 and between 2.58 and 4 may be problematic and deserve some attention but may not require any modifications to the model [10].
The model re-specification is conducted to im-prove the fit of the model [52]. Two methods can be used to re-specify the model: deleting non-significant variables from the model or adding paths to the mod-el based on empirical data. Re-specification is guid-ed by the analysis of the modification indices and examination of the standardised residuals. Howev-er, these outputs should only be used as a guideline, and should not dictate model re-specification, thus empirical rationalisation and theoretical considera-tions must also be considered to support model re-specification guided by these indices [53].
To accurately calculate the model parameters and fit indices, the maximum likelihood (ML) was used to achieve model fit. The ML is based on es-tablishing parameter estimates, which maximise the likelihood that the observed covariance of the da-ta reflects the population under investigation. Max-imum likelihood of all parameters is also simulta-neously estimated to minimise the discrepancies be-tween the covariances of observed data and the pro-posed model [12]. The distribution of the data in this study was considered normal, and thus its use as maximum-likelihood data for CFA analysis was ex-pected to produce reliable results [12, 48]. The ML can also be used for data with minor deviations from normality and is still fairly robust under the condi-Table 3
Summary for goodness-of-fit indices.
Category Indicator Purpose Acceptance level
Absolute fit indices
GFI
Evaluate the proportion of variance >0.90 AGFI
RMSEA
Estimates how well the model fits <0.08
RMR <0.05
Incremental fit indices IFI
Determine the degree to which the model of interest is superior
>0.90 NFI
to the alternative baseline models CFI
tion of moderate non normality [10]. The ML requires a sample size of at least 100 to achieve reliable find-ings [10], while the general rule considers a sample size of 100 to 200 as a ‘good sample size’ [49]. There-fore, a sample size of 3,125 seemed to fit very well with these recommendations.
Construct validity is assessed using statistical and practical procedures to determine whether the scores from an instrument are significant and can be used to understand a sample from a population [54]. As-sessing construct validity using the CFA evaluates the extent to which a measure is related to other measures based on theoretical concepts and involves an assessment of convergent validity and discrimi-nant validity. Convergent validity refers to the ex-tent to which the measured variables of a specific factor have a high proportion of variance in common and assess the same factor, while discriminant va-lidity refers to the degree to which a factor is truly distinct from other factors [10]. The measurement of convergent validity is determined through the mag-nitude of the standardised factor loadings and their significance level. The high value of factor loadings with the corresponding significantt-values indicates that an observed variable is able to measure a la-tent construct [55]. Hair et al. [10] recommend that a benchmark value of substantial magnitude of fac-tor loading should be greater than 0.50. In situation where the factor loading is found to be larger than 1, it is referred to as a Heywood case. A model with this estimate is unacceptable because the factor explains more than 100% of the variation in this measure [48]. Moreover, a variable should also have an R2 value
(or squared multiple correlation, SMC) greater than 0.50 in order to demonstrate an adequate reliabili-ty [55].
The reliability of the model was evaluated through Cronbach’s alpha (α), followed by an as-sessment of the factors’ composite reliability (CR) and average variance extracted (AVE). Cronbach’s alpha determines how consistent the responses are across items within the scale. A Cronbach’s alpha value greater than 0.70 indicates that the scale is reli-able [56]. Composite reliability measures the internal reliability of all the variables in their measurement of a construct. An average variance extracted deter-mines the amount of variance in the measured indi-cators captured by the latent construct. Bagozzi and Yi [57] suggested 0.60 and 0.50 as the minimum value of composite reliability and average variance extract-ed, respectively. CR and AVE values were calculated using the following equations [10]:
CR= ( P λ)2 (Pλ)2+Pe, (3) AVE= Pλ2 P λ2+Pe, (4)
where λis standardised factor loading and e is the standardised error.
Discriminant validity provides evidence that a construct is distinct from other constructs and cap-tures the phenomena and concepts that other con-structs do not [12]. Initial evidence of discriminate validity is provided by an inspection of the correla-tion coefficient between each pair of constructs. If two constructs have a significantly high correlation coefficient (i.e. greater than 0.850), then it might re-flect the same concept and should be incorporated as a single construct [40]. Unidimensionality can be established when the variables load only a single con-struct. In order to be considered unidimensional, all model fit indices must meet the acceptable level [58]. The CFA was tested using Analysis of Moment Structures software package (AMOS). The measure-ment of the CFA for the WIT construct conformed to a rigorous threshold level of goodness-of-fit. The factor loading, t-value and significance level of each variable yielded a measure for the convergent validi-ty; the value ofR2provided a measure with which to
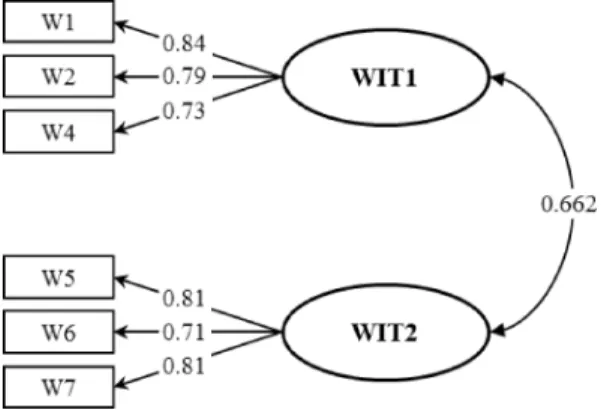
assess the reliability of the variables; and the value of the correlation between the factors indicated the dis-criminant validity. The results of the CFA conducted on AMOS have been presented in Fig. 3.
Fig. 3. CFA model of WIT construct.
Initially, the goodness-of-fit indices identified a poor degree of fit with the data. Each possible pa-rameter which is not currently free to be estimated is examined for its modification indice to indicate the expected drop in overall Chi-Square value if a para-meter is to be freed in the model [59]. The variable W3 was associated with relatively high modification indices, indicating this variable as a source of the mis-specification. Therefore, variable W3 was removed in the model respecification process. The results of the CFA conducted on the WIT construct have been pre-sented in Table 4.
Table 4 Summary of CFA results.
Workplace innovation Loadings t-values R2
Individual Creativity (WIT1)
W1 0.84 f.p. 0.71
W2 0.79 44.41 0.63
W4 0.73 41.29 0.53
Team Innovation (WIT2)
W5 0.81 f.p. 0.65
W6 0.71 37.98 0.50
W7 0.81 42.12 0.65
In examining patterns for large standardised residuals after respecification, two pairs of standard-ised residuals exceeded the absolute value of 2.58. As presented in Table 5, the standardised residual value was −3.13 for items W2 and W5 and 4.89 for item W4 and W7. However, as the standardised residual values were determine from a substantive point of view, there was no need for modification. Moreover, from a theoretical point of view, each variable of the two pairs appeared to measure different concepts (i.e. no possible definitional overlap).
Table 5
Standardised residual covariance matrix.
Item W1 W2 W4 W5 W6 W7 W1 0.00 W2 0.43 0.00 W4 −0.43 −0.23 0.00 W5 −1.64 −3.13 −0.63 0.00 W6 −1.77 −1.86 0.40 1.97 0.00 W7 2.00 1.90 4.89 −0.34 −1.39 0.00 The respecified model yielded an acceptable lev-el of fit: χ2 = 165.35,df = 8, GFI = 0.98, AGFI =
0.95, RMSEA = 0.08, RMR = 0.02, IFI = 0.98, NFI = 0.98, CFI = 0.98, and TLI = 0.96. All variables had loadings greater than 0.50 and allt-values were highly significant (p <0.001), confirming convergent validity. There was no problem of a Heywood case because all the factor loadings were estimated to be smaller than 1. The R2 values of all the variables
were greater than 0.50, which was indicative of the reliability of the variables. The correlation coefficient between the two factors was 0.662, thus indicating discriminant validity. Based on the acceptable level of the fit indices, this two-factor model was consid-ered to have upheld unidimensionality.
Table 6 summarises the reliability of each fac-tor. Both factors have a Cronbach alpha greater than 0.70, which shows measurement scales consisting of a set of homogeneous items to measure the meaning of the factor. Composite reliability for each factor
in the CFA model was above 0.60, demonstrating that these factors had adequate internal consisten-cy and were sufficient in their representation of the construct. Both factors also had AVE values greater than 0.50, indicating that more variance was cap-tured by the variables within each factor and shared more variance in the factor than with the other fac-tor. This also means that the construct relative to the amount of variance was due to measurement er-ror. The final value of Cronbach’s alpha of workplace innovation construct was 0.849, thus confirming the reliability of this construct.
Table 6
Reliability tests of WIT construct.
Factor α CR AVE
Individual Creativity (WIT1) 0.83 0.86 0.62 Team Innovation (WIT2) 0.82 0.88 0.61
Conclusions
Workplace innovation is crucial for many of to-day’s organisations. In order to formalise the con-cept of workplace innovation, reliable and valuable measurement is needed. This can help organisations generate valuable creative ideas and implement high quality innovative practices. The aim of the research is to enhance current understandings of workplace innovation and to improve the way it is measured. Workplace innovation is proposed in this study to consist of two related dimensions, namely, individual creativity and team innovation. This study investi-gated the construct validity of workplace innovation through both exploratory factor analysis (EFA) and confirmatory factor analysis (CFA).
EFA was performed using principal component analysis (PCA) with varimax rotation to assess the dimensionality of the workplace innovation con-struct. To interpret the meaning of each factor, the salient variables were identified and used as the in-dicators for the explanation. The salient variables identified for each extracted factor were higher than 0.5, indicating a substantial degree of contribution of each variable to its extracted factor. Thus, 7 variables with factor loadings ranging from 0.703 to 0.857 were retained. The study results support that the accura-cy of the factor solutions of the EFA model is depen-dent on the magnitudes of communalities and factor loadings as well as the level of overdetermination. This finding confirms the results from other studies which have highlighted the importance of high factor loadings, high communalities, and a reasonable lev-el of overdetermination in obtaining quality factor solutions [47, 60].
To assess the reliability and validity of the work-place innovation construct, CFA was conducted us-ing the maximum likelihood estimation method. To improve the model fit, the structure of the con-struct was slightly refined by eliminating variable W3, which had relatively high modification indices. After the model re-specification process, the CFA model fit very well with the collected data and the relationships between the observed variables and la-tent variables were significant.
The validity and reliability of the construct were confirmed in the EFA and in the CFA. The results from both methods were consistent and identified two dimensions of workplace innovation including individual creativity (WIT1) and team innovation (WIT2). Workplace innovation requires the generat-ing force of both individual creativity and team inno-vation to create and implement new processes, prod-ucts, services, and methods of delivery in the public sector [61]. Therefore, these measures are deemed ap-propriate proxies that can be used to measure work-place innovation among engineers in the APS.
To improve workplace innovation, it is necessary to measure and consider individual creativity and team innovation. Objective measures such as patent counts, technical reports, or dollar value of return on investment of innovative products can usually only be assessed for specific tasks of scientists and R&D workers [62]. However, objective measures could not be used to measure engineering tasks which are more structured, routine, and technical service oriented. Most engineers’ jobs do not commence in a vac-uum, but instead require incremental performance improvements or modifications to existing products, processes, or systems. Therefore, research should be undertaken in the engineering work context. Accord-ingly, it is anticipated that workplace innovation measurements would be useful for senior managers to effectively assess, and improve, individual creativ-ity and team innovation within their organisation. Senior managers could utilise workplace innovation ratings to design interventions which would increase creative and innovative resources, resulting in engi-neers experiencing opportunities to exercise their cre-ativity and implement innovative ideas, thereby en-hancing workplace innovation. This study can be im-plemented with TRIZ approach which is set of novel methods, techniques and tools for inventive design [63]. Both approaches could collectively develop en-gineers to be more innovative during their practice of engineering design, new product development and process improvement.
The study has provided important findings, how-ever there is also a potential limitation. Individual
level variables were collected using self-reports, based on the preliminary nature of this study. This means respondents may not have presented true representa-tions for sensitive items, and as such were not includ-ed. Nevertheless, the validity of self-reports is also justified because they can be used to measure objec-tive and subjecobjec-tive data [64]. In addition, the large sample permitted the findings to be generalised to a larger population [65]. Furthermore, self-reported bias does not appear to be a serious problem for the study findings due to evidence of construct validity between the variables.
Future research could also examine the relation-ships between organisational factors and workplace innovation using the developed measurements. Sug-gestions for future empirical research include investi-gating workplace innovation practices, types of lead-ership, organisational culture, and career satisfaction factors to increase understanding of the relationships between them. Such investigations could help pro-vide a framework to aid Commonwealth departments in encouraging creativity and innovation among their engineers.
References
[1] Moore M., Hartley J., Innovations in governance, Public Management Review, 10, 3–20, Jan. 2008. [2] Walker R.M.,An empirical evaluation of innovation
types and organizational and environmental charac-teristics, Journal of Public Administration Research and Theory, 18, 591–615, October 2008.
[3] Hilmer F.G., Rayner M.R., Taperall G.Q., Nation-al Competition Policy: Report by the Independent Committee of Inquiry, Canberra: AGPS, 1993. [4] Hood C., A public management for all seasons?,
Public Administration, 69, 3–19, 1991.
[5] Fernandez S., Pitts D.W., Understanding employ-ee motivation to innovate: evidence from front line employees in United States federal agencies, Aus-tralian Journal of Public Administration, 70, 202– 222, 2011.
[6] Head B.W.,Public administration and the promise of evidence-based policy: experience in and beyond Australia, Asia Pacific Journal of Public Adminis-tration, 36, 48–59, 2014.
[7] Australian National Audit Office,Innovation in the public sector: Enabling Better Performance, Driving New Directions, Canberra: Commonwealth of Aus-tralia, 2009.
[8] Management Advisory Committee [MAC], Empow-ering change: FostEmpow-ering innovation in the Australian public service, ed. Canberra, Australia: Australian Public Service Commission, 2010.
[9] McMurray A.J., Islam M.M., Sarros J.C., Pirola-Merlo A., Workplace innovation in a nonprofit or-ganization, Nonprofit Management and Leadership, 23, 367–388, Feb. 2013.
[10] Hair J.F., Black W.C., Babin B.J., Anderson R.E., Multivariate data analysis: a global perspective, Basım Pearson Education, 2010.
[11] Gerbing D.W., Anderson J.C.,An updated paradigm for scale development incorporating unidimension-ality and its assessment, Journal of Marketing Re-search, pp. 186–192, May 1988.
[12] Kline R.B., Principles and practice of structural equation modeling, New York, NY: Guilford pub-lications, 2015.
[13] Totterdill P., Exton R.,Defining workplace innova-tion: the fifth element, Strategic Direction, 30, 12– 16, Aug. 2014.
[14] Pot F., Workplace innovation for better jobs and performance, International Journal of Productivity and Performance Management, 60, 404–415, Apr. 2011.
[15] Amabile T.M.,A model of creativity and innovation in organizations, Research in Organizational Behav-ior, 10, 123–167, Jan. 1988.
[16] Panuwatwanich K., Stewart R.A., Mohamed S.,The role of climate for innovation in enhancing business performance: the case of design firms, Engineering, Construction and Architectural Management, 15, 407–422, 2008.
[17] Kim S., Yoon G., An innovation-driven culture in local government: do senior manager’s transforma-tional leadership and the climate for creativity mat-ter?, Public Personnel Management, 44, 147–168, June 2015.
[18] Wynen J., Verhoest K., Ongaro E., van Thiel S., Innovation-oriented culture in the public sector: do managerial autonomy and result control lead to in-novation?, Public Management Review, 16, 45–66, 2014.
[19] Brettel M., Cleven N.J.,Innovation culture, collabo-ration with external partners and NPD performance, Creativity and Innovation Management, 20, 253– 272, 2011.
[20] Koberg C.S., Chusmir L.H.,Organizational culture relationships with creativity and other job-related variables, Journal of Business Research, 15, 397– 409, 1987.
[21] Wipulanusat W., Panuwatwanich K., Stewart R.A., Exploring leadership styles for innovation: an ex-ploratory factor analysis, Ekonomia i Zarzadzanie, 9, 7–17, 2017.
[22] Oke A., Munshi N., Walumbwa F.O.,The influence of leadership on innovation processes and activities, Organizational Dynamics, 38, 64–72, Jan. 2009. [23] Woodman R.W., Sawyer J.E., Griffin R.W.,Toward
a theory of organizational creativity, Academy of Management Review, 18, 293–321, Apr. 1993. [24] Rank J., Pace V.L., Frese M.,Three avenues for
fu-ture research on creativity, innovation, and initia-tive, Applied Psychology, 53, 518–528, 2004. [25] Scott S.G., Bruce R.A.,Determinants of innovative
behavior: a path model of individual innovation in the workplace, Academy of Management Journal, 37, 580–607, June 1994.
[26] Moon M.J., The pursuit of managerial entrepre-neurship: does organization matter?, Public Admin-istration Review, 59, 31–43, 1999.
[27] Borins S., The challenge of innovation in govern-ment: endowment for the business of government, Arlington: PricewaterhouseCoopers, 2006.
[28] Light P.C.,Sustaining innovation: creating nonprof-it and government organizations that innovate nat-urally, San Francisco, CA: Jossey-Bass, 1998. [29] Boyne G.A., Gould-Williams J.S., Law J., Walker
R.M.,Explaining the adoption of innovation: an em-pirical analysis of public management reform, Envi-ronment and Planning C: Government and Policy, 23, 419–435, June 2005.
[30] McGregor J., The world’s most innovative compa-nies, Business Week Online, 9, May 2007.
[31] Amabile T.M., Tighe E., Questions of creativity, Creativity, ed. New York, NY, US: Simon & Schus-ter, pp. 7–27, 1993.
[32] Bolin M., H¨arenstam A.,An empirical study of bu-reaucratic and post-bubu-reaucratic characteristics in 90 workplaces, Economic and Industrial Democra-cy, 29, 541–564, Nov. 2008.
[33] Hoch J.E., Shared Leadership and Innovation: The Role of Vertical Leadership and Employee Integrity, Journal of Business and Psychology, 28, 159–174, June 2013.
[34] Shin S.J., Zhou J., Transformational leadership, conservation, and creativity: evidence from Korea, Academy of Management Journal, 46, 703–714, Dec. 2003.
[35] West M., Farr J., Innovation and Creativity at Work: Psychologi-cal and Organisational Perspec-tives, Chichester: JohnWiley, 1990.
[36] Axtell C.M., Holman D.J., Unsworth K.L., Wall T.D., Waterson P.E., Harrington E.,Shopfloor in-novation: facilitating the suggestion and implemen-tation of ideas, Journal of Occupational and Orga-nizational Psychology, 73, 265–285, Sep. 2000.
[37] Tidd J., Pavitt K., Bessant J.,Managing innovation integrating technological, market and organisational change, England: Wiley Chichester, 2001.
[38] Torugsa N.A., Arundel A.,The nature and incidence of workgroup innovation in the Australian public sector: evidence from the Australian 2011 state of the service survey, Australian Journal of Public Ad-ministration, 75, 202–221, 2015.
[39] Torugsa N., Arundel A., Complexity of Innovation in the public sector: a workgroup-level analysis of related factors and outcomes, Public Management Review, 18, 392–416, 2016.
[40] Tabachnick B.G., Fidell L.S., Using multivariate statistics, Needham Height, MA: Allyn & Bacon, 2007.
[41] George D., Mallery P.,IBM SPSS Statistics 23 Step by Step: A Simple Guide and Reference, New York, NY: Routledge, 2016.
[42] Pallant J., SPSS survival manual: a step by step guide to data analysis using IBM SPSS, Maiden-head, UK: McGraw-Hill, 2013.
[43] Field A.,Discovering statistics using IBM SPSS sta-tistics, 4th ed. London: SAGE Publications, 2013. [44] Child D.,The essentials of factor analysis, 3rd ed.
New York, NY: Continuum International Publish-ing Group, 2006.
[45] Cattell R.B.,Factor analysis, Westport, CT: Green-wood Press, 1973.
[46] Fabrigar L.R., Wegener D.T., MacCallum R.C., Strahan E.J.,Evaluating the use of exploratory fac-tor analysis in psychological research, Psychological Methods, 4, 272–299, Sep. 1999.
[47] MacCallum R.C., Widaman K.F., Zhang S., Hong S., Sample size in factor analysis, Psychological Methods, 4, 84–99, Mar. 1999.
[48] Byrne B.M., Structural equation modeling with AMOS: basic concepts, applications, and program-ming, New York: Routledge, 2013.
[49] Shah R., Goldstein S.M.,Use of structural equation modeling in operations management research: look-ing back and forward, Journal of Operations Man-agement, 24, 148–169, Jan. 2006.
[50] Ping R.A. Jr,On assuring valid measures for theo-retical models using survey data, Journal of Business Research, 57, 125–141, Feb. 2004.
[51] Kelloway K.E.,Using Lisrel for Structural Equation Modeling: A researcher’s guide, Thousand Oaks: CA: Sage Publications, 1998.
[52] MacCallum R., Specification searches in
covari-ance structure modeling, Psychological Bulletin, 100, 107–120, July 1986.
[53] Lowry P.B., Gaskin J.,Partial Least Squares (PLS) Structural Equation Modeling (SEM) for building and testing Behavioral Causal Theory: when to choose it and how to use it, IEEE Transactions on Professional Communication, 57, 123–146, June 2014.
[54] Creswell J.W., Research design: qualitative, quanti-tative, and mixed methods approaches, 4th ed.: Sage publications, 2013.
[55] Bollen K.A., Structural equations with latent vari-ables, New York: John Wiley & Sons, 2014. [56] Nunnally J., Psychometric theory, 2nd ed. New
York: NY: McGraw-Hill, 1978.
[57] Bagozzi R.P., Yi Y.,On the evaluation of structural equation models, Journal of the Academy of Mar-keting Science, 16, 74–94, Mar. 1988.
[58] Koufteros X.A.,Testing a model of pull production: a paradigm for manufacturing research using struc-tural equation modeling, Journal of Operations Man-agement, 17, 467–488, June 1999.
[59] Gallagher D., Ting L., Palmer A., A journey into the unknown; taking the fear out of structural equa-tion modeling with AMOS for the first-time user, The Marketing Review, 8, 255–275, 2008.
[60] Hogarty K.Y., Hines C.V., Kromrey J.D., Ferron J.M., Mumford K.R., The Quality of Factor Solu-tions in Exploratory Factor Analysis: The Influence of Sample Size, Communality, and Overdetermina-tion, Educational and Psychological Measurement, 65, 202–226, Apr. 2005.
[61] Mulgan G., Albury D.,Innovation in the public sec-tor, London: Cabinet office, 2003.
[62] De Jong J., Den Hartog D., Measuring innovative work behaviour, Creativity and Innovation Manage-ment, 19, 23–36, 2010.
[63] Altshuller G., The Innovation Algorithm: TRIZ, systematic innovation, and technical creativity, Worcester, MA: Technical Innovation Center, Inc., 1999.
[64] Crockett L.J., Schulenberg J.E., Petersen A.C., Congruence between objective and self-report data in a sample of young adolescents, Journal of Ado-lescent Research, 2, 383–392, 1987.
[65] Chan D., Lance C.,So why ask me? Are self-report data really that bad, Statistical and Methodological Myths and Urban Legends: Doctrine, Verity and Fa-ble in the Organizational and Social Sciences, pp. 309–336, 2009.