1
The neuro-immune fingerprint of major neuro-cognitive psychosis or deficit schizophrenia: a
supervised machine learning study.
Hussein Kadhem Al-Hakeima, Abbas Fadhel Al-Mullab, Michael Maesc,d,e.
a Department of Chemistry, College of Science, University of Kufa, Iraq. E-mail:
b Medical Laboratory Technology Department, College of Medical Technology, The Islamic University, Najaf, Iraq. E-mail: [email protected]
c* Department of Psychiatry, Faculty of Medicine, Chulalongkorn University, Bangkok, Thailand;
d Department of Psychiatry, Medical University of Plovdiv, Plovdiv, Bulgaria;
e IMPACT Strategic Research Centre, Deakin University, PO Box 281, Geelong, VIC, 3220, Australia.
Corresponding author
Prof. Dr. Michael Maes, M.D. Ph.D. Department of Psychiatry
Faculty of Medicine Chulalongkorn University Bangkok, 10330
Thailand
https://scholar.google.co.th/citations?user=1wzMZ7UAAAAJ&hl=th&oi=ao
E-mail: [email protected].
2 Abstract
No studies have examined the immune fingerprint of major neuro-cognitive psychosis (MNP)
or deficit schizophrenia using M1 macrophage cytokines in combination with chemokines such as
CCL-2 and CCL-11. The present study delineated the neuro-immune fingerprint of MNP/deficit
schizophrenia by analyzing plasma levels of IL-1β, sIL-1RA, TNF-α, sTNFR1, sTNFR2, CCL-2
and CCL-11 in MNP (n=120) versus healthy controls (n=54) in association with neurocognitive
deficits (as assessed with the Brief Assessment of Cognition in Schizophrenia) and PHEMN
(psychotic, hostility, excitation, mannerism and negative) symptoms. All immune biomarkers were
significantly higher in MNP than in normal controls. MNP was best predicted by a combination of
CCL-11, TNF-α, IL-1β and sIL-1RA which yielded a bootstrapped (n=2000) area under the
Receiver Operating Curve of 0.985. Composite scores reflecting M1 macrophage activity and
neurotoxic potential including combined effects of CCL-11 plus CCL-2 were significantly increased
in MNP. Nevertheless, the effects of increased IL-1β and TNF-α in MNP were attenuated
(statistically) by increased sIL-1RA and sTNFR2, two negative immune-regulatory markers. A large
part of the variance in PHEM (38.4%-52.6%) and negative (65.8-7439%) symptoms was explained
by combinations of immune markers whereby CCL-11 was consistently the most important. The
immune markers also explained a large part of the variance in the Mini Mental State Examination, List Learning, Digit Sequencing Task, Category Instances, Controlled Word Association, Symbol
Coding and Tower of London. Soft Independent Modeling of Class Analogy performed on the
biomarkers showed that the inter-class distance between the models constructed around MNP and
controls was 19.3 indicating a good separation. Partial Least Squares analysis showed that 72.7% of
-3
11, TNF-α (all positively) and education (inversely). It is concluded that the combination of the
above-mentioned markers defines MNP as a distinct neuro-immune disorder and that those markers
in combination explain a large part of the variance in memory and executive impairments and PHEMN symptoms.
4 Introduction
There is now evidence that schizophrenia and deficit schizophrenia are characterized by
activated neuro-immune pathways, including increased levels of pro-inflammatory and anti
-inflammatory cytokines, chemokines, complement factors and acute phase proteins, including
haptoglobin [1, 2, 3, 4, 5, 6, 7]. Based on new results obtained in our laboratories we proposed a new
neuro-immune theory of schizophrenia, namely the IRS-CIRS theory [5, 8]. This theory considers
that schizophrenia is accompanied by a simultaneous activation of the immune responses system (IRS) and the compensatory immune-regulatory system (CIRS). Activation of the IRS is indicated by
increased levels of macrophage M1, T helper (Th)-1 and Th-17 cells and signs of a chronic
inflammatory process including increased levels of C3 and C4 and acute phase proteins [2,5,9-11]. The same patientsalso show CIRS activation which is, at least in part, secondary to IRS activation
and, consequently, downregulates the IRS thereby protecting against an overzealous immune
-inflammatory response [5]. Activation of the CIRS in schizophrenia is indicated by activated Th-2
and T regulatory (Treg) phenotypes with increased IL-4 and IL-10 levels, increased concentrations
of some acute phase proteins that have immune-regulatory effects, and increased plasma
concentrations of soluble IL-1 receptor antagonist (sIL-1RA), sTNFR-60 (sTNFR1) and sIL-2R-80
(sTNFR2) [5, 12, 13].
Increased levels of sIL-1RA indicate activation of macrophage M1 cells but increased levels
antagonize the IRS by attenuating pro-inflammatory IL-1β signaling [14]. Both sTNFR1 and
sTNFR2 are released in the serum following pro-inflammatory signals, including stimulation by
TNFα, IL-1 and IL-6 [15] and these receptor levels may antagonize pro-inflammatory TNFα
signaling [16,17]. Moreover, TNFR2 are neuroprotective and neuroregenerative in part by
5
impairments in innate immunity as for example lowered natural IgM responses to oxidative
specific epitopes (OSEs) which have antioxidant and anti-inflammatory properties and protect
against microbial infections [7].
A second part of the IRS - CIRS theory is that immune compounds produced and released by
both components may have neurotoxic and excitotoxic effects thereby causing neuroprogressive
processes [5]. Examples are the pro-inflammatory cytokines, IL-1β, IL-6 and TNF-α, increased
production of Th-1-associated IFN-γ and tryptophan catabolites (TRYCATs), and Th-2 related
cytokines and chemokines, such as IL-4 and CCL-11 (eotaxin) [5, 20-23]. The neurotoxic effects of
pro-inflammatory cytokines and TRYCATs, such as picolinic and xanthurenic acid, may explain that
in schizophrenia immune activation indices are strongly associated with symptomatology and
neurocognitive defects [22-24 ]. CCL-11 may act as an “accelerated brain-ageing chemokine”
(ABAC) or an “endogenous cognition deteriorating chemokine” (ECDC) by lowering hippocampal
neurogenesis, while in schizophrenia patients, increased CCL-11 levels are associated with
impairments in executive, memory and attention functions as well as formal thought disorders and
negative symptoms [22]. Moreover, schizophrenia is accompanied by a simultaneous upregulation of
CCL-11 and monocyte chemoattractant protein (MCP)-1 or CCL-2, a chemokine that regulates
monocyte migration [25]. A simultaneous upregulation of both CCL-2 and CCL-11 could, in theory,
cause more cognitive impairments as observed in mild cognitive impairment [26]. Nevertheless, no
studies have examined the combined effects of M1 macrophage cytokines and CCL-11 and CCL-2
on the phenomenology and cognitive functions of schizophrenia subjects.
Furthermore, we discovered that schizophrenia could reliably be divided into two different
nosological entities, namely major neuro-cognitive psychosis (MNP, largely overlapping with deficit
6
SNP and MNP are both defined by different neurocognitive and neuro-immune features with MNP being the more severe illness characterized by IRS activation and deficits in the CIRS, including in
natural IgM [6]. Moreover, in MNP, indices of immune activation coupled with deficits in the CIRS
explain a large part of the variance in executive functions, memory and attention deficits, as well as
psychotic, hostility, excitation, mannerism (PHEM) and negative symptoms [28, 29]. Nevertheless,
no studies have examined the neuro-immune fingerprint of MNP or deficit schizophrenia in
association with its phenomenology using M1 macrophage cytokines in combination with
chemokines such as CCL-2 and CCL-11.
Hence, the present study delineated the neuro-immune fingerprint of MNP by analyzing
plasma levels of IL-1β, sIL-1RA, TNF-α, sTNFR1, sTNFR2, CCL2 and CCL-11 in MNP versus
healthy controls in association with neurocognitive deficits and PHEM and negative symptoms. The
specific hypothesis is that a combination of the above-mentioned cytokines, receptors and
chemokines defines MNP or deficit schizophrenia as a distinct nosological entity and that the
combination of neuro-immune markers explains a large part of the variance in schizophrenia
phenomenology.
Methods
Participants
The present study recruited 120 participants with deficit schizophrenia and 54 age-matched
healthy subjects. The samples were collected at Ibn-Rushd Training Hospital for Psychiatric
Medicine, Baghdad, Iraq during the period of December 2018 till February 2019. Patients and
controls were recruited from the same catchment area, namely Baghdad city, Iraq. All patients
7
Schedule of Deficit Schizophrenia (SDS) criteria of deficit schizophrenia [30]. Furthermore, all
patients included complied with the diagnostic criteria of MNP, which are more restrictive than the
SDS criteria [20]. MNP/deficit schizophrenia will be abbreviated as MNP in our paper. All patients
were in a stable phase of illness, i.e., they did not suffer from acute episodes the year prior to the
study.
We excluded patients and controls who had ever been using medications known to interfere with immune functions, such as glucocorticoids or immunosuppressive drugs, and those who took
supplements with antioxidants or ω3-polyunsaturated fatty acids the months prior to the study. We
excluded MNP patients who suffered from acute psychotic episodes the year prior to inclusion and
those with axis-1 DSM-IV-TR disorders other than schizophrenia, including major depression,
bipolar disorder, schizoaffective disorder, substance use disorders, and psycho-organic disorders.
Healthy volunteers were excluded when they showed a current or lifetime diagnosis of any axis I
diagnosis and when they had a positive family history of schizophrenia. MNP patients and controls
were excluded when they presented with neuro-inflammatory or neurodegenerative disorders
including stroke, Parkinson’s disease, multiple sclerosis and Alzheimer’s disease, or medical illnesses
such as psoriasis, rheumatoid arthritis, COPD, inflammatory bowel disease, and diabetes mellitus (type 1 and 2). To eliminate any effects of overt inflammation from other disorders, serum C-reactive
protein (CRP) was evaluated in all samples and we excluded subjects with CRP values >6 mg/L.
Allcontrols and patients as well as the guardians (parents or the closer family members) of
patientsgave written informed consent prior to participation in our study. The study was conducted
according to International and Iraq ethics and privacy laws. Approval for the study was obtained
from the Institutional Review Board of the University of Kufa (347/2019), which is in compliance
8
Helsinki, The Belmont Report, Council for International Organizations of Medical
Sciences (CIOMS) Guideline and International Conference on Harmonization in Good Clinical
Practice (ICH-GCP).
Measurements
Clinical assessments
The diagnosis of schizophrenia was made by a senior psychiatrist specialized in
schizophrenia according to DSM-IV-TR diagnostic criteria using the Mini-International
Neuropsychiatric Interview (M.I.N.I.),in a validated Arabic translation (Iraqi dialect). The same day
as the M.I.N.I., the same senior psychiatrist used a semi-structured interview to assess socio
-demographic and clinical data in patients and controls. He also assessed the SDS [30], the Scale for
the Assessments of Negative Symptoms (SANS) [31], the Positive and Negative Syndrome Scale
(PANSS) [32], the Brief Psychiatric Rating Scale (BPRS) [33] and the Hamilton Depression Rating
Scale (HDRS) [34].
On the same day, neuropsychological tests were assessed by a well-trained research
psychologist, blinded to the clinical diagnosis. We used the Brief Assessment of Cognition in
Schizophrenia (BACS) [35] to assess cognitive functions. The test comprises List Learning (probing
verbal episodic memory), Digit Sequencing Task (probing working memory), Category Instances
(semantic fluency) and Controlled Word Association (letter fluency) (both probing verbal fluency
and semantic memory), Symbol Coding (probing attention) and Tower of London (probing executive
functions, reasoning and problem solving). The research psychologist also assessed the Mini-Mental
9
criteria to make the diagnosis of Tobacco Use Disorder (TUD). Body mass index (BMI) was assessed
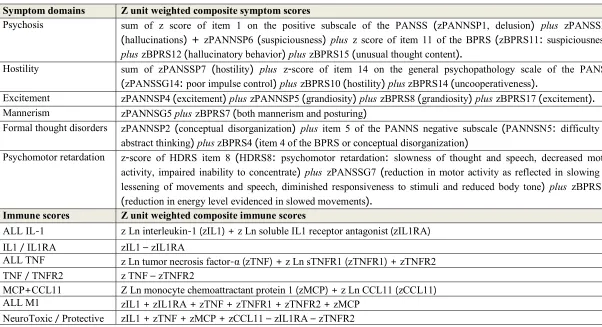
during the same day of the clinical interview and was scored as body weight (kg) / length (m2). Based on our previous publications [6,8,29], we constructed different z-unit weighted
composite scores based on items of the BPRS, HDRS, PANSS and SANS. Table 1 lists the different
composites used as well as their computation. As such we computed scores reflecting PHEM
(psychosis, hostility, excitation and mannerism) symptoms, FTD (formal thought disorders) and
PMR (psycho-motor retardation) [6,8,23,29].
Assays
In the early hours of the morning fasting venous blood (5 mL) was sampled in patients and
controls utilizing disposable needle and plastic syringes. The samples were transferred into a clean
plain tube. Blood was left at room temperature for 15 min for clotting, centrifuged 3000 rpm for 10
min, and then serum was separated and transported into two Eppendorf tubes to be stored at -80 °C
until analyzed. Serum CRP was measured using a kit supplied by Spinreact®, Spain. The test is based on the principle of the latex agglutination. Commercial ELISA sandwich kits were used to measure
serum CCL-11, MCP-1, IL-1β, sIL-1RA, sTNFR1, sTNFR2, and TNF-α. (Elabscience, Inc. CA,
USA). The procedures were followed exactly without modifications according to manufacturer’s
instructions. The intra-assay coefficients of variation (CV) (precision within-assay) were < 7.0%.
Statistical analysis
Analysis of variance (ANOVA) was employed to assess differences in scale variables
10
(χ2-test) were used to check associations between nominal variables (e.g. sex and diagnosis). Correlation matrices were computed to assess associations among the biomarkers, clinical and
cognitive scores using Pearson’s product moment and Spearman’s rank order correlation coefficients.
We computed z scores of the biomarkers in order to display differences in mean (SE) values of the
biomarkers among diagnostic categories. We employed multivariate general linear model (GLM)
analysis to delineate the effects of diagnosis on the biomarkers and their composite scores, while
controlling for confounding variables including nicotine dependence, sex, age, BMI and education.
Consequently, we carried out a) tests for between-subjects effects to delineate the effects of
independent variables on biomarkers and b) pairwise comparisons among treatment means. Model
-generated (GLM analysis) estimated marginal mean (SE) values were computed and shown as z
scores. P values were corrected for false discovery rate [36]. We used binary logistic regression
analysis to check the predictors of deficit schizophrenia (dependent variable) versus controls
including Odd’sratios with 95% confidence intervals. We used Receiver Operating Characteristics
(ROC) analyses and computed the area under the ROC curve as well as sensitivity and specificity to
estimate the diagnostic performance of test results. Multiple regression analysis was employed to
delineate the most significant biomarkers that predict the symptom domains and neurocognitive tests.
All regressionanalyses were checked forcollinearity using tolerance and VIF values. We used an
automaticstepwisemethodwithinclusionofvariableswitha p-to-entryof 0.05 andp-to-removeof
0.06,while checkingtheR2 change. When homoscedasticity was rejected (tested with the White and
Breusch-Pagan tests and through inspection of plots of standardized residual versus standardized
predicted values) we used heteroscedascticity-consistent standard error (SE) (HCSE) or robust SE
11
results are reported when there are differences between both approaches. All biomarkers were
transformed to normalize their data distribution (probed with the Kolmogorov-Smirnov test) namely
sTNFR1, sTNFR2, MCP1, TNF-α, IL-1β in Ln transformation and sIL-1RA and CCL-11 in square
root transformation. Tests were 2-tailed and a p-value of 0.05 was used for statistical significance.
All statistical analyses were performed using IBM SPSS windows version 25, 2017. Statistical
analyses were conducted in accordance with the International Conference on Harmonisation E9
statistical principles (November 2005).
Machine learning techniques
We performed a joint principal component analysis (PCA) (with standard deviation weighting
process, 20-fold cross-validation scheme, and singular value decomposition) on the biomarkers in
both MNP and control subjects in order to display the distribution of both groups (differentiated by
marker color and shapes) in the multivariate space [37]. Support Vector Machine with linear kernel
(linear SVM) and radial basis function (RBF SVM) were used to classify patients and controls [37].
We normalized the input variables with a standard deviation weighting process and validated the
SVM model using a 10-fold cross-validation scheme. The classification results were summarized in
the confusion matrix in the form of predicted versus actual classes and are shownin a 2D scatter plot
with the best biomarkers as axes (patients and controls are color and shape-coded according to their
predefined classes). Linear discriminant analysis (LDA) was used as another method to classify
patients and controls. The LDA model computed on a training set was consequently validated in a
test set whereby the test subjects were allocated to the most probable class. The figures of merit are
12
discrimination plot with the canonical discriminant components whereby subjects (color and shape
-coded) that are located close to zero on an axis are associated with that class.
We also used Soft Independent Modeling of Class Analogy or Statistical Isolinear Multiple
Component Analysis (SIMCA) as a class modeling technique [37]. A training set (50% of the deficit
schizophrenia and 50% of the controls) was employed to construct PCA models of both patients and
controls using PCA performed on the biomarkers in both classes separately. The number of PCs
extracted to construct those models is determined by cross-validation and may differ between the
classes. In order to build the PCA models, we eliminated outliers as detected in score, influence,
stability and Hotelling’s T2 vs samples plots, and through inspection of residual values and
leverages. Patients and controls belonging to the test set are consequently projected into the PCA
models and critical limits of two computed distances are used to classify the subjects using F
tests, namely Si (the subject to model distance reflecting the distance of the subject to the target
class) and Hi or leverage (distance of subject to the model centre). In the current study, we show
two figures of merit namely a) the inter-class distance indicating how different both models are with
regard to the biomarkers with a distance > 3 indicating that the models can be adequately
distinguished; and b) the discrimination power with indicates the power of the biomarkers
discriminating patients from controls. Moreover, the outcome of SIMCA classification is visualized
using a Si/S0 (relative distance of the subjects to the class model) vs Hi plot. The computed class
membership critical limits allow to identify subjects: subjects located in the target class, aliens
(members of another group intruding into the target class limits), and subjects that fall outside the
13
Partial Least Squares path analysis (SmartPLS) was employed to delineate causal
associations [38] between biomarkers, neurocognitive functions and symptom profiles. Based on the
theories explained in the introduction, we considered that executive and memory impairments may
mediate the associations between biomarkers and schizophrenia symptom profiles [8,22]. Variables
are entered in the PLS analysis as indicators or as latent vectors (LV) extracted from a set of
indicators including a memory LV (extracted from 5 cognitive tests), a negative symptom LV
(extracted from negative symptoms) and a PHEM LV (extracted from the 4 PHEM symptoms). We
only perform complete, consistent bootstrapping (2000 bootstraps) PLS path analysis when a) the
SRMR (overall quality of the model) < 0.080; b) LV have an adequate reliability, namely Cronbach’s
alpha > 0.7, composite reliability > 0.7, rho_A > 0.80 and average variance extracted (AVE) > 0.500;
c) all indicators of the different LVs show factor loadings >0.500 at p<0.001; and d) construct cross
validated redundancies and communalities are adequate [38]. Subsequently we used complete
bootstrapping (2000 subsamples) and consistent PLS path modeling to compute path coefficients
with p-values, and total, total indirect and specific indirect effects.
Results.
Socio-demographic and clinical data
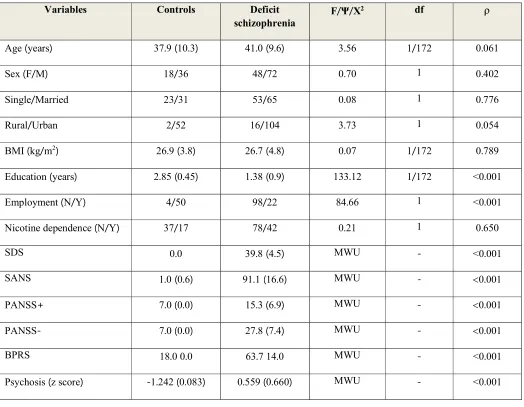
Table 2 shows the socio-demographic and clinical data of the MNP patients and controls
included in our study. There were no significant differences in age, sex ratio, marital status,
rural/urban ratio, BMI and nicotine dependence between patients and controls. Patients with MNP
had significantly lower education and significantly more unemployment than normal controls. All
14
Learning, Digit Sequencing Task, Category Instances, Controlled Word Association, Symbol Coding
and Tower of London were significantly lower in patients than in controls.
Biomarkers in deficit SCZ versus controls
In order to examine the associations between diagnosis and the biomarkers we have
performed multivariate GLM analysis with diagnosis (MNP versus controls), nicotine dependence,
sex, age, BMI and education as explanatory variables. Table 3 shows that there was a highly
significant effect of diagnosis on the biomarkers with a huge effect size of 0.623, while all other
confounding variables were not significant. Tests of between-subject effects showed significant
associations between all 7 biomarkers and diagnosis while Table 4 (estimated marginal means) show
that all immune markers were higher in MNP than in controls. The greatest effect size was observed
for CCL-11 (0.406) followed by IL-1β and TNF-α (both around 0.20). All these differences
remained significant after p correction for FDR. Figure 1 shows the mean values of the z scores of
all biomarkers in MNP patients versus controls.
Table 3 also shows the associations between diagnosis and the composite scores. In order to examine the associations between diagnosis and the composites we have again performed
multivariate GLM analysis with diagnosis (MNP versus controls), nicotine dependence, sex, age,
BMI and education as explanatory variables. The results of GLM analyses followed by tests for
beteen-subject effects, Table 4 and Figure 1 show that ALL IL-1, ALL TNF, MCP+CCL-11, ALL
M1 and Neurotoxic/Protective ratio are higher in MNP than in controls. These differences remained
significant after p correction for FDR. The highest effect sizes are established for ALL M1 (0.456)
15
In order to delineate the best predictors of MNP we have performed binary logistic regression
analyses with MNP as dependent variable (and controls as reference group) and with the 7
biomarkers or their composite scores as explanatory variables while also entering age, sex, BMI, and
education (Table 5). Regression #1 shows that MNP was best predicted by sIL-1RA, CCL-11, TNF
-α and IL-1β (F=181.14, df=4, p<0.001) with an effect size of 0.911 (Nagelkerke). 96.6% of all cases
were correctly classified with a sensitivity of 97.5% and a specificity of 94.4%. The area under the
ROC curve was 0.993 (SE=0.005; p<0.001; 95% CI: 0.984 - 1.00) and the bootstrapped (2000
bootstraps) area ROC was 0.989 (0.974 - 0.999). Using the composite scores as explanatory variables
we found that ALL IL1, ALL TNF and MCP+CCL11 were the best predictors of MNP versus
controls (F=169.52, df=3, p<0.001) with a Nagelkerke value of 0.876; 92.5% of all cases were
correctly classified with a sensitivity of 95.0% and a specificity of 87.0%. The area under the ROC
curve was 0.988 (SE=0.006; p<0.001; 95% CI: 0.977 - 0.999) and the bootstrapped (2000 bootstraps)
area ROC was 0.985 (0.970 - 0.996).
Effects of confounders
As shown in Table 2 we could not detect any effects of age, sex, nicotine dependence,
education or BMI on the biomarker data. We have also examined whether there were any effects of
psychotropic drug use on the results and therefore entered the drug state of the patients in the
multivariate regression shown in Table 2. There were no significant effects of olanzapine (n=11;
F=0.67, df=7/160, p=0.698), risperidone (n=109; F=0.67, df=7/160, p=0.698) and fluphenazine
(n=68; F=0.802, df=7/160, p=0.587) on the biomarkers, even without p-correction for FDR.
There were no significant effects of risperidone (F=1.88, df=9/161, p=0.058) and olanzapine
16
as well as BPRS, PHEM, PMR and FTD as dependent variavles). Multivariate GLM analysis
showed a modest although significant effect of fluphenazine on the same symptoms (F=2.08,
df=9/161, p=0.020), although none of the tests for between-subjects effects was significant even at
the p=0.05 level without p correction for FDR. There were no significant effects of risperidone
(F=1.99, df=7/163, p=0.059), olanzapine (F=1.99, df=7/163, p=0.059) and fluphenazine (F=0.60,
df=7/163, p=0.757) on the 7 neurocognitive tests
Associations between biomarkers and symptom domains
In order to delineate the effects of the biomarkers on symptom domains we performed multiple regression analysis with the symptom domains as dependent variables and the biomarkers,
age, sex, education, BMI and nicotine dependence as explanatory variables. In case of
heteroscedasticity, we recomputed the regression model using robust, heteroscedascticity-consistent
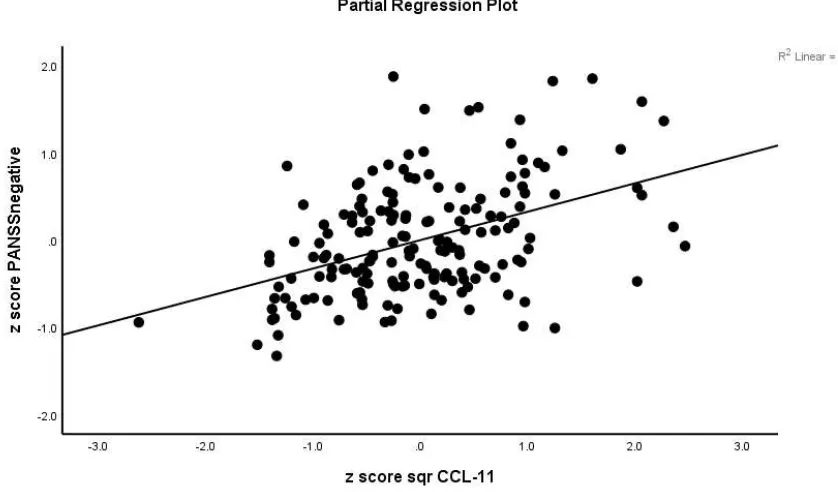
SE estimates (Table 6). A large part (65.8 - 74.9%) of the variance in negative symptoms
(regressions #1-#3: SDS, PANSS negative, SANS) was explained by the regression on CCL-11, IL
-1β, sIL-1RA, TNF-α and education. Figure 2 shows the partial regression plot of the PANSS
negative subscale score on CCL-11. Regression #4 shows that 32.0%of the variance in PMR was
predicted by CCL-11, IL-1β, sIL-1RA and TNF-α. We found that a large part of the variance in
psychotic symptoms (52.6%), excitation (0.435) and FTD (48.2%) was explained by the regression
on IL-1β, CCL-11, TNF-α and education. Hostility was best predicted by CCL-11, IL-1β and
education explaining 34.0% of the variance, while mannerism was best explained (38.4% of the
variance) by IL-1β, CCL-11, BMI and education.
17
Table 7 shows multiple regression analyses with cognitive test results as dependent variables
and biomarkers, age, sex, BMI, smoking and education as explanatory variables. Table 7 (regression
#1) shows that 60.1% of the variance in MMSE was explained by CCL-11, IL-1β, sIL-1RA,
sTNFR2. We found that 65.2% of the variance in List Learning scores was explained by the
regression on CCL-11, IL-1β, sIL-1RA, TNF-α, sex and education. 59.8% of the variance in the
Digit Sequencing Task scores was explained by CCL-11, IL-1β, sIL-1RA, sTNFR2, education and
BMI. Up to 44.0% of the variance in Category Instance scores was explained by three predictors,
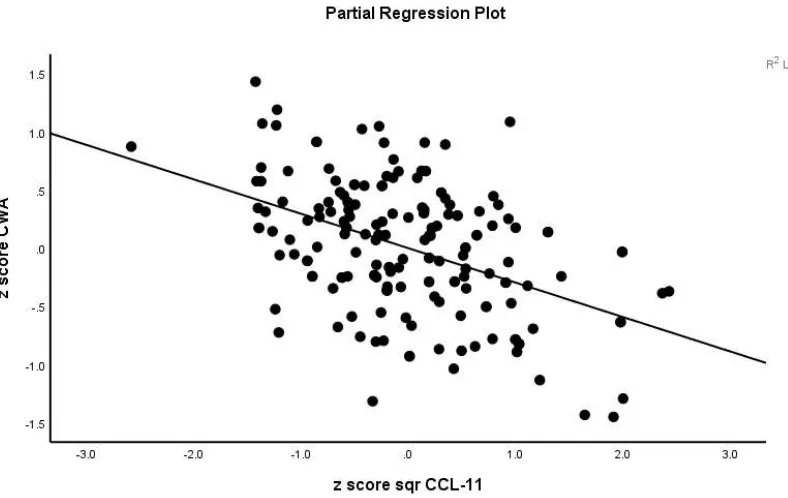
namely CCL-11, TNFα and education. A large part (75.7%) of the variance in the scores of
Controlled Word Association was explained by IL-1β, sIL-1RA, CCL-11, TNF-α, sTNFR2 and
education. Figure 3 shows the partial regression plot of the Controlled Word Association on CCL-11
values. Symbol Coding was best explained by a combination of CCL-11, IL-1β, sIL-1RA, sTNFR2
and education explaining 64.5% of the variance. The scores on the Tower of London test (69.2% of
the variance) were best explained by a combination of IL-1β, sIL-1RA, CCL-11, sTNFR2 and
education.
Results of machine learning
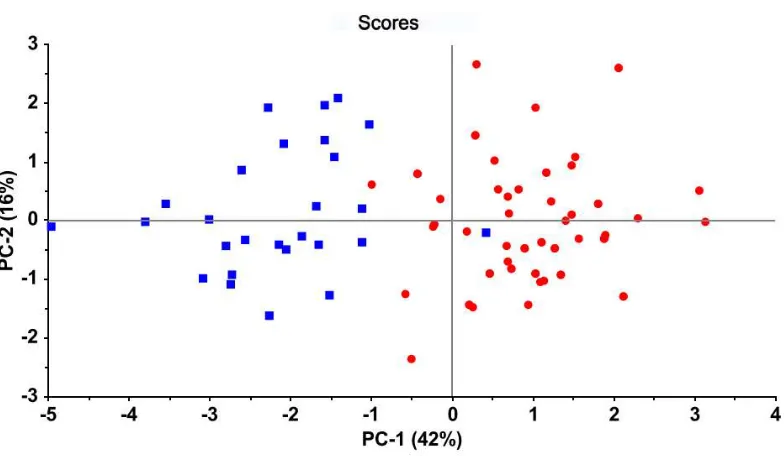
Figure 4 displays the PC score plot obtained by PCA performed on the biomarkers and
visualizes the distribution of patients and controls in a 2D space (PC1 and PC2). PC1 explains 42%
of the variance in the biomarkers and PC2 16% (together 58%). This display shows that the first two
PCs allow a clear differentiation of patients (red circles) vs controls (blue squares). Both classes
18
the plot and controls at the opposite side. The same pattern is observed in sequential plots of PC1
versus PC3 (13%), PC4 (10%), PC5 (10%), PC6 (8%) and PC7 (6%).
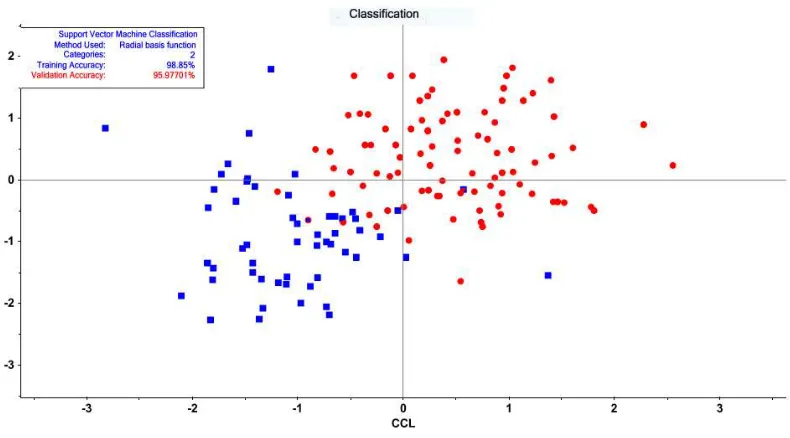
SVM with radial basis function and ten-fold cross-validation delineated 54 support vectors
including 25 controls and 29 MNP patients and shows a training accuracy of 98.85% and a validation
accuracy of 95.98%. Figure 5 shows a plot of the classification results with CCL-11 and TNF-α as
input variables. We performed LDA on training (50% of both classes) and test (remaining 50%) sets.
The confusion matrices of the training set showed an accuracy of 100%, whereas in the training set
the LDA model correctly classified 95.0% of the patients (sensitivity) and 96.3% of the controls
(specificity). Figure 6 shows the LDA discrimination plot for the subjects in the combined training
and test sets. Both classes are well separated and are located relatively close to zero on the
corresponding axes.
A SIMCA model was constructed on a calibration set (50% of MNP patients and 50% of
controls) andconsequently validatedina testset. During the training phase, we eliminated 1 control
and 5 patients as statistical outliers and both classes were modeled using 6 PCs. The inter-class
distance between the models was 19.3 indicating a good separation between the classes. Figure 7
shows the discrimination power of the 7 biomarkers discriminating MNP from controls. CCL-11 had
the greatest discrimination power, followed by sTNFR2 and MCP-1. The classification table shows
that 49 SCZ patients were authenticated as belonging to the target MNP class (sensitivity: 81.6%),
while there were 5 aliens, namely controls intruding in the critical limits of the MNP class (specificity: 81.5%).
19
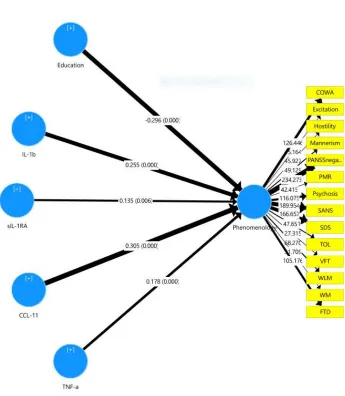
Figure 8 shows the results of a PLS path analysis examining the causal links between the
biomarkers, Tower of London (executive function), cognitive LV (extracted from FTD, Controlled
Word Association, Category Instances, List learning, Digit Sequencing), PMR (entered as one
indicator variable), PHEM LV (extracted from its 4 symptom scores), and negative symptom LV
(extracted from SDS, SANS and PANSS negative scores). In accordance with the cognitive
-schizophrenia theory depicted in the Introduction, we constructed a multistep path model with
multiple mediators [39] whereby cytokines-chemokines predict executive functions (Tower of
London scores), which in turn predict PMR and cognitive LV (memory functions combined with
FTD), whereas all those variables are putative predictors of PHEM and negative symptom LVs. The
overall fit of the PLS model was very good (SRMR=0.027), and the construct reliability and
discriminant validity of the LVs were excellent with all Cronbach’s alpha > 0.946, composite
reliability > 0.934, rho_A > 0.941 and average variance extracted > 0.741, whilst all outer LV
loadings > 0.756 at p<0.0001. We found that 69.2% of the variance in Tower of London scores was
explained by IL-1β, CCL-11, sTNFR1, sIL-1RA and education; 84.7% of the variance in the
cognitive LV was explained by the regression on TOL, IL-1β, CCL-11 and education, while 36.7%
of the variance in PMR was explained by scores on the Tower of London. 82.1% of the variance in
PHEM LV was explained by cognition LV, while 95.3% of the variance in negative symptom LV
was explained by the cognitive LV and PMR. There were significant total indirect effects of CCL-11
and IL-1β (all at p<0.0001), and sTNFR1 and sIL-1RA (all at p<0.05) on cognitive LV, negative LV,
PHEM LV and PMR.
20
London scores, PMR and all cognitive, PHEM and negative symptom indicators. The model quality
data were excellent with SRMR=0.025 and reliability data including Cronbach α=0.978, composite
reliability=0.980, rho-A=0.983 and average variance extracted=0.782, and all outer loadings > 0.785
at p<0.0001. We found that 72.7% of the variance in the overall phenomenology LV was explained
by the regression on IL-1β, sIL-1RA, CCL-11, TNF-α (all positively) and education (inversely).
Discussion
The first major of this study is that MNP/deficit schizophrenia (further abbreviated as MNP) is characterized by increased levels of all immune biomarkers, namely IL-1β, sIL-1RA, TNF-α, sTNFR1, sTNFR2, 2 and 11, and that MNP was best predicted by a combination of CCL-11, TNF-α, IL-1β and sIL-1RA with a bootstrapped area under the ROC of 0.985. Moreover, using SVM or LDA we found that these immune biomarkers significantly separated MNP from controls and that SIMCA showed that MNP is modeled as a distinct neuro-immune disorder.
IL-21
1β, IL-6, IL-2 and IL-10 [15], and therefore increased serum concentrations of these receptors indicate immune activation [21,47,51,52]. Hope et al. reported that increased levels of sTNFR1 in treated and untreated schizophrenia patients may indicate specific alterations in endothelium-related inflammatory processes in schizophrenia [45,46].
The findings on increased levels of TNF-α, IL-1β and sIL-1RA are now well validated in a meta-analysis performed on schizophrenia patients [53]. In another meta-analysis the authors [54] suggested that IL-1β could be a “state” marker of schizophrenia, given that this cytokine is raised in acute episodes followed by normalization under antipsychotic treatment, while increased TNF-α levels were proposed as a “trait marker” because its levels were maintained after treatment. Based on increased levels of sTNFR1 and sIL-1RA in schizophrenia, it was suggested that inflammation is a trait phenomenon and not the result of stress-related mechanisms associated with the acute episode of schizophrenia [43].
Importantly, in the present study we computed a composite score reflecting M1 macrophage activity (including IL-1β and TNF-α and their receptors) and found increased composite scores in MNP as compared with controls. These findings further support the monocyte-T lymphocyte theory and the involvement of M1 macrophages in schizophrenia [1,5,55] and additionally indicate that the same M1 pathways are activated in the most severe phenotype of schizophrenia, namely MNP.
Our findings that the chemokines CCL-2 and CCL-11 are increased in MNP extend those of previous reports showing increased levels in schizophrenia [23,25,47,56-58] and MNP [22]. Moreover, our data that CCL-11 contributes to the prediction of MNP when coupled with TNF-α, IL-1β and sIL-1RA is in agreement with previous findings that schizophrenia is accompanied by a
22
The second major finding of this study is that the composite scores reflecting the ratios between IL-1β / sIL1RA and TNF-α / sTNFR2 were not significantly different between MNP and controls, suggesting that pro-inflammatory IL-1β and TNF-α signaling are attenuated by sIL-1RA and sTNFR2, respectively. Increased levels of sIL-RA competitively block the binding of IL-1β to its cell receptor and consequently inhibit IL-1β signaling [40]. As such, sIL-1RA is an endogenous agent that inhibits pro-inflammatory IL-1 signaling and immune-inflammatory responses thereby promoting tissue repair (59,60,61). Once released in the plasma, both sTNFR1 and sTNFR2 bind circulating levels of TNF-α thereby acting as decoy receptors, which attenuate TNF-α signaling [16, 17]. Moreover, increased TNFR2s have neuroprotective and neuroregenerative properties [18-20]. Previously, it was shown that schizophrenia patients exhibit activation of the CIRS as indicated by increased levels sIL-2R, sIL-1RA, sTNFR1 and sTNFR2 [5,11,62,63]. The results of the current study show that not only schizophrenia [5, 11], but also MNP is accompanied by a simultaneous activation of the IRS and the CIRS whereby CIRS products released during an immune-inflammatory response attenuate the IRS. Moreover, previous research showed that MNP is characterized by specific deficits in the CIRS, as for example lowered levels of natural IgM responses to OSEs including malondialdehyde and azelaic acid [6,7,28].
Importantly, we detected that the neurotoxic potential of the immune markers herein measured is significantly increased in MNP as indicated by increased values of the ratio of neurotoxic IRS (sum of IL-1β, TNF-α, CCL-2 and CCL-11) versus neuroprotective CIRS compounds (sIL-1RA and sTNFR2). In addition, SIMCA showed that two neurotoxic chemokines (CCL-11 and CCL-2) and one more neuroprotrective compound (sTNFR2), which also reflects an
23
whereby IRS/CIRS products including IL-1β, IL-6, TNF-α (M1 macrophage), IL-2 and IFN-γ (Th-1), IL-4, IL-13 and CCL-11 (Th-2) and CCL-2 may contribute to the immunopathogenesis of schizophrenia [22,23]. For example, IL-1β and TNF-α are typically elevated in neurodegenerative disease states and are known to induce neuronal death and apoptosis and neurotoxicity through increased glutamate release [64]. Increased IL-1β may induce Nitric Oxide Synthase (NOS) through activation of IL-1β receptors on brain vascular cells with subsequent production of diffusible NO [65] and thus increased nitrosylation of proteins [6]. Moreover, elevated levels of IL-1β, CCL-11 and other neurotoxic products such as TRYCATs in the periphery may cause blood-brain barrier disruption and change the active transport of cytokines across the blood-brain barrier [6,66]. CCL-11 has neurotoxic effects at pathological levels and induces a sharp decrease in neurogenesis in the hippocampus [22,23,67]. Other neurotoxic pathways were detected that may contribute to the pathophysiology of MNP, e.g. increased load of Gram-negative bacteria in the serum [29] and increased nitrosylation of proteins [6]. Moreover, increased activity of neurotoxic pathways in MNP may be driven by lowered natural IgM directed to OSEs [6], an upregulated paracellular pathway with damage to tight and adherens junctions in the gut and the blood brain barrier and damage to the vascular pathway [29].
The third major finding is that neurocognitive deficits including semantic and episodic memory, attention, executive functions and formal thought disorders, which are part of a “memory latent vector” in schizophrenia [22, 23], are largely predicted by the combined effects of neuro-immune biomarkers, whereby CCL-11 is consistently the most important predictor. These data are in agreement with previous results that a large part of the variance in cognitive deficits in schizophrenia
24
suppress cell proliferation in the dentate gyrus thereby inhibiting hippocampus-mediated memory formation [68]. Increases in systemic TNF-α may cause acute cognitive dysfunctions [69], while increased levels of peripheral blood CCL-11 may rapidly pass the BBB and induce attenuated hippocampal neurogegensis thereby inducing memory deficits [67,70]. People with serious cognitive impairments have often elevated CCL-11 levels [71]. Previous work showed significant inverse associations between plasma sTNFR2 levels and cognitive performance on verbal memory learning and recall tests in controls and schizophrenia patients [72]. Hippocampal volume was inversely associated with plasma sTNFR2 levels in patients with schizophrenia [44]. In rat models, peripherally induced microglial activation (e.g. through intraperitonial administration of LPS) may cause neuro-inflammation with increased levels of nuclear factor-κB and IL-1β, TNF-α and iNOS, which are accompanied by hippocampal neuronal loss and cognitive dysfunctions [73]. In this respect it should be underscored that MNP is accompanied by a breakdown of the paracellular and adherens junctions in the gut and increased translocation of Gram-negative bacteria or LPS and that these phenomena strongly predict cognitive impairments in schizophrenia [29]. The association between decreased verbal fluency and immune activation suggests that targeted treatments of schizophrenia individuals with anti-inflammatory agents may be beneficial to improve cognitive deficits [74].
The fourth major finding of this study is that the neurotoxic ISR and CIRS cytokines measured herein strongly predict deficit schizophrenia as well as the negative and PHEM symptoms of schizophrenia and psychomotor retardation. We have reviewed previously that the executive functioning network mediates and controls memory functions and learning processes [8,22,23]. As
25
and negative symptoms [8,22,23,29]. In accordance with Maes et al. [8] we observed that psychomotor retardation and affiliated negative symptoms are strongly impacted by neuro-immune pathways and that these effects are in part mediated by executive functions. As such, activated neuro-immune pathways in deficit schizophrenia may induce deficits in executive functions, and consequently in attention, and semantic and episodic memory, which all together may modulate schizophrenia symptomatology [8].
Acknowledgment
We acknowledge the staff of Ibn-Rushd hospital for their help in the collection of samples
especially Dr.Mokhlad Swadi Abed. We also acknowledge the work of the high-skilled staff of Asia
Clinical Laboratory in Najaf city for their help in the ELISA measurements and the estimation of
biomarkers levels.
Conflict of interest
The authors declare that there is no conflict of interest.
Funding
There was no specific funding for this specific study.
Conflict of interest
The authors have no conflict of interest with any commercial or other association in connection with
the submitted article.
26
All the contributing authors have participated in preparation of the manuscript.
References
1. Smith RS, Maes M. (1995) The macrophage-T-lymphocyte theory of schizophrenia:
additional evidence. Med Hypotheses 45(2):135-41.
2. Anderson G, Maes M. (2013) Schizophrenia: linking prenatal infection to cytokines, the
tryptophan catabolite (TRYCAT) pathway, NMDA receptor hypofunction, neurodevelopment
and neuroprogression. Prog Neuropsychopharmacol Biol Psychiatry 42:5-19.
3. Davis J, Moylan S, Harvey BH, Maes M, Berk M. (2014) Neuroprogression in schizophrenia:
Pathways underpinning clinical staging and therapeutic corollaries. Aust NZ J Psychiatry
48:512-529.
4. Davis J, Eyre H, Jacka FN, Dodd S, Dean O, McEwen S, Debnath M, McGrath J, et al.
(2016) A review of vulnerability and risks for schizophrenia: Beyond the two hit hypothesis.
Neurosci Biobehav Rev 65:185-194.
5. Roomruangwong C, Noto C, Kanchanatawan B, Anderson G, Kubera M, Carvalho AF, Maes
M. (2018) The Role of Aberrations in the Immune-inflammatory Reflex System (IRS) and
the Compensatory Immune-regulatory Reflex System (CIRS) in Different Phenotypes of
Schizophrenia: The IRS-CIRS Theory of Schizophrenia. Preprints 2018, 2018090289, doi:
10.20944/preprints201809.0289.v1.
6. Maes M, Kanchanatawan B, Sirivichayakul S, Carvalho AF (2018) In Schizophrenia, Deficits
in Natural IgM Isotype Antibodies Including those Directed to Malondialdehyde and Azelaic Acid Strongly Predict Negative Symptoms, Neurocognitive Impairments, and the Deficit
27
7. Maes M, Kanchanatawan B, Sirivichayakul S, Carvalho AF. (2019) In Schizophrenia,
Increased Plasma IgM/IgA Responses to Gut Commensal Bacteria Are Associated with
Negative Symptoms, Neurocognitive Impairments, and the Deficit Phenotype. Neurotox Res
35(3):684-698.
8. Maes, M, Sirivichayakul, S, Kanchanatawan, B, Carvalho AF. (2019) In schizophrenia,
psychomotor retardation is associated with executive and memory impairments, negative and psychotic symptoms, neurotoxic immune products and lower natural IgM to
malondialdehyde. Preprints, 2019-010108 doi: 10.20944/preprints201901.0108.v1.
9. Maes M, Meltzer HY, Bosmans E (1994) Immune-inflammatory markers in schizophrenia:
comparison to normal controls and effects of clozapine. Acta Psychiatr Scand 89(5):346-351.
10.Maes M, Delange J, Ranjan R, Meltzer HY, Desnyder R, Cooremans W, Scharpé S. (1997)
Acute phase proteins in schizophrenia, mania and major depression: modulation by
psychotropic drugs. Psychiatry Res 66(1):1-11.
11.Noto MN, Maes M, Nunes SOV, Ota VK, Rossaneis AC, Verri WA, Cordeiro Q, Belangero
SI, Gadelha A, Bressan RA, Noto C. (2019) Activation of the immune-inflammatory
response system and the compensatory immune-regulatory system in antipsychotic naive first
episode psychosis. Eur Neuropsychopharmacol 29(3):416-431.
12.Al-Hakeim HK, Al-Rammahi DA, Al-Dujaili AH. (2015) IL-6, IL-18, sIL-2R, and TNFα
proinflammatory markers in depression and schizophrenia patients who are free of overt
inflammation. J Affect Disord 182:106-14.
13.Hope S, Ueland T, Steen NE, Dieset I, Lorentzen S, Berg AO, Agartz I, Aukrust P et al.
28
associated with general severity and psychotic symptoms in schizophrenia and bipolar
disorder. Schizophr Res 145(1-3):36-42.
14.Maes M, Anderson G, Kubera M, Berk M. (2014) Targeting classical IL-6 signalling or IL-6
trans-signalling in depression? Expert Opin Ther Targets 18:495-512.
15.Bouma MG, Buurman WA. (1999) Assay of soluble tumor necrosis factor receptors. In:
Methods in Molecular Medicine, Vol. 36: Septic Shock Edited by: Evans TJ. Humana Press
Inc., Totowa, NJ pp. 91-100.
16.Selinsky CL, Boroughs KL, Halsey WA, Howell MD. (1998) Multifaceted inhibition of anti
-tumour immune mechanisms by soluble -tumour necrosis factor receptor type I. Immunology
94(1):88-93.
17.Su X, Zhou T, Yang P, Edwards CK, Mountz JD. (1998) Reduction of arthritis and
pneumonitis in motheaten mice by soluble tumor necrosis factor receptor. Arthritis Rheum
41(1):139-149.
18.Dasgupta S, Jana M, Liu X, Pahan K. (2002) Myelin basic protein-primed T cells induced
nitric oxide synthase in microglial cells. Implications for multiple sclerosis. J Biol Chem
277:39327-33.
19.Franklin RJ, Efrench-Constant C. (2008) Remyelination in the CNS: from biology to
therapy. Nat Rev Neurosci 9:839-855.
20.Kanchanatawan B, Sriswasdi S, Thika S, Stoyanov D, Sirivichayakul S, Carvalho AF,
Geffard M, Maes M. (2018) Towards a new classification of stable phase schizophrenia into
major and simple neuro-cognitive psychosis: Results of unsupervised machine learning
29
21.Maes M, Carvalho AF. (2018) The compensatory immune-regulatory reflex system (CIRS) in
depression and bipolar disorder. Mol Neurobiol 55(12):8885-8903.
22.Sirivichayakul S, Kanchanatawan B, Thika S, Carvalho AF, Maes M. (2019) A new
schizophrenia model: immune activation is associated with induction of different neurotoxic
products which together determine memory impairments and schizophrenia symptom
dimensions. CNS Neurol Disord Drug Targets 18(2):124-140.
23.Sirivichayakul S, Kanchanatawan B, Thika S, Carvalho AF, Maes M. (2019) Eotaxin, an
Endogenous Cognitive Deteriorating Chemokine (ECDC), Is a Major Contributor to
Cognitive Decline in Normal People and to Executive, Memory, and Sustained Attention
Deficits, Formal Thought Disorders, and Psychopathology in Schizophrenia Patients.
Neurotox Res 35(1):122-138.
24.Kanchanatawan B, Thika S, Sirivichayakul S, Carvalho AF, Geffard M, Maes M. (2018) In
schizophrenia, depression, anxiety, and physiosomatic symptoms are strongly related to psychotic symptoms and excitation, impairments in episodic memory, and increased
production of neurotoxic tryptophan catabolites: a multivariate and machine learning study.
Neurotox Res 33:1. doi: https://doi.org/10.1007/ s12640‐018‐9868‐4.
25.Frydecka D, Krzystek-Korpacka M, Lubeiro A, Stramecki F, Stańczykiewicz B, Beszłej JA,
Piotrowski P, Kotowicz K, et al. (2018) Profiling inflammatory signatures of schizophrenia:
A cross-sectional and meta-analysis study. Brain Behav Immun71:28-36.
26.Bettcher BM, Fitch R, Wynn MJ, Lalli MA, Elofson J, Jastrzab L, Mitic L, Miller ZA, et al.
30
Alzheimer’s disease dementia phenotypes. Alzheimer’s Dement Diagnosis, Assess Dis Monit
3:91-97.
27.Kanchanatawan B, Sriswasdi S, Thika S, Sirivichayakul S, Carvalho AF, Geffard M, Kubera
M, Maes M. (2018) Deficit schizophrenia is a discrete diagnostic category defined by
neuroimmune and neurocognitive features: results of supervised machine learning. Metab
Brain Dis 33(4):1053-1067.
28.Maes, M, Brum MJ, Congio A, Bonifacio K, Barbosa D, Vargas H, Michelin A, Carvalho et
al. (2018). Development of a novel staging model for affective disorders using partial least
squares bootstrapping: effects of lipid-associated antioxidant defenses and neuro-oxidative
stress. 10.20944/preprints201812.0092.v1.
29.Maes M, Sirivichayakul S, Kanchanatawan B, Vodjani A. (2019) Breakdown of the
paracellular tight and adherens junctions in the gut and blood brain barrier and damage to the
vascular barrier in patients with deficit schizophrenia. Neurotox Res doi: 10.1007/s12640
-019-00054-6.
30.Kirkpatrick B, Buchanan RW, McKenney PD, Alphs LD, Carpenter WT. (1989) The
schedule for the deficit syndrome: an instrument for research in schizophrenia. Psychiatry
Res 30:119-123.
31.Andreasen NC. (1989) The scale for the assessment of negative symptoms (SANS):
conceptual and theoretical foundations. Brit J Psychiatry Suppl7:49-58.
32.Kay SR, Fiszbein A, Opler LA (1987) The positive and negative syndrome scale (PANSS)
for schizophrenia. Schizophr Bull13:261-276.
31
34.Hamilton M (1960) A rating scale for depression. J Neurol Neurosurg Psychiatry23:56-62.
35.Keefe RSE, Goldberg TE, Harvey PD, Gold JM, Poe MP, Coughenour L. (2004) The brief
assessment of cognition in schizophrenia: reliability, sensitivity, and comparison with a
standard neurocognitive battery. Schizophr Res 68:283-297.
36.Benjamini Y, Hochberg Y. (1995) Controlling the false discovery rate: a practical and
powerful approach to multiple testing. J Royal Statistics Soc Series b (Methodological)
57:289-300.
37.CAMO, 2019. The Unscrambler Appendices: Method References. 2019. As assessed 19-3
-2019. www.camo.com/helpdocs/The_Unscrambler_Method_References.pdf.
38.Ringle CM, Wende S, Becker J-M (2015) SmartPLS 3. Bönningstedt: SmartPLS. Retrieved
from http://www.smartpls.com.
39.Cepeda-Carrion GA, Nitzl C, Roldan JL (2018) Mediation analyses in partial least squares
structural equation modeling: guidelines and empirical examples. Chapter 9. Partial least
squares structural equation modeling: basic concepts, methodological issues and applications.
In: Latan H, Noonan R (eds). Springer, Heidelberg, pp 173-195.
40.Maes M, Song C, Yirmiya R. (2012) Targeting IL-1 in depression. Expert Opin Ther Targets
16(11):1097-112.
41.Piccioli P, Rubartelli A. (2013) The secretion of IL-1β and options for release. Semin
Immunol 5(6):425-9.
42.Potvin S, Stip E, Sepehry AA, Gendron A, Bah R, Kouassi E. (2008) Inflammatory cytokine
32
43.Morch RH, Dieset I, Faerden A, Hope S, Aas M, Nerhus M, Gardsjord ES, Haram M, et al.
(2017) Persistent increase in TNF and IL-1 markers in severe mental disorders suggests trait
-related inflammation: a one year follow-up study. Acta Psychiatr Scand 136(4):400-408.
44.Kudo N, Yamamori H, Ishima T, Nemoto K, Yasuda Y, Fujimoto M, Azechi H, Niitsu T, et
al. (2018) Plasma levels of soluble tumor necrosis factor receptor 2 (sTNFR2) are associated
with hippocampal volume and cognitive performance in patients with schizophrenia. Int J
Neuropsychopharmacol 21(7):631-639.
45.Hope S, Melle I, Aukrust P, Steen NE, Birkenaes AB, Lorentzen S, Agartz I, Ueland T,
Andreassen OA. (2009) Similar immune profile in bipolar disorder and schizophrenia:
selective increase in soluble tumor necrosis factor receptor I and von Willebrand factor.
Bipolar Disord 11(7):726-34.
46.Hope S, Hoseth E, Dieset I, Morch RH, Aas M, Aukrus P, Djurovic S, Melle I, et al. (2015)
Inflammatory markers are associated with general cognitive abilities in schizophrenia and
bipolar disorder patients and healthy controls. Schizophr Res 165 (2-3):188-194.
47.Noto C, Maes M, Ota VK, Teixeira AL, Bressan RA, Gadelha A, Brietzke E, et al. (2015)
High predictive value of immune-inflammatory biomarkers for schizophrenia diagnosis and
association with treatment resistance. World J Biol Psychiatry 16:422-429.
48.Boerrigter D, Weickert TW, Lenroot R, O'Donnell M, Galletly C, Liu D, Burgess M, Cadiz
R, et al. (2017) Using blood cytokine measures to define high inflammatory biotype of
33
49.Lee EE, Hong S, Martin AS, Eyler LT, Jeste DV. (2017) Inflammation in Schizophrenia:
Cytokine Levels and Their Relationships to Demographic and Clinical Variables. Am J
Geriatr Psychiatry 25:50-61.
50.Idriss HT, Naismith JH (2000) TNF alpha and the TNF receptor superfamily: structure
-function relationship(s). Microsc Res Tech 50(3):184-195.
51.Kanchanatawan B, Sirivichayakul S, Ruxrungtham K, Carvalho AF, Geffard M, Anderson
G, Maes M. (2018) Deficit Schizophrenia Is Characterized by Defects in IgM-Mediated
Responses to Tryptophan Catabolites (TRYCATs): a Paradigm Shift Towards Defects in
Natural Self-Regulatory Immune Responses Coupled with Mucosa-Derived TRYCAT
Pathway Activation. Mol Neurobiol 55(3):2214-2226.
52.Kanchanatawan B, Hemrungrojn S, Thika S, Sirivichayakul S, Ruxrungtham K, Carvalho
AF, Geffard M, Anderson G, Maes M. (2018) Changes in Tryptophan Catabolite (TRYCAT)
Pathway Patterning Are Associated with Mild Impairments in Declarative Memory in
Schizophrenia and Deficits in Semantic and Episodic Memory Coupled with Increased False
-Memory Creation in Deficit Schizophrenia. Mol Neurobiol 55(6):5184-5201.
53.Goldsmith DR, Rapaport MH, Miller BJ. (2016) A meta-analysis of blood cytokine network
alterations in psychiatric patients: comparisons between schizophrenia, bipolar disorder and
depression. Mol Psychiatry 21(12):1696-1709.
54.Miller BJ, Buckley P, Seabolt W, Mellor A, Kirkpatrick B. (2011) Meta-analysis of cytokine
alterations in schizophrenia: clinical status and antipsychotic effects. Biol Psychiatry 70:663
34
55.Uranova NA, Bonartsev PD, Androsova LV, Rakhmanova VI, Kaleda VG. (2017) Impaired
monocyte activation in schizophrenia: ultrastructural abnormalities and increased IL-1β
production. Eur Arch Psychiatry Clin Neurosci 267(5):417-426.
56.Boll KM, Noto C, Bonifácio KL, Bortolasci CC, Gadelha A, Bressan RA, Barbosa DS, Maes
M, Moreira EG. (2017) Oxidative and nitrosative stress biomarkers in chronic schizophrenia.
Psychiatry Res 253:43-48.
57.Hong S, Lee EE, Martin AS, Soontornniyomkij B, Soontornniyomkij V, Achim CL, Reuter
C, Irwin MR, et al. (2017) Abnormalities in chemokine levels in schizophrenia and their
clinical correlates. Schizophr Res 181:63-69.
58.Teixeira AL, Reis HJ, Nicolato R, Brito-Melo G, Correa H, Teixeira MM, Romano-Silva
MA (2008) Increased serum levels of CCL11/eotaxin in schizophrenia. Prog
Neuropsychopharmacol Biol Psychiatry 32(3):710-714.
59.Relton JK, Rothwell NJ. (1992) Interleukin-1 receptor antagonist inhibits ischemic and
excitatory neuronal damage in the rat. Brain Res Bull 29:243-246.
60.Gutierrez EG, Banks WA, Kastin AJ, (1994) Blood-born interleukin-1 receptor antagonist
crosses the blood-brain barrier. J Neuroimmunol 55:135-160.
61.Arend WP, Guthridge CJ (2000) Biological role of interleukin 1 receptor antagonist isoforms.
Ann Rheum Dis 59 (Suppl 1):i60-4.
62.Maes M, Bosmans E, Ranjan R, Vandoolaeghe E, Meltzer HY, De Ley M, Berghmans R,
Stans G, Desnyder R. (1996) Lower plasma CC16, a natural anti-inflammatory protein, and
increased plasma interleukin-1 receptor antagonist in schizophrenia: effects of antipsychotic
35
63.Maes M, Bocchio Chiavetto L, Bignotti S, Battisa Tura GJ, Pioli R, Boin F, Kenis G,
Bosmans E, de Jongh R, Altamura CA. (2002) Increased serum interleukin-8 and interleukin
-10 in schizophrenic patients resistant to treatment with neuroleptics and the stimulatory
effects of clozapine on serum leukemia inhibitory factor receptor. Schizophr Res 54(3):281
-91.
64.Ye L, Huang Y, Zhao L, Li Y, Sun L, Zhou Y, Qian G, Zheng JC. (2013) IL-1β and TNF-α
induce neurotoxicity through glutamate production: a potential role for neuronal glutaminase.
J Neurochem 125(6):897-908.
65.Gądek-Michalska A, Tadeusz J, Rachwalska P, Spyrka J, Bugajski J. (2012) Brain nitric
oxide synthases in the interleukin-1β-induced activation of hypothalamic-pituitary-adrenal
axis. Pharmacol Rep 64(6):1455-65.
66.Siegel A, Zalcman SS. (2009) The neuroimmunological basis of behavior and mental
disorders. euroimmunol Basis Behav Ment Disord:1-438. doi:10.1007/978-0-387-84851-8.
67.Erickson MA, Morofuji Y, Owen JB, Banks WA. (2014) Rapid transport of CCL11 across
the blood-brain barrier: regional variation and importance of blood cells. J Pharmacol Exp
Ther 349(3):497-507.
68.Morris G, Berk M, Galecki P, Walder K, Maes M. (2016) The neuro-immune
pathophysiology of central and peripheral fatigue in systemic immune-inflammatory and
neuro-immune diseases. Mol Neurobiol 53:1195-219.
69.Hennessy E, Gormley S, Lopez-Rodriguez AB, Murray C, Murray C, Cunningham C. (2017)
Systemic TNF-α produces acute cognitive dysfunction and exaggerated sickness behavior
36
70.Villeda SA, Luo J, Mosher KI, Zou B, Britschgi M, Bieri G, Stan TM, Fainberg N, et al.
(2011) The ageing systemic milieu negatively regulates neurogenesis and cognitive function.
Nature 477(7362):90-94.
71.Butcher L, Peres K, Andre P, Walter S, Dartigues J, Rodriguez-Manas L, Feart C,
Erusalimsky JD. (2017) Cognitive status is associated with CCL11 in older rural dwellers:
findings from the FRAILOMIC study. Innovation in Aging 1(suppl-1):595.
72.Hoseth EZ, Westlye LT, Hope S, Dieset I, Aukrust P, Melle I, Haukvik UK, Agartz I, et al.
(2016) Association between cytokine levels, verbal memory and hippocampus volume in
psychotic disorders and healthy controls. Acta Psychiatr Scand 133(1):53-62.
73.Zhao J, Bi W, Xiao S, Lan X, Cheng X, Zhang J, Lu D, Wei W, et al. (2019)
Neuroinflammation induced by lipopolysaccharide causes cognitive impairment in mice. Sci
Rep 9(1):5790.
74.Levkovitz Y, Mendlovich S, Riwkes S, Braw Y, Levkovitch-Verbin H, Gal G, Fennig
S, Treves I, Kron S. (2010) A double-blind, randomized study of minocycline for the
treatment of negative and cognitive symptoms in early-phase schizophrenia. J Clin Psychiatry
71:138-49.
75.Kanchanatawan B, Sriswasdi S, Maes M. (2019) Supervised machine learning to decipher the
complex associations between neuro-immune biomarkers and quality of life in schizophrenia.
37
Figure 1. Mean values (standard error) of the z scores of all biomarkers in patients with deficit schizophrenia or major neuro-cognitive psychosis (SCZ) versus healthy controls (HC).
IL: interleukin; sIL-1RA: soluble IL-1 receptor antagonist; TNF: tumor necrosis factor; MCP-1: CCL-2; CCL-11: eotaxin
All IL1: computed as zLn IL1 + z sqr sIL1RA (sqr: square root) All TNF: computed as z Ln TNF + z Ln sTNFR1 + z Ln sTNFR2 TNF - sTNFR2: computed as z Ln TNF - z Ln sTNFR2
All M1: computed as z Ln IL1 + z sqr IL1RA + z Ln TNF + z Ln TNFR1 + z Ln TNFR2 + z Ln MCP
CCL11+CCL2: computed as z sqr CCL11 + z Ln MCP
38
39
40
41
42
43
Figure 7. Discrimination power plot obtained by Soft Independent Modeling of Class Analogy (SIMCA). Of the 7 biomarkers discriminating major neuro-cognitive psychosis from controls, CCL-11 has the greatest discrimination power, followed by sTNFR2 and MCP-1.
44
Figure 8. Results of a multistep Partial Least Squares (PLS) analysis with multiple mediators. Here we examine the causal links between the biomarkers, TOL (Tower of London), a cognitive latent vector (LV), extracted from cognitive functions (COWA, FTD, VFT, WLM, WM), psychomotor retardation (entered as one indicator variable), a PHEM LV extracted from 4 symptom scores (namely psychosis, hostility, excitation and mannerism), and a LV extracted from negative symptoms (PANSSnega, SDS, SANS).
45
Figure 9. Results of Partial Least Squares (PLS) analysis. This PLS shows that a large part in the latent vector exctracted from negative (SDS, PANSSnega, SANS), PHEM (psychosis, hostility, excitation and mannerism) symptoms, memory dysfunctions (FTD, COWA, VFT, WLM, WM), executive functions (TOL), and psychomotor retardation (PMR) is explained by biomarkers and education.
46
47
Table 1. Indices of the different symptom domains and biomarker composite scores used in the current study
Symptom domains Z unit weighted composite symptom scores
Psychosis sum of z score of item 1 on the positive subscale of the PANSS (zPANNSP1, delusion) plus zPANSSP3
(hallucinations) + zPANNSP6 (suspiciousness) plus z score of item 11 of the BPRS (zBPRS11: suspiciousness)
pluszBPRS12 (hallucinatory behavior) pluszBPRS15 (unusual thought content).
Hostility sum of zPANSSP7 (hostility) plus z-score of item 14 on the general psychopathology scale of the PANSS
(zPANSSG14: poor impulse control) pluszBPRS10 (hostility) plus zBPRS14 (uncooperativeness).
Excitement zPANNSP4 (excitement) pluszPANNSP5 (grandiosity) pluszBPRS8 (grandiosity) pluszBPRS17 (excitement).
Mannerism zPANNSG5 pluszBPRS7 (both mannerism and posturing)
Formal thought disorders zPANNSP2 (conceptual disorganization) plus item 5 of the PANNS negative subscale (PANNSN5: difficulty in abstract thinking) plus zBPRS4 (item 4 of the BPRS or conceptual disorganization)
Psychomotor retardation z-score of HDRS item 8 (HDRS8: psychomotor retardation: slowness of thought and speech, decreased motor activity, impaired inability to concentrate) plus zPANSSG7 (reduction in motor activity as reflected in slowing or lessening of movements and speech, diminished responsiveness to stimuli and reduced body tone) plus zBPRS13
(reduction in energy level evidenced in slowed movements).
Immune scores Z unit weighted composite immune scores
ALLIL-1 zLn interleukin-1 (zIL1) + z Ln soluble IL1 receptor antagonist (zIL1RA)
IL1 / IL1RA zIL1 – zIL1RA
ALL TNF z Ln tumor necrosis factor-α (zTNF) + z Ln sTNFR1 (zTNFR1) + zTNFR2 TNF / TNFR2 z TNF – zTNFR2
MCP+CCL11 Z Ln monocyte chemoattractant protein 1 (zMCP) + z Ln CCL11 (zCCL11) ALL M1 zIL1 + zIL1RA + zTNF + zTNFR1 + zTNFR2 + zMCP
NeuroToxic / Protective zIL1 + zTNF + zMCP + zCCL11 – zIL1RA – zTNFR2
48
Table 2. Demographic and clinical data in normal controls and deficit schizophrenia patients
Variables Controls Deficit
schizophrenia
F/Ψ/X2 df
Age (years) 37.9 (10.3) 41.0 (9.6) 3.56 1/172 0.061
Sex (F/M) 18/36 48/72 0.70 1 0.402
Single/Married 23/31 53/65 0.08 1 0.776
Rural/Urban 2/52 16/104 3.73 1 0.054
BMI (kg/m2) 26.9 (3.8) 26.7 (4.8) 0.07 1/172 0.789
Education (years) 2.85 (0.45) 1.38 (0.9) 133.12 1/172 <0.001
Employment (N/Y) 4/50 98/22 84.66 1 <0.001
Nicotine dependence (N/Y) 37/17 78/42 0.21 1 0.650
SDS 0.0 39.8 (4.5) MWU - <0.001
SANS 1.0 (0.6) 91.1 (16.6) MWU - 0.001
PANSS+ 7.0 (0.0) 15.3 (6.9) MWU - 0.001
PANSS- 7.0 (0.0) 27.8 (7.4) MWU - 0.001
BPRS 18.0 0.0 63.7 14.0 MWU - <0.001
49
Hostility (z score) -1.027 (0.123) 0.462 (0.868) MWU - <0.001
Excitation (z score) -1.164 (0.096) 0.524 (0.747) MWU - <0.001
Mannerism (z score) -1.003 (0.036) 0.451 (0.890) MWU - <0.001
FTD -1.200 (0.076) 0.540 (0.710) MWU - <0.001
PMR -0.992 (0.127) 0.447 (0.893) MWU - <0.001
MMSE 29.0 (1.2) 15.4 (5.0) 389.11 1/172 <0.001
List Learning 59.4 (7.5) 25.7 (9.9) 494.81 1/172 <0.001
Digit Sequencing Task 17.0 (4.2) 4.3 (2.9) 525.7 1/172 <0.001
Category Instances 70.3 (6.2) 35.6 (17.7) 231.54 1/172 <0.001
Controlled Word Association 33.3 (3.3) 6.2 (4.1) 1850.31 1/172 <0.001
Symbol Coding 79.4 (7.8) 18.2 (14.8) 817.56 1/172 <0.001
Tower of London 19.6 (1.8) 6.3 (4.5) 431.32 1/172 <0.001
All results are shown as mean (SD)
A,B,C: pairwise comparisons among the three subgroups (tested at p<0.05)
MWU: Results of Mann-Whitney U test
50
SDS: Schedule for the deficit syndrome; SANS: Scale for the Assessment of Negative Symptoms; PANSS+/-: positive and negative subscales of the Positive and Negative Syndrome Scale; BPRS: Brief Psychiatric Rating Scale.