Li, G., Zhang, S., Fioranelli, F. and Griffiths, H. (2018) Effect of
sparsity-aware time–frequency analysis on dynamic hand gesture classification with
radar micro-Doppler signatures. IET Radar, Sonar and Navigation, 12(8),
pp. 815-820. (doi:10.1049/iet-rsn.2017.0570)
This is the author’s final accepted version.
There may be differences between this version and the published version.
You are advised to consult the publisher’s version if you wish to cite from
it.
http://eprints.gla.ac.uk/160032/
Deposited on: 03 April 2018
Enlighten – Research publications by members of the University of Glasgow
http://eprints.gla.ac.uk
1
Effect of Sparse-Aware Time-Frequency Analysis on Dynamic Hand Gesture
Classification with Radar Micro-Doppler Signatures
Gang Li
1, 2*, Shimeng Zhang
1, Francesco Fioranelli
3, and Hugh Griffiths
41 Department of Electronic Engineering, Tsinghua University,Beijing, China 2 The Research Institute of Tsinghua University in Shenzhen, Shenzhen, China 3 School of Engineering, University of Glasgow, UK
4 Department of Electronic and Electrical Engineering, University College London, London, UK * [email protected]
Abstract:Dynamic hand gesture recognition is of great importance in human-computer interaction. In this paper, we investigate the effect of sparsity-driven time-frequency analysis on hand gesture classification. The time-frequency spectrogram is first obtained by sparsity-driven time-frequency analysis. Then three empirical micro-Doppler features are extracted from the time-frequency spectrogram and a support vector machine is used to classify six kinds of dynamic hand gestures. The experimental results on measured data demonstrate that, compared to traditional time-frequency analysis techniques, sparsity-driven time-frequency analysis provides improved accuracy and robustness in dynamic hand gesture classification.
1. Introduction
Hand gesture has been regarded as an effective method of human-computer interaction (HCI). With the development of computer, there has been a significant amount of research in hand gesture recognition. The video based methods presented in [1]-[3] can recognize 2-D, 3-D, or real-time hand gestures. However, their performances are affected by environmental conditions such as light level, dust, rain, etc. Moreover, a high resolution camera is required to catch fast gestures, which may significantly increase the hardware cost.
Radar micro-Doppler effect is known as a phenomenon caused by the micro-motion of an object or its parts. There have been a number of literatures on human movement analysis by using micro-Doppler features [4], [5]. Along with the torso movement, different motions of arms, legs and other parts of the body result in different micro-Doppler components [4]-[9]. Therefore, micro-micro-Doppler signatures can be used to classify the human activities, such as crawling, walking, and running, to distinguish human from animals, to recognize the unarmed/armed persons, and even to observe the human movements in through-wall environments [6]-[14]. Compared to video-based methods, radar micro-Doppler analysis is all-weather and unaffected by light conditions and, therefore, is worth investigating for robust HCI systems. There has been some literature on dynamic hand gesture recognition using radar sensors [15]-[18]. Ref. [15] recognizes ten kinds of hand gestures by analysing micro-Doppler signatures with a deep convolutional neural network (DCNN). In [16], the features are extracted from the Doppler-shift images, and then a K-Nearest Neighbour (KNN) classification approach is used to classify four kinds of gestures. In [17]-[18], the authors extract features from the range-Doppler domain.
Empirical features, directly extracted from the time-frequency spectrogram, have been widely used to classify human activities [6]-[9], [11]-[13]. Firstly, time-frequency spectrogram is obtained by performing the short-time Fourier
transform (STFT) or the Wigner-Ville distribution (WVD) on the received signal. Secondly, some empirical features corresponding to the different physical meanings are extracted from the time-frequency domain. Then the empirical features are inputted into classifiers to determine different human activities. The existing literatures show that the empirical features are simple but effective for classifying a number of kinds of human activities.
In recent years, sparse signal processing has been combined with time-frequency analysis. [19] shows that the sparse property is effective for revealing the instantaneous frequency of the signal. In [20], the orthogonal matching pursuit (OMP) algorithm is used to extract the micro-Doppler signatures induced by rotating scatterers in radar imaging applications. In [21], a pruned OMP (POMP) algorithm is proposed to achieve the joint estimation of the spatial distribution of the scatterers and the rotational speed of the target. The methods proposed in [20-21] require the analytic expressions of the time-frequency spectrum (TFS) of radar signals and cannot be used to classify dynamic hand gesture signals, which are difficult to be analytically formulated. Ref. [22] provides a comprehensive review of the application of sparse reconstruction techniques to quadratic TFS.
In this paper, we are interested in applications of radar sensing of gestures in short range, such as smart home and automobile auxiliary driving. We aim to investigate the effect of sparsity-driven time-frequency analysis on the empirical feature extraction of micro-Doppler signals reflected from dynamic hand gestures, which is not fully studied yet in existing literature. The time-frequency spectrograms of the radar micro-Doppler signals of the dynamic hand gestures are obtained by using the sparse reconstruction instead of the traditional WVD. Then three empirical features are extracted from the sparse time-frequency domain and inputted into the support vector machine (SVM) to classify six kinds of dynamic hand gestures. The experimental results on real radar data demonstrate that, with the same selection of empirical features and the same classifier, the sparsity-driven
time-2 frequency analysis outperforms the WVD in terms of the
accuracy of feature extraction and, therefore, produces better
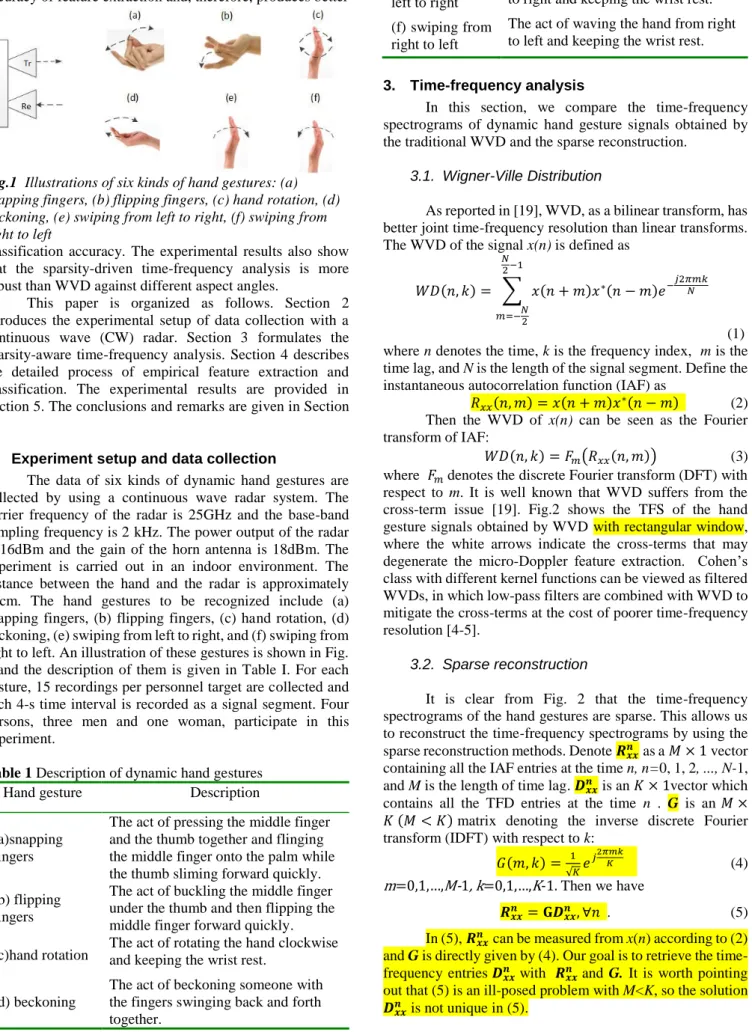
Fig.1 Illustrations of six kinds of hand gestures: (a)
snapping fingers, (b) flipping fingers, (c) hand rotation, (d) beckoning, (e) swiping from left to right, (f) swiping from right to left
classification accuracy. The experimental results also show that the sparsity-driven time-frequency analysis is more robust than WVD against different aspect angles.
This paper is organized as follows. Section 2 introduces the experimental setup of data collection with a continuous wave (CW) radar. Section 3 formulates the sparsity-aware time-frequency analysis. Section 4 describes the detailed process of empirical feature extraction and classification. The experimental results are provided in Section 5. The conclusions and remarks are given in Section 6.
2. Experiment setup and data collection
The data of six kinds of dynamic hand gestures are collected by using a continuous wave radar system. The carrier frequency of the radar is 25GHz and the base-band sampling frequency is 2 kHz. The power output of the radar is 16dBm and the gain of the horn antenna is 18dBm. The experiment is carried out in an indoor environment. The distance between the hand and the radar is approximately 30cm. The hand gestures to be recognized include (a) snapping fingers, (b) flipping fingers, (c) hand rotation, (d) beckoning, (e) swiping from left to right, and (f) swiping from right to left. An illustration of these gestures is shown in Fig. 1 and the description of them is given in Table I. For each gesture, 15 recordings per personnel target are collected and each 4-s time interval is recorded as a signal segment. Four persons, three men and one woman, participate in this experiment.
Table 1 Description of dynamic hand gestures
Hand gesture Description
(a)snapping fingers
The act of pressing the middle finger and the thumb together and flinging the middle finger onto the palm while the thumb sliming forward quickly. (b) flipping
fingers
The act of buckling the middle finger under the thumb and then flipping the middle finger forward quickly. (c)hand rotation The act of rotating the hand clockwise and keeping the wrist rest.
(d) beckoning
The act of beckoning someone with the fingers swinging back and forth together.
(e) swiping from left to right
The act of waving the hand from left to right and keeping the wrist rest. (f) swiping from
right to left
The act of waving the hand from right to left and keeping the wrist rest.
3. Time-frequency analysis
In this section, we compare the time-frequency spectrograms of dynamic hand gesture signals obtained by the traditional WVD and the sparse reconstruction.
3.1. Wigner-Ville Distribution
As reported in [19], WVD, as a bilinear transform, has better joint time-frequency resolution than linear transforms. The WVD of the signal x(n) is defined as
𝑊𝐷(𝑛, 𝑘) = ∑ 𝑥(𝑛 + 𝑚)𝑥∗(𝑛 − 𝑚)𝑒−𝑗2𝜋𝑚𝑘𝑁 𝑁 2 −1 𝑚=−𝑁2 (1) where n denotes the time, k is the frequency index, m is the time lag, and N is the length of the signal segment. Define the instantaneous autocorrelation function (IAF) as
𝑅𝑥𝑥(𝑛, 𝑚) = 𝑥(𝑛 + 𝑚)𝑥∗(𝑛 − 𝑚) (2)
Then the WVD of x(n) can be seen as the Fourier transform of IAF:
𝑊𝐷(𝑛, 𝑘) = 𝐹𝑚(𝑅𝑥𝑥(𝑛, 𝑚)) (3)
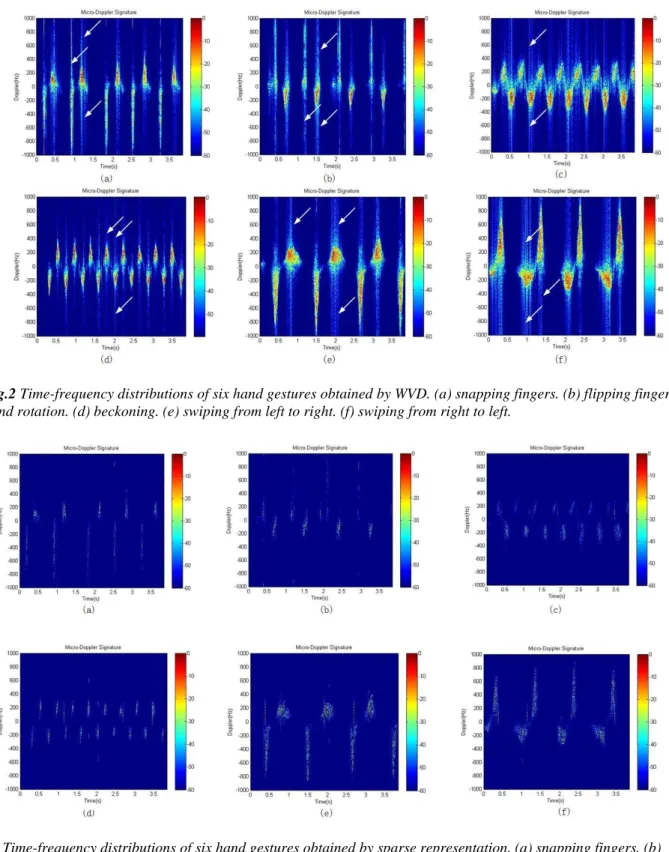
where 𝐹𝑚denotes the discrete Fourier transform (DFT) with respect to m. It is well known that WVD suffers from the cross-term issue [19]. Fig.2 shows the TFS of the hand gesture signals obtained by WVD with rectangular window, where the white arrows indicate the cross-terms that may degenerate the micro-Doppler feature extraction. Cohen’s class with different kernel functions can be viewed as filtered WVDs, in which low-pass filters are combined with WVD to mitigate the cross-terms at the cost of poorer time-frequency resolution [4-5].
3.2. Sparse reconstruction
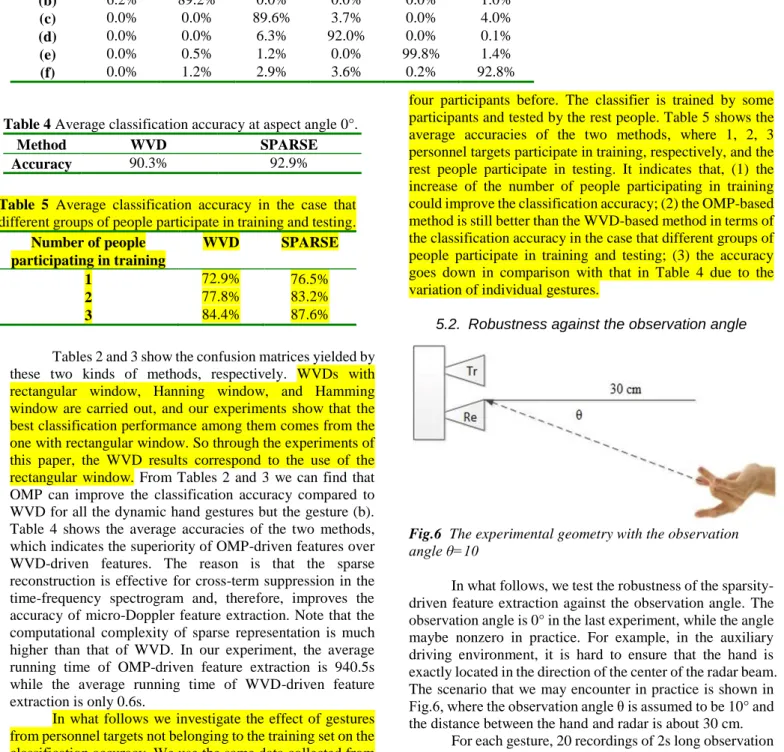
It is clear from Fig. 2 that the time-frequency spectrograms of the hand gestures are sparse. This allows us to reconstruct the time-frequency spectrograms by using the sparse reconstruction methods. Denote 𝑹𝒙𝒙𝒏 as a 𝑀 × 1 vector
containing all the IAF entries at the time n, n=0, 1, 2, ..., N-1, and M is the length of time lag. 𝑫𝒙𝒙𝒏 is an 𝐾 × 1vector which contains all the TFD entries at the time n . G is an 𝑀 ×
𝐾 (𝑀 < 𝐾)matrix denoting the inverse discrete Fourier transform (IDFT) with respect to k:
𝐺(𝑚, 𝑘) = 1 √𝐾𝑒 𝑗2𝜋𝑚𝑘𝐾 (4) m=0,1,…,M-1, k=0,1,…,K-1.Then we have 𝑹𝒙𝒙𝒏 = 𝐆𝑫𝒙𝒙𝒏, ∀𝑛 . (5)
In (5), 𝑹𝒙𝒙𝒏 can be measured from x(n) according to (2)
and G is directly given by (4). Our goal is to retrieve the time-frequency entries 𝑫𝒙𝒙𝒏 with 𝑹𝒙𝒙𝒏 and G. It is worth pointing out that (5) is an ill-posed problem with M<K, so the solution
3 Note that TFS of hand gesture signals are generally
sparse. According to the sparse signal recovery technique [22][23], the sparse solution of (5) can be obtained by
𝑫̂ = 𝑎𝑟𝑔 𝑚𝑖𝑛𝒙𝒙𝒏 𝐷𝑥𝑥𝑛 ‖𝑫𝒙𝒙
𝒏 ‖
0, 𝑠. 𝑡. ‖𝑹𝒙𝒙𝒏 − 𝑮𝑫𝒙𝒙𝒏 ‖22≤ 𝜀, ∀𝑛 (6)
where ‖. ‖0and ‖. ‖2 denote 𝐿0and 𝐿2norms, respectively, 𝜀 is the specified error threshold. In this paper, we set 𝐾 = 2𝑀 and 𝜀 = 0.03 and use the OMP algorithm [24] to solve (6). Fig. 3 shows the TFS of the hand gesture signals solved by OMP from (6). From Fig. 3, we can find that the primary
micro-Doppler components are retained meanwhile the cross-terms have been significantly suppressed.
4. Feature extraction and classification
4.1. Feature extraction
Three empirical features are extracted from the time-frequency spectrogram to classify the gestures: the negative-to-positive frequency ratio, the duty cycle, and the bandwidth. Fig.2 Time-frequency distributions of six hand gestures obtained by WVD. (a) snapping fingers. (b) flipping fingers. (c)
hand rotation. (d) beckoning. (e) swiping from left to right. (f) swiping from right to left.
Fig.3 Time-frequency distributions of six hand gestures obtained by sparse representation. (a) snapping fingers. (b)
4 From Figs. 2 and 3 we can see that the six gestures have
distinct time-frequency characteristics from each other. In Fig.4, taking the gesture of swiping from left to right as an example, we introduce the process of features extraction. According to the feature extraction method in [6], the received signal is normalized so that the maximum signal strength is 0dB. Then the noise threshold is
Fig.4 Features selected from the time-frequency spectrogram
Fig.5 The decision tree classifier. (a) snapping fingers. (b)
flipping fingers. (c) hand rotation. (d) beckoning. (e) swiping from left to right. (f) swiping from right to left
determined by the amplitude histogram analysis and threshold of -60dB is set to separate the signal from the background noise.
The following three features are used for hand gesture classification.
(1) The negative-to-positive frequency ratio Ra. This is the ratio of the negative and positive frequency peaks of each gesture:
𝑅𝑎=|𝑓|𝑓𝑛|
𝑝| (7) where 𝑓𝑝 and 𝑓𝑛 are the maximal positive frequency value
and the maximal negative frequency, respectively,
|. | denotes the absolute value.
(2)Duty cycle D. This is the percentage of one period in which the signal of the gesture is active:
𝐷 =∑𝐿𝑖=1𝑡𝑖
𝑇 × 100% (8)
where T is the period of the whole gesture as shown in Fig. 4.
L is the number of the effective motions in a period, 𝑡𝑖 is the
duration of the i-th effective motion. Here an effective motion is defined as a continuous motion which makes the corresponding strength of the normalized radar signal larger than -60dB in the time-frequency spectrogram. For example, in Fig. 4, t1 and t2 denote the durations of two effective motions of the gesture “swiping from left to right”.
(3)Bandwidth Bw. This is the entire range of frequencies occupied by the gesture:
𝐵𝑤= |𝑓𝑛| + |𝑓𝑝| (9)
As for the estimation of the parameters 𝑓𝑛 , 𝑓𝑝 , T and ti
used in (7)-(9), we take Fig. 4 as an example and describe the procedure as follows: 𝑓𝑛 and 𝑓𝑝 are directly obtained from the values of positive and negative frequency peaks, respectively;
T is estimated by the measurement of the time gap between two adjacent frequency peaks; ti is estimated by calculate the time interval in which the absolute value of the Doppler frequency exceeds a threshold of 50 Hz.
4.2. Classification
The features extracted in the previous step are input into SVM for gesture classification. In order to solve the multiclass problem, we apply five SVMs with linear kernels, to form a decision tree classifier as shown in Fig.5. Basically this classifier works in the following way. SVM1 makes a distinction between snapping fingers/flipping fingers and other four hand gestures by the feature D. SVM2 distinguishes snapping fingers and flipping fingers mainly by the feature Ra. SVM3 distinguishes hand rotation/beckoning and swiping from left to right/swiping from right to left mainly by the feature Bw. SVM4 distinguishes hand rotation and beckoning mainly by the feature D. SVM5 distinguishes swiping from left to right and swiping from right to left mainly by the feature Ra.
5. Experiment results
In this section, the experimental results on measured data are provided to evaluate the effect of the sparsity-driven time-frequency analysis on the hand gesture classification.
5.1. About the classification accuracy.
The period of each gesture of interest is less than 2s, while the measured data are 4s long. To enlarge the dataset, each data recording is equally divided into two pieces. Then the total number of the signal segments is (6 gestures) × (4 people) × (30 repeats) = 720. The 5-fold validation is carried out by dividing the measured data into five parts. Each part of data is used as the testing data and the rest four parts as the training data in turn. The overall recognition accuracy is calculated by averaging the resulting accuracies of 100 trials. The TFS of each data recording are obtained by two approaches, i.e., WVD and OMP, respectively, and then the three features mentioned above are extracted from the time-frequency spectrograms. In the training phase, WVD-driven and OMP-driven features of the training data are used to train the classifier shown in Fig. 5. In the testing phase, WVD-driven and OMP-WVD-driven features of the test data are inputted into the classifier and the classification result is recorded.
5 Tables 2 and 3 show the confusion matrices yielded by
these two kinds of methods, respectively. WVDs with rectangular window, Hanning window, and Hamming window are carried out, and our experiments show that the best classification performance among them comes from the one with rectangular window. So through the experiments of this paper, the WVD results correspond to the use of the rectangular window. From Tables 2 and 3 we can find that OMP can improve the classification accuracy compared to WVD for all the dynamic hand gestures but the gesture (b). Table 4 shows the average accuracies of the two methods, which indicates the superiority of OMP-driven features over WVD-driven features. The reason is that the sparse reconstruction is effective for cross-term suppression in the time-frequency spectrogram and, therefore, improves the accuracy of micro-Doppler feature extraction. Note that the computational complexity of sparse representation is much higher than that of WVD. In our experiment, the average running time of OMP-driven feature extraction is 940.5s while the average running time of WVD-driven feature extraction is only 0.6s.
In what follows we investigate the effect of gestures from personnel targets not belonging to the training set on the classification accuracy. We use the same data collected from
four participants before. The classifier is trained by some participants and tested by the rest people. Table 5 shows the average accuracies of the two methods, where 1, 2, 3 personnel targets participate in training, respectively, and the rest people participate in testing. It indicates that, (1) the increase of the number of people participating in training could improve the classification accuracy; (2) the OMP-based method is still better than the WVD-based method in terms of the classification accuracy in the case that different groups of people participate in training and testing; (3) the accuracy goes down in comparison with that in Table 4 due to the variation of individual gestures.
5.2. Robustness against the observation angle
Fig.6 The experimental geometry with the observation
angle θ=10
In what follows, we test the robustness of the sparsity-driven feature extraction against the observation angle. The observation angle is 0° in the last experiment, while the angle maybe nonzero in practice. For example, in the auxiliary driving environment, it is hard to ensure that the hand is exactly located in the direction of the center of the radar beam. The scenario that we may encounter in practice is shown in Fig.6, where the observation angle θ is assumed to be 10° and the distance between the hand and radar is about 30 cm.
For each gesture, 20 recordings of 2s long observation per personnel target are collected. The same 4 persons
Table 3 Confusion matrix yielded by sparse reconstruction at aspect angle 0°.
Decision Truth (a) (b) (c) (d) (e) (f) (a) 93.8% 9.2% 0.0% 0.7% 0.0% 0.7% (b) 6.2% 89.2% 0.0% 0.0% 0.0% 1.0% (c) 0.0% 0.0% 89.6% 3.7% 0.0% 4.0% (d) 0.0% 0.0% 6.3% 92.0% 0.0% 0.1% (e) 0.0% 0.5% 1.2% 0.0% 99.8% 1.4% (f) 0.0% 1.2% 2.9% 3.6% 0.2% 92.8%
Table 4 Average classification accuracy at aspect angle 0°.
Method WVD SPARSE
Accuracy 90.3% 92.9%
Table 2 Confusion matrix yielded by WVD at aspect angle 0°.
Decision Truth (a) (b) (c) (d) (e) (f) (a) 87.9% 8.5% 0.0% 4.0% 0.0% 0.0% (b) 10.8% 90.1% 0.0% 0.0% 0.0% 0.7% (c) 0.1% 0.0% 84.7% 4.1% 0.0% 3.6% (d) 0.6% 0.0% 11.9% 88.6% 0.0% 1.3% (e) 0.0% 0.0% 0.6% 0.0% 98.4% 2.0% (f) 0.7% 1.3% 2.7% 3.3% 1.6% 92.5%
Table 5 Average classification accuracy in the case that different groups of people participate in training and testing.
Number of people participating in training WVD SPARSE 1 72.9% 76.5% 2 77.8% 83.2% 3 84.4% 87.6%
6 participate in this experiment. Then the number of the signal
segments is (6 gestures) × (4 people) × (20 repeats) = 480. The data are processed as described in previous subsection. Tables 6 and 7 show the confusion matrices yielded by WVD and OMP, respectively. We can find that OMP can enhance the classification accuracy for all the gestures especially for the gesture (a), (b) and (f). Table 8 shows the average accuracies of the two methods. The comparison between Tables 4 and 8 indicates that, (1) the non-zero observation angle could reduce the classification accuracy; and (2) compared to WVD, the sparsity-driven time-frequency analysis can lower the impact of the observation angle and provide relatively robust classification accuracy.
The experiments with the distance between the radar and the hand varying from 10cm to 50cm are also carried out. The reason that the distance is set to be smaller than 50cm is that, (1) most practical systems of hand gesture classification work in short-range scenarios, and (2) high signal-to-noise ratio (SNR) is usually required for radar target classification. From the experiments it is observed that the classification performances of both OMP-based and WVD-based classification methods are almost independent of the distance between the radar and the hand, as long as SNR is high enough.
6. Conclusion
In this paper, we have demonstrated the positive effect of the sparsity-driven time-frequency analysis on hand gesture classification. WVD and OMP were performed to obtain the time-frequency spectrograms of the gestures, respectively, and then three empirical micro-Doppler features, i.e., the negative-to-positive frequency ratio, the duty cycle, and the bandwidth were extracted from the time-frequency spectrograms and inputted to the SVM-based classifier. The experimental results on measured data demonstrate that, compared to WVD, the sparsity-driven time-frequency
analysis can provide more accurate and more robust performance of dynamic hand gesture classification. In this paper we have considered data collected at 25 GHz carrier frequency for short-range contactless sensing of gestures, for example for automotive driver assistance or interactions with smart devices. If longer detection and classification ranges are required, lower carrier frequencies can be considered. The future research will investigate the comparison of the sparsity-driven methods with more sophisticated feature extraction techniques in terms of the classification accuracy.
7. Acknowledgement
This work is supported in part by the National Natural Science Foundation of China under Grant 61661130158, in part by Shenzhen Fundamental Research Program, and in part by the Newton Advanced Fellowship of The Royal Society, and in part by the IET A. F. Harvey Prize awarded to Hugh Griffiths in 2013 and the Engineering and Physical Sciences Research Council [EP/G037264/1].
8. References
[1] Yang, M., Ahuja, N., Tabb, M.: 'Extraction of 2D Motion Trajectories and Its Application to Hand Gesture Recognition', IEEE Trans. Pattern Analysis and Machine Intelligence, 2002, 24, (8), pp. 1061-1074
[2] Cuong, T., Trivedi, M. M.: '3-D posture and gesture recognition for interactivity in smart spaces', IEEE Trans. Ind. Inf., 2012, 8, (1), pp. 178-187
[3] Chen, F.-S., Fu, C.M., Huang, C.L.: 'Hand Gesture Recognition Using a Real-Time Tracking Method and Hidden Markov Models', Image and Vision Computing,
2003, 21, pp. 745-758
[4] Chen, V.C.: 'The Micro-Doppler Effect in Radar' (Artech House, 2011)
[5] Chen, V.C., Li, F., Ho, S.-S., and Wechsler, H.: 'Micro-Doppler effect in radar: phenomenon, model, and simulation
Table 6 Confusion matrix yielded by WVD at aspect angle 10°.
Decision Truth (a) (b) (c) (d) (e) (f) (a) 67.3% 11.9% 0.2% 20.9% 0.0% 0.8% (b) 30.6% 84.8% 1.5% 0.2% 0.0% 4.2% (c) 1.7% 0.3% 71.2% 1.9% 0.5% 0.0% (d) 0.0% 0.0% 2.0% 70.7% 4.8% 19.6% (e) 0.3% 0.0% 3.3% 5.0% 93.0% 0.0% (f) 0.2% 3.1% 21.9% 1.3% 1.7% 75.5%
Table 7 Confusion matrix yielded by sparse reconstruction at aspect angle 10°.
Decision Truth (a) (b) (c) (d) (e) (f) (a) 93.8% 9.2% 0.0% 0.7% 0.0% 0.7% (b) 6.2% 89.2% 0.0% 0.0% 0.0% 1.0% (c) 0.0% 0.0% 89.6% 3.7% 0.0% 4.0% (d) 0.0% 0.0% 6.3% 92.0% 0.0% 0.1% (e) 0.0% 0.5% 1.2% 0.0% 99.8% 1.4% (f) 0.0% 1.2% 2.9% 3.6% 0.2% 92.8%
Table 8 Average classification accuracy at aspect angle 10°.
Method WVD SPARSE
7 study', IEEE Trans. Aerospace and Electronic Systems,
2006, 42, pp. 2-21
[6] Youngwook, K., Hao, L.: 'Human activity classification based on micro-Doppler signatures using a support vector machine', IEEE Trans. Geosci. Remote Sens., 2009, 47, (5), pp. 1328-1337
[7] Fioranelli, F., Ritchie, M., Griffiths, H.: 'Aspect angle dependence and multistatic data fusion for micro-Doppler classification of armed/unarmed personnel', IET Radar Sonar Navig., 2015, 9, (9), pp. 1231-1239.
[8] Fioranelli, F., Ritchie, M., Griffiths, H.: 'Centroid features for classification of armed/unarmed multiple personnel using multistatic human micro-Doppler', IET Radar Sonar Navig., 2016, 10, (9), pp. 1751-1784
[9] Tahmoush, D., Silvious, J.: 'Remote detection of humans and animals', Proc. IEEE Appl. Imag. Pattern Recognit. Workshop, Washington, USA, October 2009, pp. 1-8 [10] Fioranelli, F., Ritchie, M., Griffiths, H.: 'Performance analysis of centroid and SVD features for personnel recognition using multistatic micro-Doppler', IEEE Geosci. Remote Sens. Lett., 2016, 13, (5), pp. 725–729
[11] Kim, Y., Ha, S., Kwon, J.: 'Human detection using Doppler radar based on physical characteristics of targets',
IEEE Geosci. Remote Sens. Lett., 2014, 12, (2), pp. 289–293 [12] Wu, Q., Zhang, Y.D., Tao, W., et al.: 'Radar-based fall detection based on Doppler time–frequency signatures for assisted living', IET Radar Sonar Navig., 2015, 9, (2), pp. 164-172
[13] Narayanan, R. M., Zenaldin, M.: 'Radar micro-Doppler signatures of various human activities', IET Radar Sonar Navig., 2015, 9, (9), pp. 1205-1215
[14] Kim, Y., Moon, T.: 'Human detection and activity classification based on micro-Doppler signatures using deep convolutional neural networks', IEEE Geosci. Remote Sens. Lett., 2016, 13, (1), pp. 8–12
[15] Kim, Y., Toomajian, B.: 'Hand gesture recognition using micro-Doppler signatures with convolutional neural network', IEEE Access, 2016, 4, pp. 7125–7130
[16] Wan, Q., Li, Y., Li, C., Pal, R.: 'Gesture recognition for smart home applications using portable radar sensors', IEEE Conf. on Engineering in Medicine and Biology Society, Chicago, IL, USA , August 2014, pp. 6414-6417 [17] Molchanov, P., Gupta, S., Kim, K., Pulli, K.: 'Short-range FMCW monopulse radar for hand-gesture sensing', Proc. IEEE Radar Conf.,Arlington, VA, USA, May 2015, pp. 1491-1496
[18] Molchanov, P., Gupta, S., Kim, K., Pulli, K.: 'Multi-sensor system for driver’s hand-gesture recognition', IEEE Conf. on Automatic Face and Gesture Recognition, Ljubljana, Slovenia, May 2015, pp. 1-8
[19] Jokanovic, B., Amin, M.G.: 'Sparsity and concentration measures for optimum quadratic time-frequency
distributions of Doppler signals', IEEE Radar Conf., Arlington, VA, USA, May 2015, pp.1211-1215 [20] Luo, Y., Zhang, Q., Qiu, C.W., Li, S., Yeo, T.S.: 'Micro-Doppler feature extraction for wideband imaging radar based on complex image orthogonal matching pursuit decomposition', IET Radar Sonar Navig., 2013, 7, (8), pp. 914-924
[21] Li, G., Varshney, P.K.: 'Micro-Doppler Parameter Estimation via Parametric Sparse Representation and Pruned Orthogonal Matching Pursuit', Selected Topics in Applied Earth Observations and Remote Sensing IEEE Journal of, 2014, 7, (12), pp. 4937-4948.
[22] Amin, M.G., Jokanovic, B., Zhang, Y. D., Ahmad, F.: 'A sparsity-per-spective to quadratic time-frequency distributions', Digit. Signal Processing, 2015, 46, pp. 175-190
[23] Zhang, Y. D.,Amin, M.G., Himed, B.: 'Reduced interference time-frequency representations and sparse reconstruction of undersampled data' , Proc. European Signal Proc. Conf., Marrakech, Morocco, September 2013 [24] Tropp, J., Gilbert, A.: 'Signal recovery from random measurements via orthogonal matching pursuit', IEEE Trans. Inf. Theory, 2007, 53, (12), pp. 4655–4666