Accepted Manuscript
Optimisation of local in-plane constraining forces in double diaphragm forming
S. Chen, O.P.L. McGregor, L.T. Harper, A. Endruweit, N.A. Warrior
PII: S0263-8223(18)30423-9
DOI: https://doi.org/10.1016/j.compstruct.2018.06.062
Reference: COST 9856
To appear in: Composite Structures Received Date: 27 January 2018 Revised Date: 29 April 2018 Accepted Date: 16 June 2018
Please cite this article as: Chen, S., McGregor, O.P.L., Harper, L.T., Endruweit, A., Warrior, N.A., Optimisation of local in-plane constraining forces in double diaphragm forming, Composite Structures (2018), doi: https://doi.org/ 10.1016/j.compstruct.2018.06.062
1
Optimisation of local in-plane constraining forces in double
diaphragm forming
S. Chen, O.P.L. McGregor, L.T. Harper*, A. Endruweit, N.A. Warrior
Composites Research Group, Faculty of Engineering, University of Nottingham, UK, NG7 2RD
*Corresponding author:[email protected]
Abstract
Rigid blocks (risers) were introduced in the double diaphragm forming (DDF) process to
change the local in-plane strain distribution in the diaphragms, aimed at reducing wrinkling
defects in the production of fabric preforms. A two-step optimisation method was
developed to determine the position and dimension of each riser. In Step I, optimisation of
the riser position was conducted using a simplified finite element (FE) model coupled with a
genetic algorithm (GA). The height of each riser was optimised in Step II using a detailed FE
model with the optimised riser positions from Step I. For demonstration, a hemisphere
preform was manufactured by DDF using the optimum riser arrangement established by the
optimisation routine. Results indicate that the optimum riser pattern (shape and position
relative to the component boundary) can dramatically improve the preform quality through
reduction of out-of-plane wrinkles, validating the feasibility of the two-step routine.
Keywords
2 1 Introduction
Double diaphragm forming (DDF) is a process suitable for production of dry preforms for
manufacture of composite components employing liquid moulding. In DDF, fabric plies are
sandwiched between two deformable diaphragms, which are subsequently deep-drawn
over a rigid tool by applying a pressure gradient normal to the surface [1, 2]. Compared to
single diaphragm forming, both diaphragms constantly maintain contact with the fabric plies,
reducing the potential for out-of-plane wrinkling and enabling rapid demoulding of the
finished preform. Since only vacuum pressure is applied and only single-sided tooling of
moderate stiffness is required, DDF generally requires lower capital investment compared
to matched tool forming [3, 4]. Depositing stacks of fabric plies flat on the bottom
diaphragm prior to forming is quick and can be easily automated. In addition, DDF is highly
repeatable, and net-shaped preforms can be produced which minimises in-process waste.
However, defects such as fibre bridging (poor fabric-tool conformity) and fabric wrinkling
are more likely to occur in DDF than in press-tool forming or hand lay-up, in particular for
complex component geometries. This is related to plies being enclosed by diaphragms,
which limits the options to control the forming parameters. Bridging can effectively be
reduced by optimising ply shapes [1, 2, 5], but this approach depends on the location of the
defect relative to the ply perimeter. For more complex geometries it may be necessary to
introduce darts (slits) in the ply to improve the formability and mitigate forming defects [1,
2, 5-8]. The downside to this approach is that fibre continuity is lost, affecting the
mechanical performance, which may only be acceptable in non-critical regions of the
component. The quality of formed components or preforms is also affected by the design of
3 tool may give different results. While some defects may be successfully alleviated following
this method, the design variables are limited and the additional cost of tool redesign is
typically high.
A general approach for preventing defect formation is the application of localised in-plane
tension in the plies, using grippers to constrain the material draw-in during the forming
operation. For matched tool forming, this is discussed in several published studies [10-12].
Similarly, Krebs et al. [13] showed that pre-tensioning the preform, by stretching the
diaphragms prior to forming, can reduce the effect of out-of-plane fabric buckling in
diaphragm formed components. In DDF, biaxial in-plane tension is applied to the plies
through friction on the diaphragm surfaces, which can be controlled by adjusting the
vacuum pressure between the diaphragms. The fabric is constrained much less in DDF than
in matched tool forming, therefore increasing the risk of out-of-plane fabric buckling as it
shears. A non-uniformly distributed constraining force is required to produce a defect-free
component [14, 15], for which cost-effective solutions need to be found. One approach to
achieve this is to locally increase the tension in the fabric in regions prone to defect
formation.
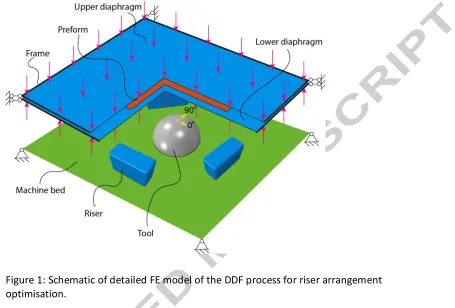
Risers, i.e. rigid blocks, placed between the bed of the machine and the lower diaphragm
(see Figure 1), can be used to locally increase the tensile strain in the diaphragms which is
transferred to the fabric plies (see Figure 2). The position, shape and height of risers can be
modified to control the diaphragm strain in regions where wrinkles are likely to occur in the
fabric [16]. However, risers are typically designed and placed based on trial and error, and it
is difficult to predict intuitively efficient riser configurations to remove wrinkles. Therefore,
4 This study addresses the optimisation of DDF processes through the introduction of risers to
adjust local in-plane constraints, in order to reduce defects related to fabric wrinkling.
Numerical analysis of DDF based on detailed finite element (FE) models is computationally
costly due to non-linear material behaviour, large deformations and complex surface
contacts [1, 2]. Hence, a simplified FE model is developed to simulate the DDF process and
to facilitate the optimisation of the riser arrangement by employing a genetic algorithm (GA).
A case study is presented to demonstrate the effectiveness of applying an optimised riser
pattern to remove wrinkling defects from the final formed shape, and to validate the
simulation-based optimisation method through comparison with experimental results.
2 Materials
2.1 Fabric material
All preforms were made using FCIM359 biaxial carbon fibre non-crimp fabric (NCF), supplied
by Hexcel, Leicester, UK. Each ply is 0.4 mm thick (uncompressed) and consists of 440 gsm of
carbon fibre in 24K tow format. The fibre architecture is ±45° with a pillar stitch at 0° in the
roll direction. While its dominant forming mechanism is in-plane shear deformation, similar
to biaxial woven fabrics, the mesoscopic NCF architecture is based on intra-ply stitches
rather than interlacing of the primary yarns. For the ±45° NCF with 0° aligned pillar stitches
(FCIM359 NCF), positive shear was defined as in-plane shear inducing tension in the stitch
threads, while negative shear corresponds to stitch threads being in compression [17, 18].
The shear resistance in positive shear is significantly influenced by the intra-ply stitches.
5 stitch thread), causing irreversible damage and a significant reduction in shear resistance
[19]. Conversely, in negative shear, the stitches are loaded in compression and the NCF
exhibits similar behaviour to a woven fabric [20], since friction between the primary yarns is
the main source of the in-plane shear resistance. Once the fabric locking angle is reached
due to the onset of lateral yarn compression, a rapid increase in shear resistance is induced
and out-of-plane wrinkling occurs accordingly. The placement of intra-ply pillar stitches
(bisecting the angle between the primary yarns) leads to asymmetric shear behaviour,
increasing the difficulty in reducing forming defects [21]. The occurrence of wrinkling
defects has been correlated with the shear angle, which could be used as a defect index [2,
18]. Hence, controlling the local shear angles has been identified as a strategy to minimise
wrinkling defects. Only wrinkling induced by shear beyond the locking angle is considered in
the current paper, as it has been previously identified to be the main wrinkling defect.
An asymmetric in-plane shear behaviour was previously derived from picture frame shear
tests and modelled using a non-orthogonal constitutive relation as discussed in detail in a
previous paper by the authors [18]. It was implemented in a user-defined subroutine in
Abaqus/Explicit, using the data shown in Table 1. The onset of forming defects was
correlated to the variation in shear angle. In positive shear, the stitch yarns are in tension
and successive failure starts from 28° until 43° when the stitches fail completely. In negative
shear, the stitch yarns are in compression with negligible contribution to the shear modulus.
Out-of-plane fabric wrinkling was observed at shear angles larger than 50° due to yarn
6 2.2 Diaphragm material
The diaphragms were made from 1.56 mm thick Supervac silicone sheet with 50 Shore A
hardness, supplied by Silex Ltd, UK [1, 2]. The density of the diaphragm is 1600 kg/m3. As
described in detail elsewhere [2], a series of mechanical tests were performed on coupons
to characterise the in-plane behaviour of the diaphragm. Uniaxial tensile tests were
performed on a universal testing machine at a strain rate of 0.03 s-1. The cross-section of the
sample was 5.00 mm × 1.56 mm. Equibiaxial tensile tests and planar shear tests were
performed at specimen dimensions of 75 mm × 75 mm. A displacement rate corresponding
to a strain rate of 0.03 s-1 was applied. Pure shear tests were performed by keeping the
specimen width constant, whilst applying an axial displacement corresponding to a strain
rate of 0.03 s-1.
The observed hyperelastic, non-linear stress-strain behaviour was modelled using a
second-order Ogden model [22]. The Marquard-Levenberg algorithm [23] was employed to
determine the Ogden constants (see Table 2), by simultaneously performing a non-linear
least-squares fit on the uniaxial and equibiaxial test data. The root mean squared error
(RMSE) of the obtained Ogden model is 2.2 % for the uniaxial case and 5.5 % for the
equibiaxial case compared to the experimental data. A third mode of deformation (i.e. pure
shear data) was also tested, and the data was used to further validate the model, showing
an RMSE of 5.5 %.
2.3 Friction between materials
The friction behaviour was tested [2] for tool-diaphragm and diaphragm-fabric surface
7 to ASTM D1894, ISO8295. For relative surface movement at constant velocity (100 mm/min),
friction coefficients were calculated from the ratio of the tangential (pulling) force and the
normal force (10 N, corresponding to a normal pressure of 2 kPa), and the average value
was adopted from five repeats for each surface pairing. Friction at all interfaces between
different materials in DDF was assumed to be isotropic. The average coefficients used here
were 0.67 for tool-diaphragm friction and 0.52 for diaphragm-fabric friction (and 0.36 for
fabric-fabric friction).
This approach simplifies the friction behaviour, as both the fabric surface and the diaphragm
surfaces are deformable, and the real friction coefficients may vary with applied normal
force. A decrease in friction coefficient with increasing normal pressure was documented by
Sachs et al. [24] for a woven material on a rigid surface and by Avgoulas et al. [25] for a NCF
on a rigid surface. For fabric-diaphragm contact, geometrical features on the deformable
surfaces may interlock, resulting in strongly increased friction coefficients as the pressure is
increased. Although the actual pressure when vacuum is applied is higher than the normal
pressure in the friction tests, and the normal force may be distributed non-uniformly during
the forming process, any effect on the friction behaviour is ignored for the purpose of this
study.
3 Optimisation methodology
3.1 General strategy
A hemisphere with a diameter of 100 mm was formed using the DDF process. The primary
8 the fabric preform was sandwiched between two diaphragms. The initial blank size was 300
mm × 300 mm with a thickness of 0.4 mm. A pressure differential was applied normal to the
diaphragm surface, and the tensile deformation of the diaphragms around the blank
provides the in-plane constraining forces (transferred through friction) to control the
material forming behaviour.
Aimed at reducing wrinkle formation, risers were introduced to change the local strain in
the diaphragms to constrain fabric deformations. Since it is difficult to predict efficient riser
configurations intuitively in practice, wrinkling defects were minimised based on predictive
numerical simulations. A two-step approach was developed: in Step I, the riser position was
optimised; in Step II, the riser height was optimised. The optimisation in Step I was used to
find appropriate locations to place risers, which was followed by a detailed design
evaluation to finalise the geometry of each riser.
3.2 Step I: Optimisation of riser position
3.2.1 Simplified FE model
The high CPU cost for the DDF simulations was primarily related to the non-linear behaviour
of the diaphragm material and the complex contact conditions. The maximum generated
frictional force at the diaphragm-fabric interface was large enough to prevent relative
displacement, when the normal pressure applied to the diaphragms was approximately 1
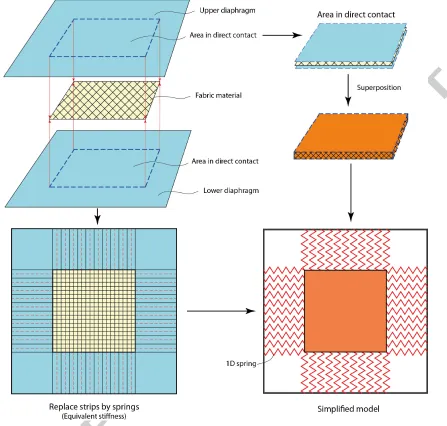
bar and the friction coefficient was 0.52. Thus, as shown in Figure 3, the contribution of the
diaphragms was superimposed to the fabric model in regions where the diaphragm was in
direct contact with the preform. In all other areas, the diaphragm was represented by 1D
9 fabric plies and to a rigid outer frame, thus constraining the blank. The constraining forces
from the springs were therefore used to approximate the in-plane constraints obtained
from the diaphragms. This dramatically decreased the CPU time from about 1 hour to less
than 110 seconds.
While 1D springs are assumed fully elastic here, the approach is transferable to other
diaphragm material behaviours, e.g. updating the spring properties to represent the
equivalent constraining forces (even including nonlinear behaviour). This simplification of
the constraints may affect the accuracy of results, but it enables a near-optimum to be
determined as a starting point for further refinement in Step II, which is performed at much
higher accuracy.
3.2.2 Optimisation approach in Step I
The main purpose of Step I was to determine an appropriate pattern for the riser locations
relative to the component boundary. Referring to the DDF process, obtaining larger in-plane
constraining forces requires larger tensile strains in the diaphragm. The optimum spring
force distribution around the perimeter of the material area (where the diaphragms and the
blank are superimposed) in the simplified model gives an indication to the optimum location
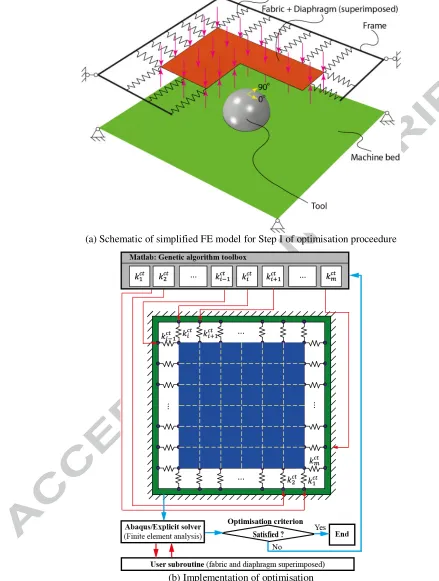
for risers (see Figure 4a). In order to generate different in-plane constraining forces, the
stiffness of each spring was defined as an optimisation variable. As shown in Figure 4b, the
required distribution of in-plane constraining forces from the deformation of the diaphragm
was equivalently optimised by changing the local spring stiffness. Subsequently, risers were
introduced at the identified locations to implement the local adjustment of the constraining
10 Section 3.2.1 on the precision of the simulation is acceptable, since it only provides a
starting point for the next step to carry out further refinement.
In-plane constraints in the form of springs were applied to the nodes along the edge of the
area with superimposed material properties at 10 mm spacing. The optimisation of the riser
position was performed using a GA coupled with a FE analysis to determine the optimum
stiffness value for each spring within a user-defined range. The optimisation was
implemented using Matlab (see Figure 4b). Abaqus/Explicit input files were created using a
group of spring stiffness arrangements called “individuals” generated from the GA for each
loop or “generation”. FE simulations were implemented in Abaqus/Explicit to determine the
shear angle distribution after forming for each individual. FE results were then returned to
the GA in Matlab to determine the corresponding fitness value for the convergence check.
Iterations continued until the optimum was achieved.
The constraining force from each spring could be parameterised as
= ( = 1,2,… , ) (1)
where is the number of springs, is the stiffness of the ith spring, is the extension
of the ith spring, and is the corresponding constraining force. Consequently, the
optimisation variables were converted into a stiffness ( = 1,2,… , ).
The optimisation problem in Step I was expressed as
11
subject to
∈ !"#$, !%&&' ( = 1,2,… , )
(, , ) ∈ (−90°, 90°-
(, , ) ∈ Ω/
0
where · is the GA fitness function to describe the selection criterion of the spring
stiffness. The available stiffness range of each spring is selected from ()"#$ to
()%&&. Ω/ is the spatial material region; (, , ) is the continuous shear angle
distribution in the material region, Ω/.
In the GA, each individual constraining arrangement was evaluated using a fitness function
employed as the assessment criterion. A maximum value criterion (MAXVC) was adopted
here due to faster convergence compared with the Weibull distribution quantile criterion
(WBLQC) previously used by the authors for a similar optimisation problem [26], whilst
maintaining acceptable accuracy. The objective was therefore to keep all local shear angles
below the locking angle, by minimising the maximum shear angle. The maximum was
derived from the finite element approximation for (, , ). Thus,
/2345,,… , ; (, , ) = max(9,:,;)∈<
=|(, , )| ≈ max@,,…,A|| (3)
where /2345· denotes the fitness function using MAXVC, which aims to minimise the
maximum shear angle; B is the total number of material points which corresponds here to
the number of finite elements; |·| is the absolute value of the variable; is the value of the
shear angle at the ith material point, (,, ). The value of /2345 was used for
quantitative assessment of the fitness, since the spring arrangement influences the shear
12 3.2.3 Interpretation for riser position
The optimised distribution of spring forces around the blank was interpreted for each riser
pattern. Once the average stiffness of each spring from the optimum generation is larger
than the average stiffness, a riser is required in the corresponding spring direction. This
criterion was expressed as
C= D1 (. F. GHFG GFIJGF), if L
MMMM > ( !"#$+ !%&&-/2;
0 (. F. GHFG QRS GFIJGF), if MMMM ≤ ( L !"#$+ !%&&-/2.
0 (4)
where C denotes whether a riser is required or not at the ith position, MMMML denotes the
average stiffness of the ith spring from all the individuals of the corresponding generation.
The riser shape was limited to a cuboid in the current work, where the faces were parallel to
the square base of the hemisphere tool. Each selected spring represented a riser of length
10 mm, which was equal to the spring spacing. Neighbouring risers were combined to form
consolidated risers. The criteria for riser consolidation should be defined according to
practicalities, such as avoiding small and sharp risers. If the distance between two adjacent
risers was smaller than a threshold value, they were considered to be part of the same riser.
A minimum riser length was also specified, and any isolated risers were discarded. Here,
these practical considerations of riser design were implemented manually, although they
could be included in the optimisation as additional constraints with a significant increase of
optimisation variables in the objective function. A large number of variables would be
required to define the riser geometry and the additional quantity of variables could also
change during optimisation. Thus, the difficulty in automatically generating FE models
13 3.3 Step II: Optimisation of riser height
While a simplified FE model was used to efficiently locate riser positions as a starting point
where reduced precision was acceptable, a more detailed FE model (previously developed
by the authors and validated for complex preform geometries [2], see Figure 1) was
employed to finalise the optimum height of each riser in Step II. Since the position of the
risers was the optimisation variable in Step I, only a single additional degree of freedom (i.e.
riser height) was considered in Step II. The effect of varying riser height on the in-plane
constraining force is of the same order as changing other geometric parameters of the risers,
such as their shape. Although the local tensile strain in the diaphragms can also be adjusted
through variation of other geometric parameters, only riser height was varied here to
facilitate practical implementation of the optimisation process.
The fabric was modelled in Abaqus/Explicit using 5 mm × 5 mm square membrane elements
(M3D4R), which was found to be suitable in a mesh sensitivity study presented elsewhere
[18]. The diaphragms were modelled using 5 mm × 5 mm S4 shell elements, which were
constrained in the x-y plane around the perimeter to replicate the constraints on the
diaphragm forming rig. Risers were modelled as cuboid blocks placed between the bed of
the machine and the lower diaphragm at the positions determined from Step I. All parts of
the tooling (tool, machine bed and risers) were modelled as rigid bodies. A penalty contact
algorithm was used to define the behaviour at the interfaces. A Coulomb friction model was
adopted for all contact surfaces, using the experimentally determined values for the
coefficients of friction mentioned above. Initially, pressure was applied to the upper surface
of the top diaphragm and the lower surface of the bottom diaphragm, providing the
14 frame around the diaphragm edges was employed to drive the material stack to establish
contact with the machine bed, which was modelled by applying a vertical displacement to
the edge nodes of the diaphragms. Then, the pressure applied to the bottom diaphragm
was reduced to create a pressure differential for drawing the diaphragm arrangement into
contact with the surface of the tool. Gravity was neglected in the FE model.
In the simulations run here, discrete heights of 0 mm (i.e. no risers) to 50 mm were
considered for the heights of the risers, increasing in 10 mm increments. The run time for
each individual forming simulation to investigate the influence of riser height was
approximately 1 hour using an Intel® CoreTM i7-3820 CPU at 3.60 GHz. Therefore the total
run time for 6 simulations to optimise the riser height for the hemisphere was
approximately 6 hours. The evolution of the maximum shear angle in the fabric preform
using different heights of risers was plotted to seek an optimum solution that would reduce
wrinkling defects under both positive and negative shear for the asymmetric material
behaviour of the NCF studied here.
4 Results and discussion
4.1 Validation of simplified DDF model
In total, 961 nodal positions were selected to compare the quality of simulation results
obtained using the simplified model (open red circles in Figure 5) with the detailed model
(solid blue dots in Figure 5), using a reference hemisphere geometry formed without risers.
The distances between the corresponding nodes were calculated to compare the difference
15 two grids is 0.95 mm and the maximum error is 2.74 mm, for a blank that was originally 300
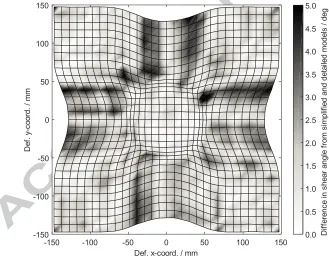
mm x 300 mm. The difference in shear angle magnitude was also calculated, as shown in
Figure 6. The RMSE is 1.3° and the maximum difference is less than 3.5°. The small
difference in results between the simplified model (open red circles) and detailed model
(solid blue dots) in terms of nodal positions reflects the inclusion of slip of the fabric on the
diaphragms in the detailed model. Slip in the detailed model allows more fabric draw-in
than in the simplified model, where slip between fabric and diaphragm is not considered
and only the average displacement is calculated. Results indicate that the simplified FE
model is able to produce a prediction of forming behaviour equivalent to that based on the
detailed FE model to fulfil the requirement of Step I.
4.2 Riser position optimisation from Step I
In Step I, applying springs to the edges of the blanks at a spacing of 10 mm resulted in 31
constraining positions per edge, i.e. 124 variables in total. However, due to the symmetry of
the blank with respect to its two diagonals, the number of independent variables was
reduced to just 31.
The stiffness of each spring was normalised with respect to the initial stiffness of the
corresponding representative diaphragm strip (UV&) according to [27], where the stiffness
was selected from the range of UV& to 5UV&. This was then used as an optimisation
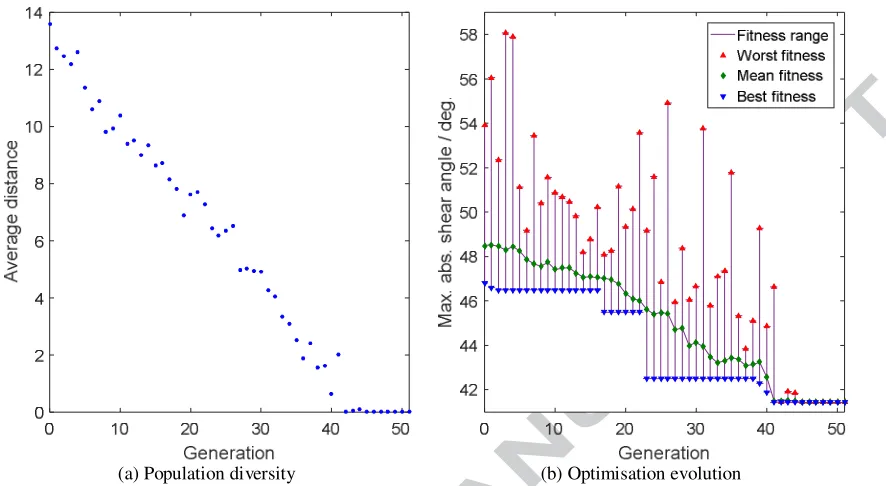
constraint. The normalised average distance between individuals in the solution space is a
measure of the diversity of the population. For the 31 variables in Step I, this must be less
than the maximum value of 22.3 (i.e. the diagonal distance X31 × (5 − 1)). Furthermore,
16 reduction in search space and convergence towards the global optimum. The diversity of
the population for each generation in Step I was checked by evaluating the average distance
between individuals, shown in Figure 7a. For the first five generations the value is
approximately 13, indicating that the initial population covers approximately 58 % (13/22.3)
of the solution space. The average distance reduces by about 1.5 % (0.33/22.3) for each
generation until convergence, indicating that evolution is progressive, allowing sufficient
opportunity for elite genes. Once both the average distance and the fitness value are
constant for at least 5 consecutive generations, convergence has been achieved and the
optimum has been found.
Figure 7b shows the evolution of the fitness scores for Step I. The magnitude of the adaptive
Fitness Range is similar for each generation until the Best Fitness converges, implying that a
wide search range was adopted throughout. The range of the fitness score varies due to
adaptive mutation. The optimum solution (i.e. convergence of the Best Fitness) is achieved
during generation 41. Perturbations induced by further mutations during the next 4
generations (indicated by a non-zero fitness range) appear to have no influence on the
optimum solution. Furthermore, the mutation probability reduces to zero following
generation 45, after the optimum solution was determined. Therefore, Figure 7 confirms
that the present diversity prevents local optimum solutions, random selection and instability.
As shown in Figure 8, optimum riser positions were identified from Step I. A spring
represented by a thick line indicates that a riser is required, where the spring stiffness was
larger than the average of ()"#$ and ()%&&, i.e. 3UV&. Springs represented by thin
lines indicate that an additional in-plane constraint is not required in that location. The
17 reference case with no risers (Figure 8a) to 38.9° when risers are placed at the optimised
positions to locally adjust the constraining forces (Figure 8b). In the negative shear region, a
significant reduction in maximum shear angle (by 10.3°) is also achieved using the optimised
riser arrangement. The predictions in Step I indicate that placement of risers has the
potential to reduce the generation of forming defects, especially unacceptable out-of-plane
wrinkling induced by over-shearing.
Subsequently, the individually identified riser locations in Figure 8b were consolidated for
practical implementation, combining neighbouring riser positions (i.e. springs marked in
bold) and eliminating isolated ones. If the maximum distance between any two adjacent
bold springs did not exceed 30 mm, which is equivalent to the width of 6 finite elements or
3 times the spring spacing, the springs were combined into a consolidated riser. Also, the
length of each consolidated riser obtained from combining springs should not be smaller
than the width (i.e. 50 mm), otherwise it was removed. As a result, only one riser was
required along each edge as shown in Figure 9. Each riser was 130 mm × 50 mm in the x-y
plane, with 6 mm fillets around the edges, where the longest edge was parallel to the
corresponding undeformed blank. A distance of 200 mm was maintained from the longest
edge of riser to the centre of the hemisphere. According to the obtained optimum riser
arrangement in Figure 9, these four risers were placed symmetrically with respect to the
two diagonals of the undeformed square blank, where the offset in riser position from the
middle point of each edge is a reflection of the non-symmetrical fabric shear behaviour. Due
to asymmetric shear behaviour of the fabric induced by the pillar stitches, the angle for
onset of wrinkling is smaller in positive shear than in negative shear. Application of
additional in-plane constraining forces is required to reduce the shear deformation,
18 that, as a general design guideline, optimum positions for risers are around regions of
positive shear resulting in constraining forces being applied along both directions of the
primary yarns.
4.3 Riser height optimisation from Step II
It is essential to adopt the detailed FE model in Step II to finalise the riser design, as it
directly replicates the exact behaviour of the diaphragms rather than supplying an
equivalent response instead. Risers were placed at the specified locations according to
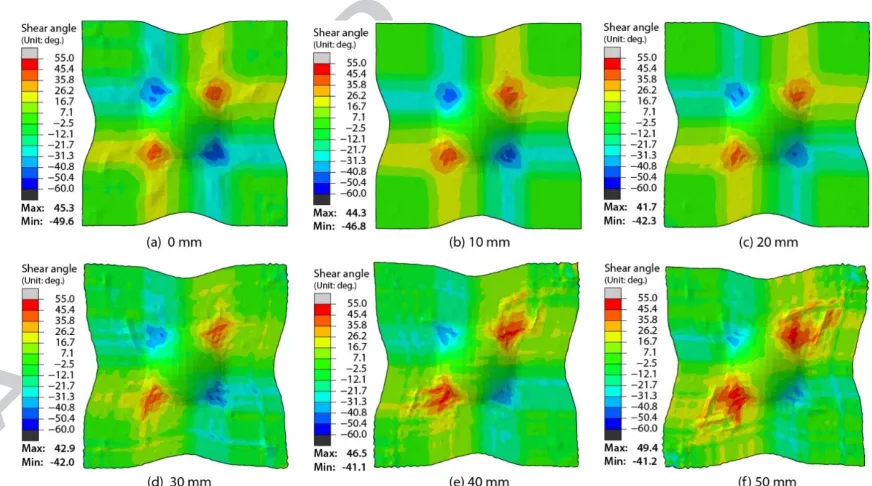
Figure 9. Simulations were run where the height of all risers was increased incrementally; 0
mm (i.e. no risers), 10 mm, 20 mm, 30 mm, 40 mm, 50 mm respectively. The shear angle
distributions were obtained from numerical simulations using the detailed FE model to
investigate the influence of riser height as shown in Figure 10. Then, the optimum height of
each riser was determined from Step II to maintain the optimum formability.
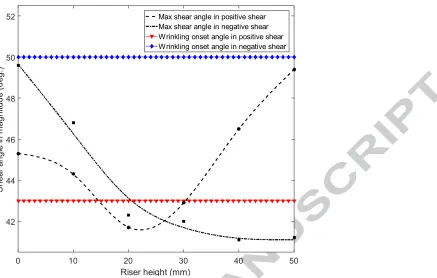
The evolution of the maximum shear angle using different riser heights was plotted to
determine an optimum solution, in order to reduce the number of defects under both
positive and negative shear, as shown in Figure 11. It shows that the maximum shear angle
in the negative shear region (black dot and dash line) decreases with increasing riser height
and reaches a plateau at approximately 40 mm. On the other hand, the maximum positive
shear angle has a local minimum at around 20 mm to 25 mm. The two curves in Figure 11
intersect at approximately 26.5 mm. Although lower shear angles in both positive and
negative shear are preferred in order to reduce the possibility of generating forming defects,
as shown in Table 1 the critical shear angle for out-of-plane wrinkling defects to occur is
19 50°) due to the non-symmetrical material behaviour of the NCF. Therefore, the optimum
riser height should be selected from the range between 20 mm and 25 mm to prevent the
occurrence of defects in positive shear regions. From this range, the highest possible value
should be picked to simultaneously obtain a small shear angle in negative shear. Hence, a
riser height of 25 mm was selected.
Using the optimised riser arrangement, the maximum positive shear angle can be reduced
from 49.4° to 41.6°, whilst the maximum negative shear angle can be reduced from 49.6° to
41.1° according to Figure 11. For other geometries, it may not be possible to reduce the
maximum shear angle below the critical threshold value to prevent the onset of defects in
all cases. However, placing risers can be used in combination with other methods such as
trimming the blank shape and placing darts [1, 2, 5]).
4.4 Experimental validation of riser optimisation
A laboratory–scale diaphragm forming machine [1, 2] was used to validate the optimum
riser arrangement as shown in Figure 12. A single ply of FCIM359 NCF was formed in each
forming experiment, and the biaxial preform was initially placed in the 0°/90° direction (see
Figure 9). The hemisphere was formed using the optimum riser arrangement from Figure 9,
which was compared to the case without risers. A small amount (6 %wt) of reactive binder
(Momentive Epikote 620) was applied on both surfaces of the biaxial fabric. The fabric
material was loaded onto the lower diaphragm and covered by the upper diaphragm. The
edges of the diaphragms were sealed by closing a zipper to encapsulate the fabric. Then, a
vacuum was generated between the diaphragms to clamp the material. The sandwiched
20 melt the powdered binder. Once the set-point was reached, the assembly was quickly
lowered to drape over the rigid tool. Another vacuum was then generated between the tool
and the lower diaphragm to provide a forming pressure for completing the forming process.
The preform was cooled to below the melting point of the binder before being released
from the diaphragms, in order to prevent distortion or spring back and to conserve the
formed configuration for measurement of the local shear angle distribution.
A square grid with a line spacing of 10 mm was marked on the outer surface of the NCF prior
to forming. The grid lines were aligned with the directions of the primary yarns. During
forming, the grid deformed together with the yarns, allowing local variations in fibre
direction to be tracked. The 3D coordinates of grid intersection points were digitised using a
coordinate measuring machine (CMM). In total, 961 points were measured which
correspond to the points taken from the detailed FE simulation. The distance between
numerical and experimental coordinates were compared using a Matlab script to validate
the FE simulations.
As shown in Figure 13, the simulated grid intersections are a close match to the measured
points. The RMSE between the simulated grid and the experimental grid is 1.69 mm for the
reference case (i.e. no risers) and 1.21 mm for the optimum case. The RMSE between two
corresponding surfaces is less than 0.6 % for both cases. Also, the maximum error is 4.37
mm for the reference case (i.e. no risers) and 3.26 mm for the optimum case, which is below
1.5 % for both cases. Figure 13 shows a slightly lower draw-in in the experiment than in the
numerical result, which is a result of zero bending stiffness of the membrane elements in
the numerical model. Importantly, this does not induce a considerable effect on the shear
21 maximum error of less than 1.5 % indicates that the detailed FE model is able to predict
realistic forming behaviour of the NCF.
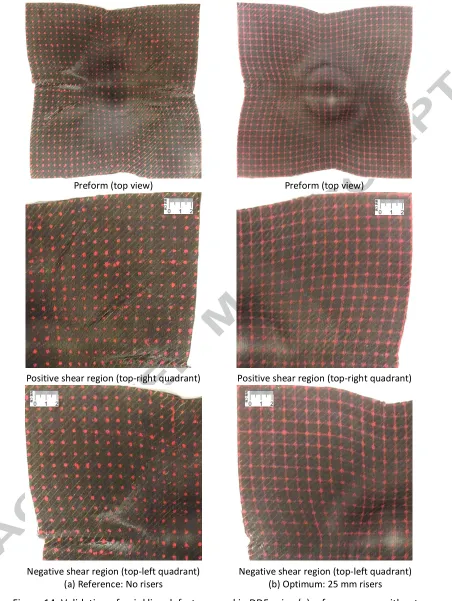
Figure 14 shows photographs of formed fabric layers. A general observation is that,
compared to previous results from matched tool forming of the same fabric discussed in
detail in a recent study [18], asymmetry of the formed material layer is significantly reduced
due to the presence of the diaphragms which dominate the forming behaviour. As shown in
Figure 14a, significant out-of-plane wrinkling occurs when forming a hemisphere using DDF
with no risers. Most of the wrinkles appear in the positive shear region, which is consistent
with the result in Figure 11 for the case with 0 mm risers (i.e. no risers). Using risers at the
predicted optimum arrangement and optimum height (25 mm), the wrinkling defects are
removed from the final preform surface (see Figure 14b). This indicates that the risers are
effective in adjusting the local in-plane constraining forces transferred though the
diaphragms to modify the local shear angle distribution, which can be used to reduce
wrinkling defects in DDF by reducing the local shear angles. The riser arrangement can be
optimised using the developed optimisation method for this particular case. However, it
may require more consideration for more generic cases, starting from the first principles of
the underlying mechanisms causing wrinkling.
5 Conclusions
A method was introduced to improve the performance of the double diaphragm forming
(DDF) process by locally adjusting in-plane constraints using a series of rigid blocks (risers).
22 In the first of two optimisation steps, a simplified FE model was developed to efficiently
simulate the DDF process for forming NCF, where springs were applied around the edge of
the blank to replicate the in-plane force derived from the diaphragms. The stiffness of each
spring required to constrain the blank was optimised using a GA, in order to minimise the
maximum fabric shear angle for wrinkling reduction. The distribution of the resulting spring
forces around the perimeter of the fabric plies was then reproduced by introducing risers at
locations where adjustment of in-plane tensile force was required. The criterion for adding a
riser was based on the ratio of local spring stiffness and diaphragm stiffness. Individual
risers were then consolidated to enable industrial implementation according to practicalities.
In the second optimisation step, simulations were run to determine the effect of riser height
on the fabric forming behaviour, where different heights of risers were considered. A riser
height of 25 mm was found to be the optimum solution for the riser arrangement
investigated. Results indicate that the appropriate placement of risers in DDF can help to
reduce wrinkling defects, which can be successfully optimised using the developed two-step
simulation-based method.
6 Acknowledgements
The work presented in this paper was completed as part of the “Thermoplastic
Overmoulding for Structural Composite Automotive Applications” (TOSCAA) project. The
23 7 References
[1] Chen, S., Fabric forming simulation and process optimisation for composites. 2016, University of Nottingham.
[2] Chen, S., McGregor, O., Endruweit, A., Elsmore, M., De Focatiis, D., Harper, L., and Warrior, N., Double diaphragm forming simulation for complex composite structures. Composites Part A: Applied Science and Manufacturing, 2017. 95: p. 346-358.
[3] Pantelakis, S.G., Katsiropoulos, C.V., Labeas, G., and Sibois, H., A concept to optimize quality and cost in thermoplastic composite components applied to the production of helicopter canopies. Composites Part A: Applied Science and Manufacturing, 2009. 40(5): p. 595-606.
[4] Pantelakis, S.G. and Baxevani, E.A., Optimization of the diaphragm forming process with regard to product quality and cost. Composites Part A: Applied Science and Manufacturing, 2002. 33(4): p. 459-470.
[5] Alshahrani, H. and Hojjati, M., Experimental and numerical investigations on formability of out-of-autoclave thermoset prepreg using a double diaphragm process. Composites Part A: Applied Science and Manufacturing, 2017.
[6] Hallander, P., Akermo, M., Mattei, C., Petersson, M., and Nyman, T., An experimental study of mechanisms behind wrinkle development during forming of composite laminates. Composites Part A: Applied Science and Manufacturing, 2013. 50: p. 54-64.
[7] Hallander, P., Sjölander, J., and Åkermo, M., Forming induced wrinkling of composite laminates with mixed ply material properties; an experimental study. Composites Part A: Applied Science and Manufacturing, 2015. 78: p. 234-245.
[8] Sjölander, J., Hallander, P., and Åkermo, M., Forming induced wrinkling of composite laminates: A numerical study on wrinkling mechanisms. Composites Part A: Applied Science and Manufacturing, 2016. 81: p. 41-51.
[9] Krebs, J., Bhattacharyya, D., and Friedrich, K., Production and evaluation of secondary composite aircraft components—a comprehensive case study. Composites Part A: Applied Science and Manufacturing, 1997. 28(5): p. 481-489.
[10] Haanappel, S., Ten Thije, R., Sachs, U., Rietman, B., and Akkerman, R., Formability analyses of uni-directional and textile reinforced thermoplastics. Composites Part A: Applied science and manufacturing, 2014. 56: p. 80-92.
[11] Kärger, L., Galkin, S., Zimmerling, C., Dörr, D., Linden, J., Oeckerath, A., and Wolf, K., Forming optimisation embedded in a CAE chain to assess and enhance the structural performance of composite components. Composite Structures, 2018. 192: p. 143-152.
[12] Harrison, P., Gomes, R., and Curado-Correia, N., Press forming a 0/90 cross-ply advanced thermoplastic composite using the double-dome benchmark geometry. Composites Part A: Applied Science and Manufacturing, 2013. 54: p. 56-69.
[13] Krebs, J., Friedrich, K., and Bhattacharyya, D., A direct comparison of matched-die versus diaphragm forming. Composites Part A: Applied Science and Manufacturing, 1998. 29(1–2): p. 183-188.
24 [15] Chen, S., Harper, L.T., Endruweit, A., and Warrior, N.A., Optimisation of forming process for
highly drapeable fabrics, in 20th International Conference on Composite Materials. 2015: Copenhagen Denmark.
[16] McGregor, O.P.L., Chen, S., Haper, L.T., Endruweit, A., and Warrior, N.A., Defect reduction in the double diaphragm forming process, in 21st International Conference on Composite Materials. 2017: Xi'an China.
[17] Creech, G. and Pickett, A., Meso-modelling of non-crimp fabric composites for coupled drape and failure analysis. Journal of materials science, 2006. 41(20): p. 6725-6736.
[18] Chen, S., McGregor, O., Harper, L., Endruweit, A., and Warrior, N., Defect formation during preforming of a bi-axial non-crimp fabric with a pillar stitch pattern. Composites Part A: Applied Science and Manufacturing, 2016. 91: p. 156-167.
[19] Dumont, F., Weimer, C., Soulat, D., Launay, J., Chatel, S., and Maison-Le-Poec, S., Composites preforms simulations for helicopters parts. International Journal of Material Forming, 2008.
1(1): p. 847-850.
[20] Lomov, S.V., Barburski, M., Stoilova, T., Verpoest, I., Akkerman, R., Loendersloot, R., and Thije, R.H.W.t., Carbon composites based on multiaxial multiply stitched preforms. Part 3: Biaxial tension, picture frame and compression tests of the preforms. Composites Part A: Applied Science and Manufacturing, 2005. 36(9): p. 1188-1206.
[21] Lee, J.S., Hong, S.J., Yu, W.-R., and Kang, T.J., The effect of blank holder force on the stamp forming behavior of non-crimp fabric with a chain stitch. Composites Science and Technology, 2007. 67(3–4): p. 357-366.
[22] Ogden, R. Large deformation isotropic elasticity-on the correlation of theory and experiment for incompressible rubberlike solids. in Proceedings of the Royal Society of London A: Mathematical, Physical and Engineering Sciences. 1972. The Royal Society.
[23] Twizell, E. and Ogden, R., Non-linear optimization of the material constants in Ogden's stress-deformation function for incompressinle isotropic elastic materials. The Journal of the Australian Mathematical Society. Series B. Applied Mathematics, 1983. 24(04): p. 424-434.
[24] Sachs, U., Akkerman, R., Fetfatsidis, K., Vidal-Sallé, E., Schumacher, J., Ziegmann, G., Allaoui, S., Hivet, G., Maron, B., and Vanclooster, K., Characterization of the dynamic friction of woven fabrics: experimental methods and benchmark results. Composites Part A: Applied Science and Manufacturing, 2014. 67: p. 289-298.
[25] Avgoulas, E., Mulvihill, D., Endruweit, A., Sutcliffe, M., Warrior, N., De Focatiis, D., and Long, A., Frictional behaviour of non-crimp fabrics (NCFs) in contact with a forming tool. Tribology International.
[26] Chen, S., Endruweit, A., Harper, L., and Warrior, N., Inter-ply stitching optimisation of highly drapeable multi-ply preforms. Composites Part A: Applied Science and Manufacturing, 2015.
71: p. 144-156.
25 8 Tables
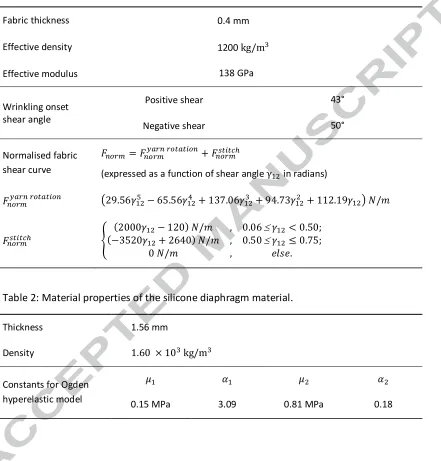
Table 1: Material properties of FCIM359 used in non-orthogonal material model.
Fabric thickness 0.4 mm
Effective density 1200 kg/m]
Effective modulus 138 GPa
Wrinkling onset shear angle
Positive shear 43°
Negative shear 50°
Normalised fabric shear curve
^#U = ^#U:_U^ U#_#^+ ^#U`a
(expressed as a function of shear angle γ in radians)
^#U:_U^ U#_#^ 29.56d − 65.56e + 137.06] + 94.73 + 112.19! B/
^#U`a h
(2000− 120) B/ , 0.06 ≤ < 0.50;
(−3520+ 2640) B/ , 0.50 ≤ ≤ 0.75;
0 B/ , FjHF.
[image:26.612.91.532.140.601.2]0
Table 2: Material properties of the silicone diaphragm material.
Thickness 1.56 mm
Density 1.60 × 10] kg/m]
Constants for Ogden hyperelastic model
k l k l
[image:27.612.88.543.133.441.2]
26 9 Figures
Figure 1: Schematic of detailed FE model of the DDF process for riser arrangement optimisation.
[image:28.612.90.537.68.494.2]
28
(a) Schematic of simplified FE model for Step I of optimisation proceedure
[image:29.612.62.501.83.664.2](b) Implementation of optimisation
[image:30.612.88.540.66.336.2]
29 Figure 5: Comparison of grids obtained from simplified (red circles) and detailed (blue solid dots) FE models. The contour shows the distance between the two grids, which represents the error between the two modelling approaches, presented as a grey-scale value.
Figure 6: The difference in shear angle obtained from the simplified model against the one obtained from the detailed model. The contour shows the difference in shear angle, presented as a grey-scale value.
-150 -100 -50 0 50 100 150
[image:30.612.72.401.392.649.2]30
[image:31.612.93.536.98.341.2](a) Population diversity (b) Optimisation evolution
Figure 7: GA stability and convergence analyses for riser position optimisation in Step I.
[image:31.612.74.507.317.613.2](a) Reference: no risers (b) Optimum from Step I
[image:32.612.89.543.103.354.2]
31 Figure 9: Optimum riser arrangement determined from Step I for 0°/90° preforms by DDF.
[image:32.612.83.519.403.646.2][image:33.612.100.537.64.342.2]
32 Figure 11: Evolution of maximum shear angle in both positive and negative shear regions for 0°/90° preforms when placing risers at different heights at the optimised positions.
Figure 12: Application of risers to reduce wrinkling defects using a laboratory scale diaphragm forming machine installed at the University of Nottingham.
0 10 20 30 40 50
Riser height (mm) 42 44 46 48 50 52 S h e a r a n g le in m a g n itu d e ( d e g .)
[image:33.612.93.513.379.560.2]33
(a) Reference: No risers
(b) Optimum: 25 mm risers
34
Preform (top view) Preform (top view)
Positive shear region (top-right quadrant) Positive shear region (top-right quadrant)
[image:35.612.81.533.65.666.2]Negative shear region (top-left quadrant) Negative shear region (top-left quadrant) (a) Reference: No risers (b) Optimum: 25 mm risers