Essays on Large Panel Data Models
Inaugural-Dissertation
zur Erlangung des Grades eines Doktors
der Wirtschafts- und Gesellschaftswissenschaften
durch die
Rechts- und Staatswissenschaftliche Fakult¨
at
der Rheinischen Friedrich-Wilhelms-Universit¨
at Bonn
vorgelegt von
Oualid
Bada
aus Monastir (Tunesien)
Dekan: Prof. Dr. Rainer H¨uttemann Erstreferent: Prof. Dr. Alois Kneip Zweitreferent: Prof. Dr. Robin Sickles
UNIVERSITY OF BONN
Abstract
Department of EconomicsInstitute for Financial Economics and Statistics
Doctoral Thesis
Essays on Large Panel Data Models
by OualidBada
The standard panel data literature is moving from micro panels, where the cross-section dimension is large and the intertemporal sample size is small, to large panels, where both, the cross-section and the time dimension, are large. This thesis contributes to this new and growing area of panel data treatments called“large panel data analysis”. My dissertation consists of three essays: In the first essay, a large panel data model with an omitted factor structure is considered. The role of the factors is to control for the issue of the unobserved time-varying heterogeneity effects. A parameter cascading strategy is proposed to enable efficient estimation of all model parameters when the number of factors is unknown a priori. In the second essay, further models that combine large panel data models with different versions of unobserved latent factors are discussed. Computation-related issues are solved and new specification tests are introduced to check whether or not these factors can be interpreted as classical additive fixed effects. In the third essay, a novel method for estimating panel models with multiple structural changes is proposed. The breaks are allowed to occur at unknown points in time and may affect the multivariate slope parameters individually. Asymptotic results are derived, Monte Carlo experiments are performed, and applications for highlighting these new methods are discussed.
Acknowledgements
I would like to express my heartfelt gratitude to the many people who have supported me in writing this thesis. First, I am deeply indebted and thankful to my supervisor Prof. Dr. Alois Kneip for his continuous guidance and vital advice during the writing of this thesis. His insightful comments helped me to enhance my understanding of advanced and state-of-the-art statistical techniques. He has been an enormous source of inspiration for my research and motivated me to keep improving my papers and the way they might contribute to my research area.
I would like to sincerely thank my co-author Dr. Robin Sickles, Professor of Econometrics at Rice University, for the extraordinary collaboration on the project that constitutes the core of Chapter 3. I am grateful for his time, his enthusiasm, and his generosity during my stay as a visiting researcher in the Department of Econometrics at Rice University. I also want to thank our co-author, James Gualtieri, for investing so much time in collecting data and contributing to the development of the application part. I would also like to express my gratitude to my co-author and my friend JProf. Dr. Dominik Liebl, who contributed to the joint paper presented in Chapter 2. I benefited much from his numerous helpful remarks and creative ideas. I will miss his extraordinary talent to identify and simplify substantially important and complex statistical problems. In addition, I would like to give my gratitude to all my colleagues in the department of statistics in the Institute for Financial Economics and Statistics of the University of Bonn: Prof. Dr. Lorens Imhof, Heiko Wagner, Dominik Poß, Prof. Dr. Hans-Joachim Werner, Dr. Klaus Utikal, Fabian Walders, Martin Arndt, and Hildegard Grober. They not only provided me technical help, but also helped me to improve my German language skills and taught me a lot of unconventional idioms.
I would like to express my deepest gratitude to my parents Emna and Romdhan, my uncle Khaled, my aunt Metira, my sister Wihed, and my brother Wissem. I could not have had the opportunity to study in Bonn and to write this dissertation without them. I also would like to thank all my family members, in particular, Naima Moussa, Ali Abbes, Fatma Boughtass, Rami Abbes, Ameur Abbes, Safouane Jguirim, Safa Bac-couche Abbes, and Ghada Abada as well as my friends Kacem Kassraoui, Walid Hamdi, and Nadhmi Nefzi. They have played an important moral-support role.
Last but not least, to my wonderful wife Abir, who has supported me in good and bad times during all phases of this thesis: I love you.
Contents
Abstract v
Acknowledgements vii
Contents ix
List of Figures xi
List of Tables xiii
Introduction 1
1 Panel Models with Unknown Number of Unobserved Factors: An
Ap-plication to the Credit Spread Puzzle 5
1.1 Introduction . . . 5
1.2 Model and Estimation Algorithm . . . 8
1.2.1 Model Identification and Estimation . . . 8
1.2.2 Starting Values and Iteration Scheme . . . 12
1.3 Model Extension and Theoretical Results . . . 15
1.3.1 Presence of Additional Categorical Variables . . . 15
1.3.2 Assumptions . . . 17
1.3.3 Asymptotic Distribution and Bias Correction . . . 19
1.4 Monte Carlo Simulations . . . 21
1.5 Application: The Unobserved Risk Premia of Corporate Bonds . . . 28
1.5.1 The Empirical Model . . . 28
1.5.2 Data Description . . . 30
1.5.3 Empirical Results and Interpretations . . . 32
1.6 Conclusion . . . 35
2 The R-package phtt: Panel Data Analysis with Heterogeneous Time Trends 37 2.1 Introduction . . . 37
2.2 Panel Models for Heterogeneity in Time Trends . . . 41
2.2.1 Computational Details . . . 44
2.2.2 Application . . . 45
2.3 Panel Criteria for Selecting the Number of Factors . . . 49 ix
2.3.1 Application . . . 52
2.4 Panel Models with Stochastically Bounded Factors . . . 56
2.4.1 Model with Known Number of Factors . . . 56
2.4.2 Model with Unknown Number of Factors . . . 57
2.4.3 Application . . . 60
2.5 Models with Additive and Interactive Unobserved Effects . . . 63
2.5.1 Specification Tests . . . 67
2.5.1.1 Testing the Sufficiency of Classical Additive Effects . . . 67
2.5.1.2 Testing the Existence of Common Factors . . . 69
2.6 Interpretation . . . 71
2.7 Summary . . . 73
3 Panel Models with Multiple Jumps in the Parameters 75 3.1 Introduction . . . 75
3.2 Preliminaries . . . 78
3.3 Two-way Panel Models with Multiple Jumps . . . 83
3.3.1 Estimation . . . 83
3.3.2 Assumptions and Main Asymptotic Results . . . 86
3.4 Post-SAW Procedures . . . 89
3.4.1 Tree-Structured Representation . . . 89
3.4.2 Detecting the Jump Locations . . . 92
3.4.3 Post-SAW Estimation . . . 93
3.5 SAW with Unobserved Multifactor Effects . . . 95
3.6 Monte Carlo Simulations . . . 99
3.7 Application: Algorithmic Trading and Market Quality . . . 103
3.7.1 Liquidity and Asset Pricing . . . 104
3.7.2 Data . . . 106
3.7.2.1 The Algorithmic Trading Proxy . . . 106
3.7.2.2 Market Quality Measures . . . 107
3.7.3 Results . . . 109
3.8 Conclusion . . . 115
A Appendix of Chapter 1 117 A.1 Theoretical Results and Proofs . . . 117
B Appendix of Chapter 3 123 B.1 Proofs of Section 3.2 . . . 123 B.2 Proofs of Section 3.3 . . . 129 B.3 Proofs of Section 3.4 . . . 135 Bibliography 143 x
List of Figures
1.1 Credit spread curves before and after transformation . . . 31
1.2 Screeplots for static and dynamic factors . . . 33
1.3 Estimates of the time varying rating effects and the systematic factors . . 33
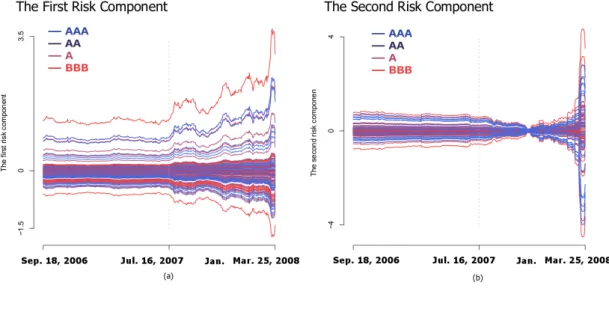
1.4 Estimated first and second risk components . . . 35
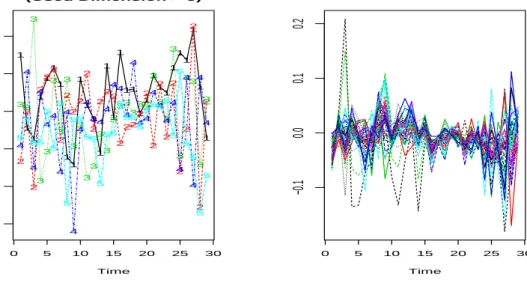
2.1 Plots of the dependent and independent variables . . . 41
2.2 Estimated factors and estimated time-varying individual effects . . . 48
2.3 Scree plot produced by the plot()-method forOptDim-objects . . . 54
2.4 Estimated factors and estimated time-varying individual effects . . . 64
2.5 Estimated additive and interactive heterogeneity effects . . . 67
2.6 Visualization of the differences of the time-varying individual effects . . . 73
3.1 Tree-structured representation of the wavelet coefficients . . . 90
3.2 Tree-structured representation of the shifted and non-shifted coefficients . 90 3.3 Time varying effect of algorithmic trading on the proportional quoted spread . . . 112
3.4 Time varying effect of algorithmic trading on the proportional effective spread . . . 113
3.5 Effect of algorithmic trading on the daily high-low price range . . . 114
3.6 Time varying effect of algorithmic trading on the realized variance . . . . 115
List of Tables
1.1 Simulation results of the Monte Carlo experiments for DGP1 - DGP3 . . 26
1.2 Simulation results of the Monte Carlo experiments for DGP4 - DGP6 . . 27
1.3 Number of corporate bonds by rating class . . . 31
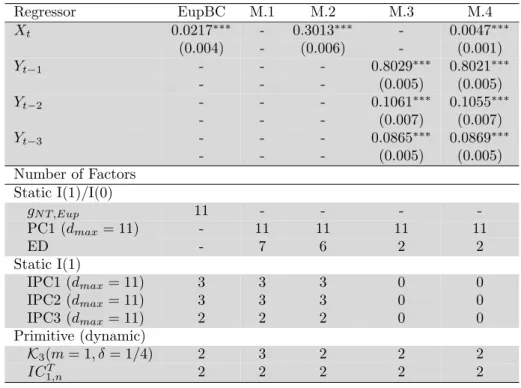
1.4 Estimation results for the empirical Models (M.1)-(M.4) . . . 34
2.1 List of the variance shares of the estimated common factors . . . 72
3.1 Simulation results of the Monte Carlo experiments for DGP1-DGP2 . . . 101
3.2 Simulation results of the Monte Carlo experiments for DGP3-DGP4 . . . 102
3.3 Simulation results of the Monte Carlo experiments for DGP5-DGP6 . . . 102
3.4 Simulation results of the Monte Carlo experiments for DGP7 . . . 103
3.5 Instrumental variable panel data model with constant parameters . . . 110
3.6 Post-wavelet estimates for the proportional quoted spread . . . 112
3.7 Post-wavelet estimates for the proportional effective spread . . . 113
3.8 Post-wavelet estimates for the daily high-low price range . . . 114
3.9 Post-wavelet estimates for the realized variance . . . 115
I would like to dedicate this thesis to my beloved parents, my
wonderful wife, and my admirable daughter.
Introduction
The standard panel data literature is moving from micro panels, where the cross-section dimension is large and the intertemporal sample size is small, to large panels, where both, the cross-section and the time dimension, are large. This thesis contributes to this new and growing area of panel data treatments called“large panel data analysis”. My dissertation consists of three essays: In the first essay, a large panel data model with an omitted factor structure is considered. The role of the factors is to control for the issue of the unobserved time-varying heterogeneity effects. A parameter cascading strategy is proposed to enable efficient estimation of all model parameters when the number of factors is unknown a priori. In the second essay, further models that combine large panel data models with different versions of unobserved latent factors are discussed. Computation-related issues are solved and new specification tests are introduced to check whether or not these factors can be interpreted as classical additive fixed effects. In the third essay, a novel method for estimating panel models with multiple structural changes is proposed. The breaks are allowed to occur at unknown points in time and may affect the multivariate slope parameters individually. Asymptotic results are derived, Monte Carlo experiments are performed, and applications for highlighting these new methods are discussed.
Due to the impressive progress of information technology, econometricians and statisti-cians, nowadays, have the privilege of working with large dimensional data sets. In the panel data literature, this has been succeeded by the opening of new research perspec-tives. Recent studies have discussed large panel data models in which the unobserved heterogeneity can be estimated by an“approximate factor structure”. The latter, unlike the standard setup of factor models, allows for the presence of weak forms of cross-section and time-series dependence in the idiosyncratic components. The extended regression models combining conventional panel models and factor structures provide a generaliza-tion of classical panel models with additive heterogeneity effects. Indeed, it allows for the individual specific effects to be affected by unobserved common time-shocks.
The first chapter is joint work with Alois Kneip. Our paper is published inComputational Statistics and Data and Analysis; see Bada and Kneip (2014). In this chapter, we extend the iterated least squares approach of Bai (2009) and Bai et al. (2009) in such a way that we allow the number of factors to be unknown a priori. We propose inserting a penalty term into the objective function to be globally optimized and updating iteratively the estimators of all required parameters in hierarchical order. Our parameter-cascading strategy also includes the update of the penalty term in order to adjust the height of the penalization and to avoid under- or over-parameterization effects. We allow for the presence of stationary and non-stationary factors and discuss the case in which the static factor presentation arises from a small number of dynamic primitive shocks. We show that our extension does not affect the asymptotic properties of the iterated least squares estimator. Our Monte Carlo experiments confirm that, in many configurations of the data, such a refinement provides more efficient estimates in terms of MSE than those that could be achieved if the feasible iterative least squares estimator is calculated with an externally selected factor dimension. In our application, we consider the problem of the so-called“credit spread puzzle”–the gap between the observed corporate bond yields and duration-equivalent government bond yields that classical financial models of credit risk fail to explain. Our empirical study detects the presence of two unobserved primitive risk factors affecting the U.S. corporate bond market during the period between September 2006 and March 2008.
The second chapter is written in collaboration with Domink Liebl. Our paper is pub-lished in the Journal of Statistical Software; see Bada and Liebl (2014b). This chapter focuses on important computational aspects related to the panel methods of Bai (2009) and Kneip et al. (2012). As the estimation procedure of Kneip et al. (2012) involves nonparametric estimation techniques, the choice of an appropriate smoothing parameter can be very crucial in practice. We propose using a slightly modified version of the Gen-eralized Cross Validation (GCV) criterion to determine an upper bound for the optimal smoothing parameter. Using this, we can obtain an enormous gain in terms of compu-tation compared to the cross validation criterion proposed by Kneip et al. (2012). Bai’s method relies on an iterated least squares approach and also requires the determination of external parameters such as the number of factors to be considered and appropriate starting values to initiate the iteration process. We propose using the starting estimator and the iteration scheme of Bada and Kneip (2014). Additionally, we review a wide range of recently developed dimensionality criteria that can be applied in this context. To examine the significance of the factors and test whether a model with factor structure is more appropriate than a simple panel model with additive effects, we propose using two testing procedures: a Hausman-type test and az-test based on the method of Kneip et al. (2012). All these methods are implemented in anRpackage called phtt(see Bada
Introduction 3
and Liebl (2014a)). To the best of our knowledge,phtt is the first software package that provides this large number of methods for analyzing large panel data. To demonstrate the functionality of our package, we re-explore the well known Cigar dataset and re-visit the model of Baltagi and Li (2006) to allow for the presence of an omitted factor structure in the idiosyncratic components.
The third chapter is based on joint work with Alois Kneip, James Gualtieri, and Robin Sickles. This chapter proposes a novel method for estimating panel models with multiple structural changes that may occur at unknown points in time. In spite of the growing literature on large panel data analysis, there is an important issue that is scarcely dis-cussed in most of the existing work –the risk of neglecting structural breaks in the data generating process, especially when the observation period is large. Our model general-izes the special model specification in which the slope parameters are time homogeneous. Our theory considers breaks in a two-way panel data model, in which the unobserved heterogeneity is composed of additive individual effects and time specific effects. We show that our method can also be extended to cover the case of panel models with un-observed heterogeneous common factors as proposed by Bai (2009), Kneip et al. (2012), Ahn et al. (2001), Pesaran (2006), and Bada and Kneip (2014). We provide a general setup allowing for endogenous models such as dynamic panel models and/or structural models with simultaneous panel equations. Consistency under weak forms of dependency and heteroscedasticity in the idiosyncratic errors is established and the convergence rate of our slope estimator is derived. To detect the jump locations consistently and test for the statistical significance of the breaks, we propose post-wavelet procedures. Our simulations show that, in many configurations of the data, our method performs very well. Our empirical vehicle for highlighting this new methodology addresses the stability of the relationship between Algorithmic Trading (AT) and Market Quality (MQ). We find evidence that the relationship between AT and MQ was disrupted between 2007 and 2008.
Chapter 1
Panel Models with Unknown
Number of Unobserved Factors:
An Application to the Credit
Spread Puzzle
1.1
Introduction
In recent years, the use of panel data has attracted increasing attention in many empirical studies. This is motivated by the fact that such data sets allow statisticians to deal with the problem of the unobserved heterogeneity. Recent studies have discussed large panel data models in which the unobserved heterogeneity can be modeled by a factor structure; see, e.g., Bai (2009), Bai et al. (2009), Kneip et al. (2012), and Pesaran (2006). While most of the ongoing studies have focused on fitting the model for a given number of factors, the present work considers the problem of estimating the factor dimension jointly with the unknown model parameters. Our estimation algorithm can be applied for models of the form:
Yit=Xitβ+ FtΛ0i | {z } (1×d)×(d×1)
+it for i∈ {1,· · · , N} and ;t∈ {1,· · ·, T}, (1.1)
where Xit is a (1×p) vector of observable regressors, β is a (p×1) vector of unknown
parameters, Λi is a (1×d) vector of individual scores (or factor loadings),Ft is a (1×d)
vector of unobservable common time-varying factors, it is the error term, and dis an
unknown integer, which has to be estimated jointly with β,Λi and Ft.
The difference between (1.1) and the classical panel data models consists in the unob-served factor structure FtΛ
0
i. It is noted that (1.1) not only provides a generalization of
panel data models with additive effects, where d= 2, Ft = (ft,1,1), and Λi = (1, λ2,i),
but also includes the dynamic factor models in static form as in Stock and Watson (2005). To illustrate this case, consider a static factor model with autocorrelated idiosyncratic errors of orderP such that
Yit = Ft∗Λ
0
i+eit and
eit = β1ei,t−1+. . .+βPei,t−P +it.
It is easily verified that integrating the expansion of eit in the first equation and using
ei,t−p = Yi,t−p −Ft∗−pΛ
0
i for each p = 1, . . . , P results in a panel model of form (1.1),
where the regressors are the lags of Yit, i.e., Xit = (Yi,t−1, . . . , Yi,t−P), and Ft = Ft∗−
β1Ft∗−1− · · · −βPFt∗−P.
Moreover, the static presentation of the unobserved factor structure in (1.1) can arise from q-dimensional dynamic factors, say Ft, (also called primitive factors or primitive
shocks). In this case, Ft= [Ft, . . . ,Ft−m] andd=q(m+ 1)≥q.
Stock and Watson (2005) propose to estimate dynamic factor models in static form by the iterated least squares method (also called iterative principal component). Bai (2009) studies (1.1) in the context of panel data models and provides asymptotic theory for the iterative least squares estimators when both N and T are large. However, Stock and Watson (2005) and Bai (2009) assume the factors to be stationary. Bai et al. (2009) extend the theoretical development of Bai (2009) to the case where the cross-sections share unobserved common stochastic trends of unit root processes. They prove that the asymptotic bias arising from the time series in such a case can be consistently estimated and corrected. Ahn et al. (2013) consider the classical case where T is small and N is large and estimate the model by using the generalized method of moments (GMM). They show that, under fixedT, the GMM estimator is more efficient than the estimator of Bai (2009).
A second criticism of the conventional iterative least squares method is that the number of unobserved factors has to be known a priori. In this regard, Bai and Ng (2002) and Bai (2004) propose new panel information criteria to assess the number of significant factors in large panels. The performance of these criteria depends, however, on the choice of an appropriate maximal number of factors to be considered in the selection procedure. Hallin and Liˇska (2007) propose similar criteria in the context of generalized dynamic factor models and provide a calibration strategy to adjust the height of the penalization; however, the calibration requires extensive computations. Alternatively, Kapetanios (2010) proposes a threshold approach based on the empirical distribution properties of
Chapter 1. Panel Models with Unknown Number of Unobserved Factors 7
the largest eigenvalue. The method requires i.i.d. errors. Onatski (2010) extends the approach of Kapetanios (2010) by allowing the errors to be either serially correlated or cross-sectionally dependent. Onatski (2009) proposes a test statistic based on the ratios of adjacent eigenvalues in the case of Gaussian errors. Alternative methods for assessing the number of factors in the context of principal component analysis and classical factor analysis can be found in Josse and Husson (2012), Dray (2008), and Chen et al. (2010). But note that all these approaches assume the factors to be extracted directly from observed variables and not estimated with other model parameters.
Kneip et al. (2012) consider the case of observed regressors and unobserved common factors and propose a semi-parametric estimation method and a sequential testing pro-cedure to assess the dimension of the unobserved factor structure. The asymptotic properties of their approach rely on second order differences of the factors and i.i.d. idiosyncratic errors. Pesaran (2006) attempts to control for the hidden factor structure by introducing additional regressors into the model, which are the cross-section averages of the dependent variables and the cross-section averages of the observed explanatory variables. The advantage of this estimation procedure is its invariance to the unknown factor dimension. However, the method does not aim to consistently estimate the factor structure but only deals with the problem of its presence when estimating the remaining model parameters.
In this chapter, we extend the iterative approach of Bai (2009) and Bai et al. (2009) in such a way that we allow for the number of factors to be unknown a priori. We integrate a penalty term into the objective function to be globally optimized and update iteratively the estimators of all required parameters in hierarchical order as described in Cao and Ramsay (2010). Our parameter-cascading strategy also includes the update of the penalty term in order to adjust the height of the penalization and avoid under-and over-parameterization. Monte Carlo experiments show that, in many configurations of the data, such a refinement provides more efficient estimates in terms of MSE than those that could be achieved if the feasible iterative least squares estimator is calculated with an externally selected factor dimension.
There are a lot of examples where the determination of the number of factors in the presence of additional observed regressors is of particular interest. As an example, we consider, in our application section, the problem of the so-called credit spread puzzle– the gap between the observed corporate bond yields and duration-equivalent government bond yields that classical financial models of credit risk fail to explain (see, e.g., Huang and Huang (2012), and Elton et al. (2001)). For a long time, the credit spread has been considered a simple compensation for credit default risk. Most empirical studies show, however, that default risk cannot be the unique explanatory variable. Kagraoka
(2010) decomposes the credit spread into credit risk, illiquidity risk, and an unobservable risk component, which he defines as systematic risk premium; however, he assumes the unobserved part to be generated by only one factor. Castagnetti and Rossi (2011) adopt a heterogeneous panel model with multiple factors. Their results suggest that credit spreads are driven by observable as well as unobservable common risk factors.
In our application, we extend the empirical development of Kagraoka (2010) by allowing for the systematic risk premium to be composed of multiple hidden factors. Moreover, we allow for some slope coefficients to be temporally heterogeneous. This differs from the setting of Castagnetti and Rossi (2011), who use a panel model with cross-sectionally heterogeneous slope parameters. Our empirical study relies on daily observations of 111 U.S. corporate bonds over a period of 397 business days. Our results suggest the presence of two unobserved primitive risk factors affecting U.S. corporate bonds during the period between September 2006 and March 2008, while one single factor is sufficient to describe the data for the time periods prior to the beginning of the subprime crisis in 2007.
The remainder of this chapter is organized as follows: Section 2 proposes an algorithmic refinement of the conventional iterative least squares estimation method. In Section 3, we extend the model with additional nominal variables, discuss the model assumptions and present some asymptotic results. Section 4 presents the results of our Monte Carlo simulations. Section 5 describes the empirical application and interprets the results. Conclusions and remarks are provided in Section 6.
1.2
Model and Estimation Algorithm
1.2.1 Model Identification and Estimation
In vector and matrix notation the model is written as
Yi =Xiβ+FΛ0i+i, (1.2)
where Yi = (Yi1,· · ·, YiT)
0
, Xi0 = (Xi01,· · · , XiT0 )0, F = (F10, . . . , FT0)0, Λi is a (N ×d)
matrix of loading parameters, andi is a (T×1) vector of idiosyncratic errors.
The basic idea of our extension is to treat the conventionally iterated least squares estimators as functions dependent on a run parameter d. The latter is fitted by means of a penalty term that is directly integrated into the global objective function to be optimized. The final solution is obtained by alternating between an inner iteration to
Chapter 1. Panel Models with Unknown Number of Unobserved Factors 9
optimize ˆβ(d),F( ˆˆ β,d), and ˆΛi( ˆβ,F ,ˆ d) for each givend and an outer iteration to select
the optimal dimension ˆd.
Our optimization criterion can be defined as a penalized least squares objective function of the form: S(Λi, F, β,d) = 1 N T N X i ||Yi−Xiβ−FΛ 0 i||2+dg, (1.3)
whereg is a penalty term that depends on the sample size N and T.
Before beginning with the details of the estimation procedure, it is important to mention that the intrinsic problem of factor models consists in the identification of the true factors and the true loading parameters. This is becauseFΛ0i can be replaced withF∗Λ∗i0, where F∗=F H, Λ∗i0 =H−1Λ0
i, andH is an arbitrary (d×d) full rank matrix. In order ensure
the uniqueness ofF and Λi (up to sign change), the following normalization conditions
(d×drestrictions) are required:
(R.1): PN
i=1Λ
0
iΛi/N is a (d×d) diagonal matrix, where the diagonal elements are
ordered decreasingly and (R.2): F0F/Tδ=I
d, whereIdis the (d×d) identity matrix.
The rateTδ can be chosen according to the stochastic character ofF
t. Generally,δis set
to 1 if the factors are stationary and to 2 if they are integrated of order 1; see, e.g., Bai and Ng (2002), and Bai (2004). To be sparing with notation throughout the chapter, from now on we setδ to 2.
Our computational algorithm is based on a parameter cascading strategy, which is pro-posed by Cao and Ramsay (2010) to estimate models with multi-level parameters. The algorithm is relatively easy to program and can be described and implemented by the following logic:
Step 1 (the individual parameters Λi)
We estimate the individual parameters by minimizing the objective functionS(β, F,Λi,d)
with respect to Λifor each givenF, β, andd. Because the penalty term does not depend
on Λi, the optimization criterion at this stage can be expressed as:
S1(Λi|β, F,d) = 1 N T N X i ||Yi−Xiβ−FΛ 0 i||2.
Minimizing for Λi and using restriction (R.2), we get
ˆ
Λ0i(F, β,d) =F0F−1F0[Yi−Xiβ] =F0[Yi−Xiβ]/T2. (1.4)
Step 2 (the time trend effects F)
We make use of result (1.4) and minimize the objective function S2(F|β,d), which
depends only on β and d:
S2(F|β,d) = N T1 PiN||Yi−Xiβ−FΛˆ 0 i||2 = N T1 PN i ||[Yi−Xiβ]−F F 0 T2 [Yi−Xiβ]||2.
After rearranging, we can see that minimizingS2(F|β,d) with respect toF is equivalent
to maximizing the term N T1 PN
i ||
F F0
T2 (Yi−Xiβ)||2.
Solving for F(β,d) subject to (R.2), we obtain the following result: ˆ
F(β,d) =TP(β,ˆ d), (1.5)
where ˆP(β,d) is a (T ×d) matrix containing the first d eigenvectors [ ˆP1,Pˆ2,· · ·,Pˆd],
which correspond to the first d eigenvalues, ˆρ1(β,d) ≥ρˆ2(β,d),· · ·,≥ ρˆd(β,d), of the
matrix ˆ Σ(β,d) = 1 N T N X i=1 [Yi−Xiβ(d)] [Yi−Xiβ(d)]0. (1.6)
Step 3 (the common slope parameter β)
To estimate the slope parameter, we reintegrate (1.4) and (1.5) into (1.3) and optimize the new intermediate objective function
S3(β|d) = 1 N T N X i ||Yi−Xiβ−Fˆ(β,d) ˆΛ 0 i(β,d)||2. (1.7)
Because ˆF(β,d) depends nonlinearly on β, the minimization of (1.7) is conventionally done iteratively. For a givend, the estimators ofβ, F, and Λishould satisfy the following
equation: ˆ β(d) = " N X i=1 Xi0Xi #−1" N X i=1 Xi0 h Yi−Fˆ( ˆβ(d)) ˆΛ 0 i( ˆβ(d)) i # . (1.8)
Chapter 1. Panel Models with Unknown Number of Unobserved Factors 11
We want to emphasize that our setting differs slightly from the development of Stock and Watson (2005), Bai (2009) and Bai et al. (2009) because ˆβ(d), in (1.8), depends on the unknown parameterd, which has to be jointly estimated.
Step 4 (the dimension d)
The basic idea of constructing consistent panel information criteria consists of finding appropriate penalty functions that reestablish asymptotically the variance minimization when the considered number of factors increases. Explicitly, the optimal dimension ˆd can be obtained by minimizing a criterion of the form
S4(d) = 1 N T N X i=1 ||Yi−Yˆi(d)||2+dg, (1.9)
where ˆYi(d) is the fitted response variable based on a given dimension d. The penalty
terms proposed by Bai and Ng (2002) and Bai (2004) basically depend on the orders of magnitude in probability of the sequences
1 N T N X i=1 ||Yi−Yˆi(d)||2− 1 N T N X i=1 ||Yi−Yˆi(d)||2 = Ωp(κu) and (1.10) 1 N T N X i=1 ||Yi−Yˆi(d)||2− 1 N T N X i=1 ||Yi−Yˆi(d)||2 =Op(κo), (1.11)
depending onN, T ∈N. Here,d∈ {0, . . . , d−1},d∈ {d+ 1, . . . , dmax}, where dmax is
an arbitrary large dimension greater thand.
To ensure that limN,T→∞P[S4(d)> S4(d)] = 1 for all d = {0, . . . , dmax|d 6= d}, it is
sufficient to choose g, such that
(i) limN,T→∞κ−u1g−→0 and
(ii) limN,T→∞κ−o1g−→ ∞.
The existence of a function g satisfying (i) and (ii) requires, of course, κu/κo → ∞,
which is often fulfilled because the common information, in the presence of a factor structure, is accumulated stochastically faster than the unit specific information in the errors, asN, T → ∞. Intuitively,gcan be of the form√κuκo or log(κu/κo)κo. For more
explicit examples, we refer the reader to the papers of Bai and Ng (2002), Bai (2004), and Hallin and Liˇska (2007).
The problem with this method is that the degree of freedom in the choice of g is too large, since g is not unique and multiplying it with any finite positive value will not
hurt (i) and (ii). Bai and Ng (2002) and Bai (2004) propose to scale g with ˆσ2dmax =
1
N T
PN
i=1||Yi−Yˆi(dmax)||2. However, such a penalization can lead to a result that is too
sensitive to the choice of dmax.
In our algorithm, we utilize ˆσ2d
max only as a starting scaler and make further use of the
parameter cascading strategy to calibrategrecursively by updating the sample variance after updating the factor dimension. At the optimum, the obtained estimators, referred to hereafter as entirely updated estimators and denoted by Eup, satisfy the following system of equations: ˆ σ2Eup = N T1 PN i ||Yi−XiβˆEup−FˆEupΛˆ 0 Eup,i||2, ˆ
dEup = arg min
d 1 N T PN i ||Yi−XiβˆEup−FˆEupΛˆ 0 Eup,i||2+g(ˆσEup2 ), ˆ βEup = N P i=1 Xi0Xi −1N P i=1 Xi0 h Yi−FˆEupΛˆ 0 Eup,i i , ˆ FEup = √
TPˆ( ˆβEup,dˆEup), and
ˆ
Λ0Eup,i = FˆEup0 hYi−XiβˆEup
i
/T2,
(1.12)
whereg(ˆσEup2 ) = ˆσEup2 alog(bb), witha= 1 and b=N T /(N+T) if the factor structure is composed of mixed stationary and non-stationary factors or a=T /(4 log log(T)) if all factors are non-stationary stochastic trends.
Remark 1.1. As outlined in the introduction, the d static factors can be composed of the leads and the lags of onlyq < dprimitive factors. The intuition behind estimatingβ with a consistent estimator ofdand notqis to avoid possible omitted-variable problems. However, assessing the number of the really existing primitive shocks in the data can be very useful for interpretation. For this purpose, a VAR regression with order m ≤ ( ˆdEup −1) can be applied to ˆF
0
Eup. If the static factors are effectively driven by q
dynamic factors, then the rank of the VAR residual covariance matrix is equal toq (at least asymptotically). Bai and Ng (2007) and Stock and Watson (2005) make use of this feature to provide selection procedures based on the principal components of the VAR residuals. Alternatively, one can apply the sequential testing procedure of Onatski (2009) or use the information criterion of Hallin and Liˇska (2007) on the spectral density matrix of ˆFEupΛˆ 0 Eup,(N) = ( ˆFEupΛˆ 0 Eup,1, . . . ,FˆEupΛˆ 0
Eup,N). If the factors are I(1) processes, we
replace ˆFEup,t with ∆ ˆFEup,t = ˆFEup,t−FˆEup,t−1 before estimatingq.
1.2.2 Starting Values and Iteration Scheme
Note that the multidimensional objective function S(β, F,Λi,d) in (1.3) is not globally
convex. To insure that the iteration algorithm converges to the global optimum, it is important to choose reasonable starting values for d and β. Because, in practice, only
Chapter 1. Panel Models with Unknown Number of Unobserved Factors 13
samples with finite dimensions can be observed, we propose starting with the following integer: dmax =
j
min{√N ,√T}k, where bzc indicates the integer part of z. This technical setting provides only a systematic approach to initiate the iteration. For huge data sets, the square root function can be replaced by the natural logarithm or by any truncation method. But this is not necessary, since dmax will be replaced directly
after the first iteration with the estimated factor dimension and refined iteratively until convergence. More important is the starting value of the slope parameter. We propose using the following estimate:
ˆ βstart= "N X i=1 Xi0[I−GG0]Xi #−1" N X i=1 Xi0[I−GG0]Yi # , (1.13)
where G is the (T ×dmax) matrix of the eigenvectorsG1, . . . , Gdmax, corresponding to
the first dmax eigenvalues of the augmented matrix
ΓAug= 1 N T n X i=1 [Yi, Xi][Yi, Xi] 0 .
The idea behind these starting estimates relies on the fact that the true unobserved fac-torsF cannot escape from the space spanned by the eigenvectors of the augmented ma-trix ΓAug. The orthogonal projection ofXi onGin (1.13) eliminates the effect of a
possi-ble correlation between the observed regressorsXi and the unobserved factorsF, which
can heavily distort the value of ˆβstartfrom the trueβif it is neglected. However, the
prob-lem of this starting estimate is that
h PN i=1X 0 i[I−GG 0 ]Xi i and h PN i=1X 0 i[I−GG 0 ]Yi i
in (1.13) will be close to zero if the observed regressors are the underlying factors, i.e., Xi ≈ FΛ
0
i . In this case, the estimation algorithm can misleadingly converge to an
insignificant estimate of β and compensate for that by estimating factors that origi-nally exist only in the observed regressors. To overcome such limitation, we recommend under-scaling the factors Gl, l = 1, . . . , dmax, with (1−maxp∈{1,...,P}r2Gl,Xp)0.5, where
rGl,Xp is the sample correlation coefficient between Gl and the p-th element of Xi (or
the p-th eigenvector of the (T ×T) covariance matrix of Xi, for p ∈ {1, . . . , dmax}).
This automatically eliminates the factors that are perfectly correlated with the observed regressors, and gives the remaining factors appropriate weights.
In spite of the complex form of our estimates, implementing the algorithm that opti-mizesS(Λi, β, F,d) through optimizing S1(Λi|β, F,d),S2(F|β,d),S3(β|d) andS4(d) is
relatively easy. The final estimators can be obtained by alternating between • rm inner iterations until convergence of the following composite function:
ˆ β(rm)◦Fˆ(rm)◦Λˆ(irm) ˆ d(m) ≈βˆ(rm−1)◦Fˆ(rm−1)◦Λˆ(rm−1) i ˆ d(m) ,
for each given ˆd(m), and
• outer iterations until satisfying the following convergence condition: ˆ
d(m+1)◦σˆ2(m)= ˆd(m)◦σˆ2(m−1).
Here, the composite notationc◦b(z) is defined byc(b(z)) for eachzand used to indicate the application of one estimate on the result of another.
Note that this iteration scheme simplifies the minimization of the dimensionality criterion (1.9), since ˆd(m+1) can be obtained by
ˆ d(m+1) = arg min d 1 N T PN i ||Yi−Xiβˆ(rm)−Fˆ(rm)Λˆ(irm)||2+dg(ˆσ2(m)) = arg min d PT l=d+1ρˆ (rm) l +dg(ˆσ2(m)),
where ˆρ(lrm) are the ordered eigenvalues of the covariance matrix (1.6) required to com-pute ˆF(rm) at the iteration stage rm and
ˆ σ2(m)= 1 N T N X i ||Yi−Xiβˆ(rm)−Fˆ(rm)Λˆ(irm)||2 = T X l= ˆd(m)+1 ˆ ρ(lrm). (1.14)
Selecting ˆd(m+1) reverts therefore to finding the order of the smallest element in the following set: A(m)= T X l=d+1 ˆ ρ(lrm)+dalog(b) b T X l= ˆd(m)+1 ˆ ρ(lrm) d= 0,1, . . . ,dˆ(m) . (1.15)
A simple pseudo code that optimizes the entirely updated estimators presented in (1.12), can be described as follows:
1. Set dˆ(m)= ( dmax if m= 0 ˆ d(m−1) if m >0 2. Set βˆ(rm)= ( ˆ βstart if rm= 0 ˆ β(rm−1) if r m>0 3. Use (1.5) to calculate Fˆ(rm)= ˆF( ˆβ(rm),dˆ(m)) 4. Use (1.4) to calculate Λˆ(irm) = ˆΛi( ˆF(rm),βˆ(rm),dˆ(m))
5. Use (1.8) to update β(rm+1) = ˆβ( ˆd(m)) by using Fˆ(rm) and Λˆ(irm)
6. If βˆ(rm+1)≈βˆ(rm), go to 7; else, replace the value of βˆ(rm) with βˆ(rm+1) and repeat 2 − 6 with (rm+ 1) instead of (rm)
Chapter 1. Panel Models with Unknown Number of Unobserved Factors 15
7. Use (1.14) to calculate σˆ2(m)
8. Select dˆ(m+1) that corresponds to the order of the smallest element in the set A(m) in (1.15)
9. If dˆ(m+1) = ˆd(m), exit; else, replace the value of dˆ(m) with dˆ(m+1) and ˆ
β(rm) with βˆ(rm+1) and go to 1 with (m+ 1) instead of (m) and (r
m+1+
1) instead of (rm).
Remark 1.2. We can, of course, use the analytic expression of ˆΛ0Eup,i to write the esti-mator of β in (1.12) conventionally as ˆ βEup= "N X i=1 Xi0MFˆ EupXi #−1" N X i=1 Xi0MFˆ EupYi # , (1.16)
where MFˆEup = IT −FˆEupFˆ
0
Eup/T2. However, implementing the estimation algorithm
with (1.16) may destabilize the convergence of the iteration process, since the update of the slope estimator, in this case, requires the inversion of the matrix PN
i=1Xi0MFˆEupXi
in each iteration stage and not only at the optimum.
Remark 1.3. In order to speed up the computation whenN < T, we can reconstruct the estimation algorithm with S1(F|Λi, β,d) and S2(Λi|β,d) instead of S1(Λi|F, β,d) and
S2(F|β,d). The benefit of such modification is to calculate the eigenvectors of a smaller
covariance matrix with a dimension (N ×N) instead of (T ×T). Both computations ultimately lead to the same result.
The routines of this method are provided in an R-Package calledphtt. For more details about this package, we refer the reader to the paper of Bada and Liebl (2014b).
1.3
Model Extension and Theoretical Results
1.3.1 Presence of Additional Categorical Variables
Our model assumptions will closely follow the the setup of Bai et al. (2009), who al-low for mixed stationary and unit root regressors (I(0)/I(1) regressors) as well as mixed I(0)/I(1) unobserved factors. However, our analysis encounters an additional complica-tion allowing for model (1.2) to be obtained from transforming an underlying model of the form: Yit◦=Xit◦β+ K X k=1 αktδik+FtΛ 0 i+µt+εit. (1.17)
Here,Yit◦ andXit◦ are the underlying observed variables that change overiandt,δik is a
nominal variable defined asδik= 1 if individual ibelongs to categoryk,k= 1, . . . , K <
N, and 0 otherwise, αkt is a time heterogeneous parameter describing the effect of the
categories on the dependent variable,µtis the time varying general average of Yit◦,FtΛ
0
i
is, as above, the unobserved factor structure with unknown dimension, and εit is the
idiosyncratic error.
An application of such a model specification and examples of dependent and independent variables are presented in Section 1.5.1. Note that the identification of the additional parameters αkt and µt in (1.17) requires additional restrictions:
(R.3): PK k αkt= 0, PN i=1Λi = 0 and PN i=1δikΛi= 0 for k= 1, . . . , K.
This condition does not impose any unreasonable limitation but only identifies the model parameters by imposing on the categorical variable δik and the parameters µt and αkt
to be unconnected with the parameters of the factor structure.
In order to avoid reverting to constrained optimization techniques that rely explicitly on (R.3), we use a within-group transformation first to eliminateαktand µtfrom (1.17)
and then to estimate the transformed model as described in Section 1.2. The parameters αkt and µt can be easily estimated in a second step once ˆdEup,βˆEup,FˆEup,and ˆΛ
0
Eup,i
are obtained. To this end, we define the linear transformation operatorT(.) as
T(Zit) =Zit− K X k=1 1 mk N X j=1 Zitδjk, (1.18) wheremk=]{j|δjk = 1}fork∈ {1, . . . , K}.
Let Yit = T(Yit◦), Xit =T(Xit◦) and it = T(εit). By using (R.3), we can easily verify
that
T(Yit◦) =Yit=Xitβ+FtΛ
0
i+it. (1.19)
The transformed Model (1.19) has the same form as Model (1.2) and can be fitted by the entirely updated estimators. In order to estimate the pre-eliminated parametersαktand
µt, we propose to use a dummy variable regression once ˆβEup, ˆFEup,Λˆ
0
Eup,iand ˆdEupare
obtained. In fact, estimatingαkt and µt does not require any iteration since restriction
(R.3) arranges for the orthogonality betweenδik and Λi. The solution has consequently
the same form as the classical fixed effects estimators: ˆ µt = Y.t−X.tβˆEup and ˆ αkt = Ykt−XktβˆEup−µˆt, whereY.t= N1 PNi Yit, X.t = N1 PNi Xit, Ykt= m1k PN i δikYit,andXkt= m1k PN i δikXit.
Chapter 1. Panel Models with Unknown Number of Unobserved Factors 17
1.3.2 Assumptions
We now consider inference of (1.19) as (N, T) → ∞. Here, (N, T) → ∞ has to be interpreted as a sequential limit: first T → ∞ and then N → ∞. Throughout, we denote by M a finite positive constant, not depending on N and T. We use B(.) to denote a Brownian motion process defined on [0,1] andbτcto denote the largest integer ≤ τ. We will use β◦, Ft◦ and Λ◦i to respectively denote the true slope parameters, the true factors (only identifiable up to rotation), and the true loadings parameters. EC(.) is
used to denote conditional expectation givenF◦. For allN, we assume an i.i.d. random sample of individuals.
Our theoretical setup relies on the following assumptions.
Assumption 1. The observed regressors:
(a) mk
N converges a.s. toE(δik) as N → ∞, where infk=1,...,KE(δik)>0.
(b) LetXitβ◦ =Xit,1β◦1+Xit,2β◦2, whereXit,1 is (1×P1) vector of a I(1) multivariate
process, such that Xit,0 1 = Xi,t0 −1,1 +ζit0 −PK
k=1δikζ¯
0
kt where ζ
0
it is a zero mean
(P1 ×1) stationary vector and ¯ζ 0 kt = m1k PN j=1δjkζ 0 jt. Xit,2 is (1×P2) vector
of stationary regressors, such that Xit,2 = X◦ 0 it,2 − PK k=1δikX¯ ◦0 kt,2 with ¯X ◦0 kt,2 = 1 mk PN j=1δjkX◦ 0
jt and EC(Xit,◦2ζjs) = 0 for alli, j, t and s.
Assumption 2. The unobserved factor structure:
(a) E||Λ◦i||4≤M; As N → ∞,E(Λ◦
iδik) = 0 for allk= 1, . . . , K, and N1 PiΛ◦
0
i Λ◦i
p
→ ΣΛ, a (d×d) positive definite matrix.
(b) Ft◦0 =Ft◦−01+η0t, where ηt0 is a zero mean random vector with E||ηt0||4+γ ≤M for
some γ > 0 and for all t; As T → ∞, T12 P tF◦ 0 t Ft◦ d → R Bη0Bη, a d×d random
matrix, whereBηis a vector of Brownian motion with a positive definite covariance
matrix Ωη. ηt is independent of Xit,◦2 for all i, t, k.
(c) lim infT→∞log log(T)/T2PTt=1F
0◦
t Ft◦ =C, whereC is a nonrandom positive
def-inite matrix.
(d) {Ft, Xit,∗1} are not cointegrated, where X∗ 0 it = X∗ 0 i,t−1 +ζ∗ 0 it, t = 2, . . . , T with Xi∗10 =Xi01,ζit∗0 =ζit0 −PK k=1δikζ0 0 kt, and ζ0 0 kt=EC(ζ 0 kt|δik= 1), k= 1, . . . , K.
Assumption 3. The error terms:
(a) Let it = εit−Pkk=1δikε¯kt with ¯εkt = Pnj=1 m1k
Pn
j=1εjtδjk. Here, it are zero
mean error terms and EC(¯εkt|δik = 1) = 0 for allk. Conditional on ηt the error
termsεit are cross-sectionally independent of each other as well as of Xit◦.
(b) The multivariate processes wit = (εit, ζit∗, ηt) are stationary. For each i, wit =
P∞
j=0Πijvi,t−j, where vit= (vitε, v ζ
it, v
η
t) are mutually independent over i, t as well
as identically distributed over t. Furthermore, E(vit) = 0, E(vitv
0
it) > 0, and
E(kvitk8) ≤ M, where M < ∞ is independent of i, t. In addition, all further
conditions of Assumptions 2. and 3 of Bai et al. (2009) are satisfied.
The additional terms ¯ζkt and ¯εkt in Assumptions 2 and 3 reflect our subtraction of
group means. Assumption 1.a guarantees that theK categories (groups) do not vanish as N → ∞. Assumption 1.b allows for mixed I(1)/I(0) regressors. As in Bai et al. (2009), the I(0) regressors are assumed to be exogenous and linearly independent of the I(1) regressors and the I(1) factors. This is only given for the purpose of simplifying the analysis and avoiding further complications.
The requirement E(Λ◦iδik) = 0 for all k= 1, . . . , K, in Assumption 2, is the population
version for our condition (R.3) introduced for identifying αkt. We want to emphasize
that the transformation T(.) only influences the structure of the error terms and the explanatory variables, but not the factor structureFt◦Λ0i◦. Assumptions 2.b and 2.c are commonly used in the literature of non-stationary factor models with unit roots; see, e.g., Bai (2004) and Bai et al. (2009). Assumption 2.d is a technical assumption used to ensure the non-singularity of the long run covariance matrix Ωb,i of (ζ∗
0 it, η 0 t) 0 . This allows for estimating the asymptotic bias of the slope estimator.
Assumption 3 excludes cross-section dependencies ofitandζit∗ conditional on{ηt}. But
unconditionally, weak cross-section correlations are allowed under Assumptions 3.b of Bai et al. (2009).
Remark 1.4. Assumption 2 considers the presence of only I(1) factors. But note that the method is also robust to mixed I(1)/I(0) factors. Bai et al. (2009) argue that, for known d, the limiting distribution of the slope estimator, in this case, is the same as when all factors are I(1) (except for small modifications in the expression of the asymptotic variance). Their arguments should also hold for our extended model.
Remark 1.5. The last part of Assumption 1.b considerably simplifies the analysis of the asymptotic distributions of the slope parameters. This is because the I(0) and I(1) regressors are asymptotically orthogonal and their asymptotic distributions can be separately analyzed: while the estimator ofβ2◦needs no correction and is asymptotically
Chapter 1. Panel Models with Unknown Number of Unobserved Factors 19
normal distributed (see Bai (2009) and Bai et al. (2009)), the estimator of β◦1 has a distribution as if there is no I(0) regressors. Note that the aim of separating I(0) and I(1) variables is to correctly derive the rates of convergence. Bai et al. (2009) argue that if the ultimate purpose is to perform hypothesis testing, one can proceed as if all regressors are I(1) since the scaling factor will be canceled out in the end.
Because of Remark 1.5, we can drop from now on the indexes 1 and 2 respectively from β1◦ and β2◦ and focus only on the complicated case, i.e., panel cointegration model with I(1) regressors and I(1) unobserved factors. This allows us to avoid notational mess in the remainder of the chapter.
1.3.3 Asymptotic Distribution and Bias Correction
Under Assumptions 1-3, it can be shown that the effects of the model transformation due toT(.) are asymptotically negligible and that the results of Bai et al. (2009) generalize to our situation. In particular, the slope estimator ˆβ(d) to be obtained for the true factor dimensiondis at least T consistent and has following properties.
Proposition 1.6. Under the above assumptions, we have, as (N, T)→ ∞,
Σ1c/2√N T( ˆβ(d)−β◦)−√N φ−→d N(0, Ip),
for some φand Σc, where β(d)ˆ is obtained after transforming Model (1.17) with T(.).
The exact expression of φ and Σcis given in the appendix. Proposition 1.6 shows that
the limiting distribution of √N T( ˆβ(d)−β◦) is not centered at zero. Bai et al. (2009) prove that it is possible, in such a case, to construct a consistent estimator ˆφN T of the
bias termφ. Following their suggestion, we define ourentirely updated and bias corrected
(EupBC) estimator by
ˆ
βEupBC = ˆβEup−
1 TφˆN T.
This procedure does require extra work (non-parametrical kernel estimation techniques) to estimate the long-run and one-sided long-run covariances of wit = (εit, ζit∗, ηt). The
necessary assumptions and precise formulas for constructing ˆφN T are given in the
ap-pendix. Once ˆβEupBC is obtained, the final bias-corrected estimators ofF◦ and Λ◦i are
given by
ˆ
FEupBC =
√
TPˆ( ˆβEupBC,dˆEup), and
ˆ Λ0EupBC,i = FˆEupBC0 h Yi−XiβˆEupBC i /T2, respectively.
Note that the main difference between our approach and the methodology of Bai et al. (2009) consists in the fact that our estimation procedure directly incorporates a dimen-sion estimate. We show in Theorem 1 that our final estimator ˆβEupBC has an asymptotic
distribution centered around zero and that ˆdEup and ˆFEupBC provide respectively
con-sistent estimators of the true dimensiondand the true factors F◦ (up to rotation).
Theorem 1.7. Under assumptions 1-3, we have, as(N, T)→ ∞,
a) P( ˆdEup = d) → 1, if the starting estimate dmax ≥ d and g is of the form g =
cpN T such that (i) c = OP(1) and strictly positive, (ii) pN T → ∞, and (iii)
log log(T)
T pN T →0,
b) with the additional Assumption 4,
Σ1c/2 √
N T( ˆβEupBC −β◦)−→d N(0, Ip),
c) and for some (d×d) invertible matrix H,
1 T T X t=1 kFbEupBC,t−Ft◦Hk2 =OP( 1 N) +OP( 1 T).
Assumption 4 is given in the appendix and required only for consistency ofφ. Examples of pN T can be found in Bai (2004).
Remark 1.8. Note that conditions (ii) and (iii) in Theorem 1.7 are sufficient only to consistently estimate the number of I(1) factors. If we assume the presence of additional I(0) factors, we have to choose g such that (ii) min{N, T}pN T → ∞ and (iii) pN T →
0; however, some suitable regularity assumptions are required to forbid strong forms of dependency and heteroscedasticity in the errors. For more details, we refer to the argumentation of Bai and Ng (2002) and Bai et al. (2009) in Section 3.3.
A consistent estimator ˆΣc of Σc is also defined in the appendix. This allows us to test
for the significance of ˆβEupBC.
The bias-corrected estimators of the pre-eliminated effectsµtandαktcan be respectively
obtained by: ˆ µBC,t = Y.t−X.tβˆEupBC and ˆ αBC,kt = Ykt−XktβˆEupBC −µˆBC,t. (1.20) Under our assumptions, it is easy to show that ˆαktis
√
mkconsistent and has an
asymp-totic normal distribution, such that √
mk( ˆαBC,kt−αkt)
d
Chapter 1. Panel Models with Unknown Number of Unobserved Factors 21
whereσ2kt=V ar(¯εkt), with ¯εkt= m1
k
PN
i δikεit.
1.4
Monte Carlo Simulations
The goal of this section is to compare, through Monte Carlo experiments, the perfor-mance of our algorithmic extension with the perforperfor-mance of the iterative least squares estimators of Bai (2009) and Bai et al. (2009) based on an externally estimated dimen-sion. In a first step, the feasible slope estimator, ˆβ(d), is naively calculated with a high number of factors (dmax= 8). In a second step, we calculate ˆWit=Yit−Xitβ(dˆ max) and
externally estimate the factor dimension by using 5 different criteria: the panel criteria PC1 and IC1 of Bai and Ng (2002), the panel cointegration criterion IPC1 proposed by Bai (2004), the threshold criterion ED of Onatski (2010), and the information criterion IC1;Tn of Hallin and Liˇska (2007). The maximal number of factors used in PC1, IC1, IPC1, ED, andIC1;Tnis also set to 8. The calibration strategy of Hallin and Liˇska (2007) (second ”‘stability interval”’ procedure) is applied on a grid interval of length 128 with the borders 0.01 and 3 as they have suggested. Finally, we re-calculate the two-step iter-ative least squares estimator with the optimizers of these panel criteria. The estimated dimensions are denoted by ˆdP C1,dˆIC1,dˆIP C1,dˆED, and ˆdICT
1,n, respectively.
Our entirely updated estimator is calculated with the penalty of PC1 as described in Section 1.2, i.e., g(ˆσEup) = ˆσEup2 log(N T /(N +T))(N +T)/N T. The iteration process
is initiated by the starting values described in Section 1.2.2. The bias correction used for estimating panel cointegration models is based on the linearly decreasing weights of Newey and West (1987) with a truncation at
j
min{√N ,√T}k. The maximal number of iterations allowed for the feasible iterated least squares estimators and the two-step estimators is 100. The inner iteration of the entirely updated estimator is also limited to 100.
We consider panel models of the form
Yit = P X p=1 Xpitβp+c d X l=1 λilflt+it,
for all i∈ {1, . . . , N} andt∈ {1, . . . , T}, whereXpit are the observed regressors,flt are
the factors to be estimated,λil are the corresponding loading parameters, ccontrols for
the weight of the factor structure in the model, and it is the idiosyncratic error term.
DGP1 (panel cointegration model with I(1) factors and endogenous explanatory vari-ables). d = 2, P = 1, β1 = 1.5, c = 1, flt = fl,t−1 +ηlt, λil ∼ N(1,1), l = 1,2, X1it=X1i,t−1+ζ1it,with ζ1it η1t η2t it ∼N 0 0 0 0 , 1 −0.5 0.7 0.7 −0.5 1 0 −0.5 0.7 0 1 0.7 0.7 −0.5 0.7 1 ;
DGP2 (panel cointegration model with mixed I(1)/I(0) factors). d = 3, P = 1, β1 =
1.5, c = 1, flt = fl,t−1+ηlt, l = 1,2, f3t =
√
0.5f3,t−1+η3t, λil ∼N(1,1), l =
1,2,3, X1it=X1i,t−1+ζ1it withηlt, ζ1it, it∼N(0,1),forl= 1,2,3;
DGP3 (the observed regressors are the underlying factors). c= 0, P = 1, β1= 1.5, d=
1, f1t=f1,t−1+η1t, λi1∼N(1,1), X1it=λi1f1t+ζ1it,andη1t, ζ1it, it∼N(0,1);
DGP4 (stationary factors and weakly autocorrelated idiosyncratic errors). d = 1, P = 1, β1 = −0.75, c= 1, f1t =
√
0.5f1,t−1+η1t, λi1 ∼N(1,1), X1it = 0.8λi1f1t+
ζ1it, it=θii,t−1+εit, η1t, ζ1it, εit∼N(0,1),and θi ∼U(−0.3,0.3);
DGP5 (stationary factors and strongly autocorrelated idiosyncratic errors). d= 1, P = 1, β1 = −0.75, c= 1, f1t =
√
0.5f1,t−1+η1t, λi1 ∼N(1,1), X1it = 0.8λi1f1t+
ζ1it, it=θii,t−1+εit, η1t, ζ1it, εit∼N(0,1),and θi ∼U(0.6,0.8); and
DGP6 (no factor structure and strongly autocorrelated idiosyncratic errors). d= 0, P = 1, β1 =−0.75, c= 0, it=θii,t−1+εit, X1it, εit∼N(0,1),and θi ∼U(0.6,0.8).
To see how the properties of the estimators vary withN and T, we consider 9 different combinations with the sizesN = 30,60,120 andT = 30,60,120. For DGP2, we consider the extra combination (N, T) = (120,300) to see how the criteria behave with the problem of unproportional factors, which occurs in mixed I(1)/I(0) factor models because the variance of I(1) factors diverge, asT → ∞, whereas the variance of the I(0) factors is bounded. This attitude of mixed I(1)/I(0) factors is closely related to the concept of weak/strong factors discussed in Onatski (2012) and Onatski (2009).
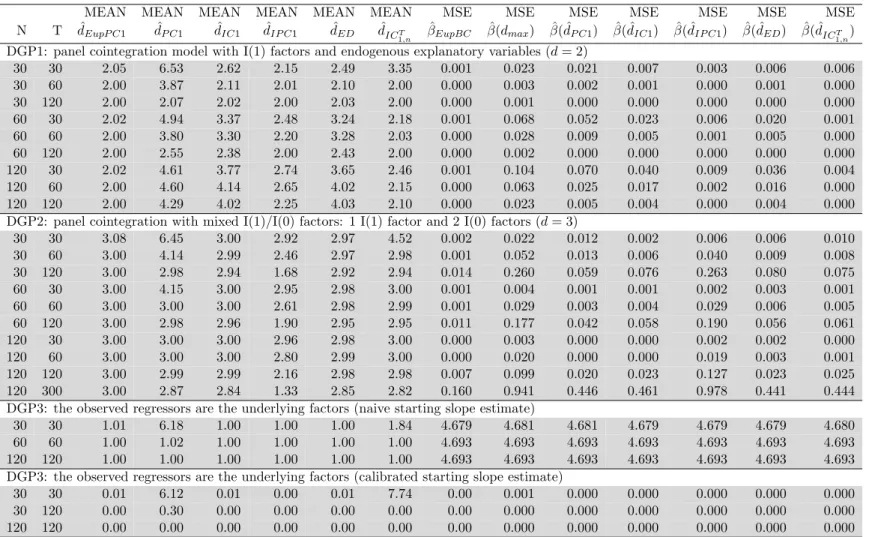
Tables 1.1 and 1.2 report the averages of the estimated dimensions and the mean squared errors (MSE) of the slope estimators obtained from 1000 replications. It is clear that the Eup estimator outperforms the feasible estimator ˆβ(dmax) in all cases. This result is
not surprising, since ˆβ(dmax) requires the computation of (dmax−dˆEup)N T additional
parameters comparing to ˆβEup. Moreover, the number of times the Eup algorithm
did not converge within the total of 54000 repetitions is remarkably smaller than the number of times the conventional feasible estimator ˆβ(dmax) did not converge (5.41% vs.
Chapter 1. Panel Models with Unknown Number of Unobserved Factors 23
42.22%). The reason for this outcome is that the naive over-specification of the factor dimension downgrades the degree of freedom available to estimate the slope parameters. The alternation between inner and outer iterations, in our algorithm, seems, hence, to provide a way to stabilize the numerical optimization of the objective function if d is not well-specified.
Tables 1.1 and 1.2 reveal that PC1 has a tendency to overestimate the true dimension if N and/or T are not large enough (30, 60). This is also the case for IPC1 when the factors to be estimated are I(1). The IC1 criterion seems to be more robust than PC1. This is because the penalty of IC1 is less sensitive to the scaling effect; see Bai and Ng (2002). The results of our Monte Carlo experiments show that integrating the penalty term of P C1 in the objective function and calibrating the hight of the penalization as described in Section 1.2 provides a gain over the original PC1, IC1, and IPC1.
DGP1 (I(1) factors and endogenous explanatory variables) The simulation results for DGP1 (reported in the first part of Table 1.1) show that ˆdEupP C1 gives a
very precise estimation of the factor dimension and outperforms PC1, IPC1, IC1, ED, and IC1T,n. In contrast to all other criteria, ED gets worse as N and T increase. This weakness can be related to the strong endogeneity of the explanatory variables. For (N, T) = (120,120), the MSEs of ˆβEupBC,β( ˆˆ dIP C1), and ˆβ( ˆdIC1T
1,n) converge to 0. This
is not surprising since our estimation strategy and the original method of Bai et al. (2009) used with dmax ≥d(or with a consistent external dimensionality criterion) will
produce very close outcomes in terms of MSE when both N and T are large enough. The problem, of course, is that the required sizes of N and T ensuring such evidence are unknown in practice. Note also that the outcomes of ˆβ( ˆdIP C1) are conditional on
dmax = 8 and ˆβ( ˆdIP C1) can be used only when the d static factors are not driven by
the lags of a smaller number of dynamic factors. Such limitations are overcome by our method.
DGP2 (mixed I(1)/I(0) factors) The results of this experiment are reported in the second part of Table 1.1. The best estimation is obtained with ˆdEupP C1. IPC1 has a
tendency to overestimate the true number of I(1) factors, especially when N increases and T is fixed. In contrast, ED and ICT
1,n behave properly in such a case. Otherwise,
both ED and IC1T,n get slowly worse as T increases and N is fixed (( ˆdED,dˆICT
1,n) =
(2.99,3),(2.98,2.98),(2.85,82) for (N, T) = (120,60),(120,120), and (120,300) respec-tively). PC1 and IC1 also show a tendency to underestimate the factor dimension. The reason these criteria estimate, on average, a smaller dimension than ˆdEupP C1 (although
ˆ
dEupP C1 is obtained by strengthening iteratively the same penalty) is that the
(N, T) = (120,120) and (120,300). Unexpectedly, when (N, T) = (120,300), the MSEs of allβ estimators are larger than those obtained with smaller sample sizes. This result can be explained by the occurrence of two effects whenN is fixed andTis relatively large: the first effect is related to the problem of mixed strong/weak factors, which can lead to underestimate the number of I(0) factors since the proportion of the variance explained by the I(1) factors gets much larger than the proportion of the variance explained by the I(0) factors when T grows faster thanN. Indeed, the worst MSE affiliates with IPC1, which has, on average, the smallest estimate for d when N = 120 and T = 300; the second effect is related to the inefficiency of estimating a bias that does not exist since the factors and the regressors are exogenous in DGP2. Recall that the bias estimator is the average ofN individual bias estimates and converges proportionally toN.
DGP3 (the observed regressor is the underlying factor) The last two parts of Table 1.1 present the estimation results of DGP3 obtained by initiating the iterations with two different starting estimates ofβ: the first estimate is ˆβstartexpressed in (1.13);
the second estimate is obtained by scaling the factors Gl, l = 1, . . . , dmax in (1.13)
with (1−rG2
l,X1)
0.5, where r
Gl,X1 is the sample correlation coefficient between Gl and
X1i, as described Section 1.2.2. The goal of examining DGP3 is only to test whether
the calibration of the starting factors Gl in (1.13) will enhance the effectiveness of the
estimation algorithm to correctly specify the model. The answer that can be deciphered from the table is: Yes!
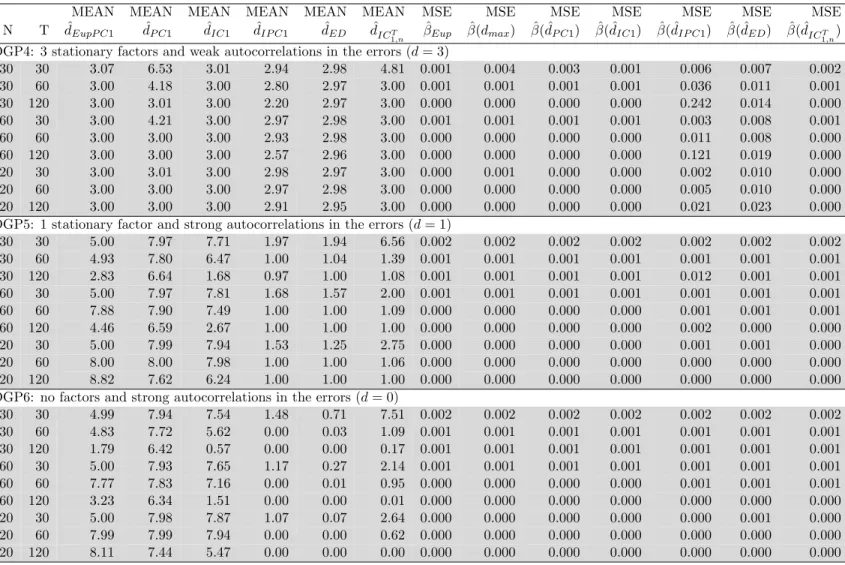
DGP4-6 (stationary panels with weak/strong autocorrelated errors) Table 1.2 reveals that there is at least one case, where ED and IC1T,n estimators outperform
ˆ
dEupP C1. In fact, strong autocorrelations in the idiosyncratic errors (DGP4 and DGP6)
seem to inflate the number of factors obtained by using the penalty of Bai and Ng (2002). IPC1 seems to work well for DGP4 and DGP6 (except for N = T = 30), although theoretically this criterion is only appropriate for detecting integrated factors. The explanation of this outcome could lie in the penalty term of IPC1, which is, by construction, higher than the penalty of PC1 and IC1. The ED criterion also seems to be robust against the problem of high autocorrelated idiosyncratic errors, even if the autocorrelation coefficients are individual specific. IC1T,n is based on the spectral density decomposition of the (disturbed) factor structure and is expected to be the most appropriate criterion for these cases. Our estimator ˆdEupP C1 behaves similarly to ˆdP C1
for DGP5 and DGP6. Both estimators have a tendency to select the largest possible dimension in the interval of the run parameter, i.e., min{√N ,√T}for ˆdEupP C1and 8 for
ˆ
dP C1. This result is in line with the simulation results of Onatski (2010) and
Chapter 1. Panel Models with Unknown Number of Unobserved Factors 25
idiosyncratic errors is large (e.g., ≥0.7). In fact, Assumption C in Bai and Ng (2002) forbid strong forms of correlation and heteroskedasticity in the error term. The Monte Carlo experiments of Bai and Ng (2002) consider only cases in which the correlation coefficient is smaller or equal to 0.5. Note that such a limitation is not necessary if the factors are I(1). This is because we can replace a= 1 with a= T /(4 log logT) in the penalty term. The latter will diverge with N and T and dominate asymptotically any Op(1) structure in the idiosyncratic errors.
Finally, we want to emphasize that the goal of estimating panel models with unobserved common factors is not only to assess the dimension of the factor structure but also to efficiently estimate the slope parameters. Inspection of the MSE values reported in the second and third part of Table 1.2 shows that ˆβEup does not suffer from an
over-parameterization effect when the errors are strongly autocorrelated and the factors are over estimated. The additional factors seem to compensate for the unparameterized linear dependency in the idiosyncratic term. From the second and third part of Table 1.2, we can see that, for (N, T) = (60,60), the MSE of ˆβEupis smaller than the MSEs of
ˆ
β( ˆdIP C1), ˆβ( ˆdED), and ˆβ( ˆdICT
1,n). The first part of Table 1.2 shows that all criteria
be-have very well when the autocorrelation in the idiosyncratic errors is weak, in particular, ˆ
dEupP C1, ˆdIC1, and ˆdICT
1,n.
The Monte Carlo experiments show that, in many configurations of the data, our algo-rithmic refinement provides more efficient estimates in terms of MSE for the estimator of β than those that can be achieved if the feasible iterative least squares estimator is calculated with an externally selected factor dimension. Moreover, our results show that the iterative calibration of the penalty term makes the criteria of Bai and Ng (2002) more robust in a practical context, especially when N and/or T are small. If the id-iosyncratic errors are strongly autocorrelated, the number of stationary factors will be overestimated but without affecting the efficiency of the slope estimator.
MEAN MEAN MEAN MEAN MEAN MEAN MSE MSE MSE MSE MSE MSE MSE N T dˆEupP C1 dˆP C1 dˆIC1 dˆIP C1 dˆED dˆICT 1,n ˆ βEupBC βˆ(dmax) βˆ( ˆdP C1) βˆ( ˆdIC1) βˆ( ˆdIP C1) βˆ( ˆdED) βˆ( ˆdICT 1,n)
DGP1: panel cointegration model with I(1) factors and endogenous explanatory variables (d= 2)
30 30 2.05 6.53 2.62 2.15 2.49 3.35 0.001 0.023 0.021 0.007 0.003 0.006 0.006 30 60 2.00 3.87 2.11 2.01 2.10 2.00 0.000 0.003 0.002 0.001 0.000 0.001 0.000 30 120 2.00 2.07 2.02 2.00 2.03 2.00 0.000 0.001 0.000 0.000 0.000 0.000 0.000 60 30 2.02 4.94 3.37 2.48 3.24 2.18 0.001 0.068 0.052 0.023 0.006 0.020 0.001 60 60 2.00 3.80 3.30 2.20 3.28 2.03 0.000 0.028 0.009 0.005 0.001 0.005 0.000 60 120 2.00 2.55 2.38 2.00 2.43 2.00 0.000 0.002 0.000 0.000 0.000 0.000 0.000 120 30 2.02 4.61 3.77 2.74 3.65 2.46 0.001 0.104 0.070 0.040 0.009 0.036 0.004 120 60 2.00 4.60 4.14 2.65 4.02 2.15 0.000 0.063 0.025 0.017 0.002 0.016 0.000 120 120 2.00 4.29 4.02 2.25 4.03 2.10 0.000 0.023 0.005 0.004 0.000 0.004 0.000 DGP2: panel cointegration with mixed I(1)/I(0) factors: 1 I(1) factor and 2 I(0) factors (d= 3)
30 30 3.08 6.45 3.00 2.92 2.97 4.52 0.002 0.022 0.012 0.002 0.006 0.006 0.010 30 60 3.00 4.14 2.99 2.46 2.97 2.98 0.001 0.052 0.013 0.006 0.040 0.009 0.008 30 120 3.00 2.98 2.94 1.68 2.92 2.94 0.014 0.260 0.059 0.076 0.263 0.080 0.075 60 30 3.00 4.15 3.00 2.95 2.98 3.00 0.001 0.004 0.001 0.001 0.002 0.003 0.001 60 60 3.00 3.00 3.00 2.61 2.98 2.99 0.001 0.029 0.003 0.004 0.029 0.006 0.005 60 120 3.00 2.98 2.96 1.90 2.95 2.95 0.011 0.177 0.042 0.058 0.190 0.056 0.061 120 30 3.00 3.00 3.00 2.96 2.98 3.00 0.000 0.003 0.000 0.000 0.002 0.002 0.000 120 60 3.00 3.00 3.00 2.80 2.99 3.00 0.000 0.020 0.000 0.000 0.019 0.003 0.001 120 120 3.00 2.99 2.99 2.16 2.98 2.98 0.007 0.099 0.020 0.023 0.127 0.023 0.025 120 300 3.00 2.87 2.84 1.33 2.85 2.82 0.160 0.941 0.446 0.461 0.978 0.441 0.444 DGP3: the observed regressors are the underlying factors (naive starting slope estimate)
30 30 1.01 6.18 1.00 1.00 1.00 1.84 4.679 4.681 4.681 4.679 4.679 4.679 4.680 60 60 1.00 1.02 1.00 1.00 1.00 1.00 4.693 4.693 4.693 4.693 4.693 4.693 4.693 120 120 1.00 1.00 1.00 1.00 1.00 1.00 4.693 4.693 4.693 4.693 4.693 4.693 4.693 DGP3: the observed regressors are the underlying factors (calibrated starting slope estimate)
30 30 0.01 6.12 0.01 0.00 0.01 7.74 0.00 0.001 0.000 0.000 0.000 0.000 0.000 30 120 0.00 0.30 0.00 0.00 0.00 0.00 0.00 0.000 0.000 0.000 0.000 0.000 0.000 120 120 0.00 0.00 0.00 0.00 0.00 0.00 0.00 0.000 0.000 0.000 0.000 0.000 0.000
Table 1.1: Simulation results for DGP1 - DGP3. The entries are the averages of the estimated dimensions and the MSEs of the slope estimator