Evaluation of Anomaly Detection Techniques for
SCADA Communication Resilience
Syed Noorulhassan Shirazi
1, Antonios Gouglidis
1, Kanza Noor Syeda
2, Steven Simpson
1, Andreas Mauthe
1Ioannis M. Stephanakis
3and David Hutchison
11InfoLab21, School of Computing and Communications, Lancaster University, LA1 4WA, UK
Email:{n.shirazi, a.gouglidis, s.simpson, a.mauthe, d.hutchison}@lancaster.ac.uk
2Department of Entrepreneurship, Strategy & Innovation, Lancaster University Management School, LA1 4YX, UK
Email:[email protected]
3OTE (Hellenic Telecom Organization), 99 Kifissias Avenue, GR-151 24, Athens, Greece
Email:[email protected]
Abstract—Attacks on critical infrastructures’ Supervisory Control and Data Acquisition (SCADA) systems are beginning to increase. They are often initiated by highly skilled attackers, who are capable of deploying sophisticated attacks to exfiltrate data or even to cause physical damage. In this paper, we rehearse the rationale for protecting against cyber attacks and evaluate a set of Anomaly Detection (AD) techniques in detecting attacks by analysing traffic captured in a SCADA network. For this purpose, we have implemented a tool chain with a reference im-plementation of various state-of-the-art AD techniques to detect attacks, which manifest themselves as anomalies. Specifically, in order to evaluate the AD techniques, we apply our tool chain on a dataset created from a gas pipeline SCADA system in Mississippi State University’s lab, which include artefacts of both normal operations and cyber attack scenarios. Our evaluation elaborate on several performance metrics of the examined AD techniques such as precision; recall; accuracy; F-score and G-score. The results indicate that detection rate may change significantly when considering various attack types and different detections modes (i.e., supervised and unsupervised), and also provide indications that there is a need for a robust, and preferably real-time AD technique to introduce resilience in critical infrastructures.
Index Terms—Communication networks, critical infrastruc-ture protection, resilience, anomaly detection, SCADA systems
I. INTRODUCTION
Attacks on critical infrastructures have increased over the years. In particular, attacks targeting Supervisory Control and Data Acquisition (SCADA) industrial control systems rose 100% in 2014 compared to the previous year as highlighted in a report by Dell [1]. Similarly, a recent report published by the industrial control systems cyber emergency response team (ICS-CERT) showed that while industrial control system (ICS) vendors have been targeted by various types of malicious actors, over half of the attacks reported in 2014 involved advanced persistent threats (APTs) [2]. Moreover, major vul-nerabilities in SCADA systems enabled attacks on various critical infrastructures in the past, which demonstrated that
This work is sponsored by UK-EPSRC funded TI3 project, grant agree-ment no. EP/L026015/1: A Situation-aware Information Infrastructure; and the European Union under Grant SEC-2013.2.5-4: Protection systems for utility networks – Capability Project, Project Number: 608090, Hybrid Risk Management for Utility Providers (HyRiM).
these systems are not resilient as one would expect. Stuxnet [3] was firstly identified as a complex malware that targeted the SCADA systems on Iran’s nuclear plant. In Maroochi, Australia a disgruntled engineer penetrated a sewage control system and caused approximately 264,000 gallons of raw sewage leak to nearby rivers [4]. Also, in late 2015, a major attack on Ukraine’s power grid infrastructure resulted on a power outage caused by the BlackEnergy trojan [5].
SCADA systems monitor and control infrastructures includ-ing power plants, water utility, energy and gas pipelines, which makes them highly critical. Providing protection in terms of security, safety and resilience in such networks is inherently considered to be of a vital importance. Traditionally, most of these systems were air gaped from other networks, but in sev-eral cases, access to these devices may be still available over a public network (e.g., Internet) as a requirement to improve usability via providing operators the potential to remotely access of devices. While the automation and interconnectivity contribute to increase the efficiency and reduce operations costs, they expose these systems to new threats. For instance, the potential existence of a vulnerability in a system on the top layers of the Purdue model [6] may allow attackers to exploit them and to gradually take control of systems or devices that operate in the lower levels, such as SCADA systems; this could cause failure and hence serious disruptions.
Therefore, it is crucial that any challenge to the SCADA systems and supporting communications infrastructure is promptly detected and acted upon. To do this it is necessary to detect a range of challenges, including those that manifest themselves as anomalies. For example, data injection attacks may be used to change measurement values of some devices, in order to hinder the operation of the system [7]. Further, a major concern is the intrinsic weakness of communica-tion protocols used in SCADA systems that monitor and control field devices in critical infrastructure installations. The remote terminal units (RTUs) interface, which generally control and collect information that determine the system state and master terminal units (MTUs) which handles the supervisory controls, can also be attacked to spoof information by exploiting the lack of authentication provided by current
protocols (e.g., Modbus, DNP3 and Profibus) and lead to unexpected behaviours [8]. Recent research has focused on anomaly detection (AD) techniques to improve the resilience and security of critical infrastructures [9], [10], [11]. In the context of SCADA systems, a few anomaly detection tech-niques have been adopted and redefined [12], [13], [14] and they are further classified with respect to their operational mode, i.e., supervised and unsupervised. However, choosing an appropriate technique for use with SCADA systems requires the examination of their effectiveness in detecting anomalous SCADA operations, e.g., traffic between RTU and MTU. From an operational perspective, supervised techniques require training data to build the model and evaluate the fitness of the new test data with respect to this model. On the other hand, unsupervised techniques try to partition the feature spaces into normal and anomalous regions without training data, and AD techniques in this mode are much more flexible and easy to use since they do not require upfront human intervention and training [15], [16].
The main goal of this paper is to pinpoint the importance of AD techniques as a step towards achieving resilience; evaluate AD techniques in the context of SCADA systems and discuss their advantages and disadvantages. Specifically, we evaluate the K-means (KM)1 and Na¨ıve Bayesian (NB)2 techniques that are used in supervised mode, and the Principal Component Analysis using Singular Value Decomposition (PCA-SVD)3 and Gaussian Mixture Model (GMM)4 that are used in unsupervised mode to analyse network transactions between RTU and MTU from Mississippi State Universitys in-house SCADA gas pipeline.
The rest of the paper is organised as follows: Section II elaborates on our resilience strategy and its association with AD techniques. Section III discusses the experimental method and the properties of the dataset we have used. Section IV describes the outcomes of our analysis and discusses the obtained results, while section V summarises and concludes the paper.
II. RESILIENCE ANDANOMALYDETECTION
In this section, we briefly elaborate on our resilience strat-egy and how anomaly detection may serve as an important component to apply resilience in critical infrastructures. We define resilience as ”the ability of a network or system to provide and maintain an acceptable level of service in the face of various faults and challenges to normal operation” [17]. The D2R2+DR strategy is capable of achieving the afore-mentioned via the Defend, Detect, Remediate, Recover, and Diagnose and Refine processes (see Figure 1). Defend, Detect, Remediate, and Recover consist processes of an internal loop process and Diagnose and Refine processes of an outer loop. In more detail, it is: Defend against challenges and threats to normal operation; Detect when an adverse event or condition
1https://en.wikipedia.org/wiki/K-means clustering 2http://scikit-learn.org/stable/modules/naive bayes.html 3https://en.wikipedia.org/wiki/Principal component analysis 4http://scikit-learn.org/stable/modules/mixture.html
has occurred; Remediate the effects of the adverse event or condition; Recover to original and normal operations; Diag-nose the fault that was the root cause; and Refine behaviour for the future based on pastD2R2+DR cycles.
Anomaly detection is a technique that can be applied within a resilience framework in order to promptly provide indica-tions and warnings about adverse events or condiindica-tions that may occur. Specifically, we demonstrate in [10] a resilience framework for critical infrastructures that may support the detection of anomalies at the different levels of infrastruc-ture and services. Therefore, a first step towards achieving resilience consist the identification of abnormal behaviours in such environments. This can be accomplished within the detection process of our resilience strategy, where several resilience metrics are collected and forwarded to AD instances. The diverse nature of data in critical infrastructures’ networks compared with data stemming from IT systems, and the existence of major threats such as APTs render the task of evaluating existing AD techniques to be of vital importance. The evaluation of them will provide indications for the ap-plicability of them in environments as the examined one, and initiate future research in that direction.
Dia gnos e R ef in e De fend Dete ct R e m ed ia te Re co v e r Fig. 1:D2R2+DRstrategy [17] III. METHOD
The approach we have taken to evaluate the AD techniques is described bellow:
• Obtain the most significant features from the original dataset via pre-processing methods (discussed below). Our approach include the normalization and principal component analysis of the dataset. These features are then converted into a time series and fed into a detector implementing the AD techniques.
• We further split the dataset into 8 different traces. The first one consists of a combined trace, which includes the class of normal data and seven anomalous classes. The rest of the seven traces include each the normal class and one of anomalous classes. The latter is used to evaluate the efficacy of the individual techniques to detect specific type of anomalies.
• Each trace is then submitted to a detector along with ground truth information to assess the applied AD tech-nique based on its likelihood to identify anomalies in the traces over time. Depending on their mode, AD
techniques may require a training phase (e.g., supervised learning). In this case, a random selection of the feature vector is used as training data, and the rest is used to generate the anomaly time series used for the evaluation.
• The output of the detector that includes a time series of probabilities is then compared with the ground truth, and yields an evaluation of the AD techniques.
More details with regard to the dataset and each of the aforementioned steps are provided in subsequent subsections.
A. Dataset
The dataset we used was collected using a simulation of real anomalies and normal activity on a gas pipeline. Specifically, it constitutes Modbus traffic5 stemming from a serial line and
including read and write commands for a PLC6. It contains
three categorical features including payload information, net-work information and ground truth. The payload information indicates the gas pipeline’s state, settings and parameters. The network information provides pattern of communications and ground truth details, i.e., if the transaction is normal or anomalous. In total 274627 instances and twenty raw features are provided. We refer the reader to [18], [19] for a detailed description of the individual features, dataset and test bed architecture that was used to capture the data.
We first employ a pre-processing stage, which includes normalization of data using Z-score7and principal component
analysis (PCA) to select a subset of relevant features for subse-quent analysis. The PCA allow us to extract new, orthogonal (independent) features that are a linear combination of the original ones. Basically, these new set of features are called principal components and obtained in such a manner that the first principal component accounts for as much as possible of the variation in the original data then the second component and so on. We select 14 principal components as new derived features for our analysis because they represent most variation in original dataset, therefore they are most significant.
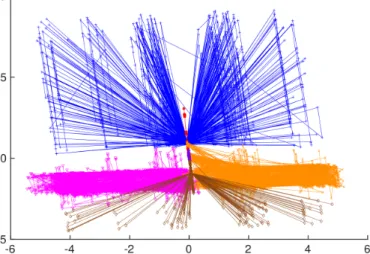
Furthermore, we employ soft clustering approach using Fuzzy C-means (FCM) [20] to identify natural groupings of data. As oppose to hard clustering, in FCM the data points can belong to more than one cluster, and association with each of the points are membership grades that indicate the degree to which the data points belong to the different cluster. Figure 2 illustrates the inherent structure of the data. It can be seen that the data is not easily separable into 8 classes, but instead it separates them into 4 classes where blue color indicates the normal class. This is an important step in understanding the dataset with respect to the number of classes.
B. Description of Anomalies
In total, the dataset contains seven different type of anoma-lies that are divided into four main categories. These anomaanoma-lies
5http://www.modbus.org/
6https://en.wikipedia.org/wiki/Programmable logic controller
7The result of Z-score normalization is that the features will be rescaled
so that they will have the properties of a standard normal distribution with
µ = 0andσ = 1, where µis the mean (average) and σis the standard deviation from the mean.
Fig. 2: Identification of anomalies using FCM with K=8
include ”response injection”, ”reconnaissance”, ”denial-of-service” and ”command injection”. The response injection is further divided into na¨ıve malicious response injection (NMRI) and complex malicious response injection (CMRI). The former leverage the ability to inject response packets in the network but lack information about the process being monitored. The latter on the other hand are more sophisticated and attempt to mask the real state of the physical process being controlled. Similarly, the command injection is further divided into malicious state command injection (MSCI), malicious parameter command injection (MPCI) and malicious function code command injection (MFCI). MSCI change the state of the process control system to drive the system from safe state to critical state by malicious command. MPCI change PLC set points and MFCI injects command which misuse protocol network parameter. DoS attack target communication link. Each sample is labelled with its ground truth from (0-7) where 0 represents normal class and 1-7 is for each class of anomalies.
C. Evaluation Metrics
A single metric alone is not sufficient to make a firm conclu-sion about performance of the underlying anomaly detection technique [21]. Therefore, we evaluated the effectiveness of each technique using several metrics. Each input entry sub-mitted to the detector describes the features of the monitored trace during a given time period (bin), and subsequently the detector computes the deviation from normal traffic. Therefore, the performance can be assessed by determining the difference between the class it produces for a given input and the class it should have. Correctly identified negatives are true negatives (TN), incorrectly identified negatives are false positives (FP), correctly identified positives are true positives (TP) and incor-rectly identified positives are false negatives (FN). From this output it allows computation of the true-positive rate (TPR, sensitivity or recall;TP/(TP+FN)), the false-positive rate (FPR;FP/(FP+FN)), the precision (TP/(TP+FP)), the accuracy (TP +TN/TP +TN +FP +FN), the F-score
Anomaly types
NMRI CMRI MSCI MPCI MFCI DoS Recon
Precision (%) 0 0.2 0.4 0.6 0.8 1
K-Means NB PCA-SVD EMGM
(a) Precision comparison of ADTs for individual anomaly types
Anomaly types
NMRI CMRI MSCI MPCI MFCI DoS Recon
Accuracy (%) 0 0.2 0.4 0.6 0.8 1
K-Means NB PCA-SVD EMGM
(b) Accuracy comparison of AD techniques for individual anomaly types
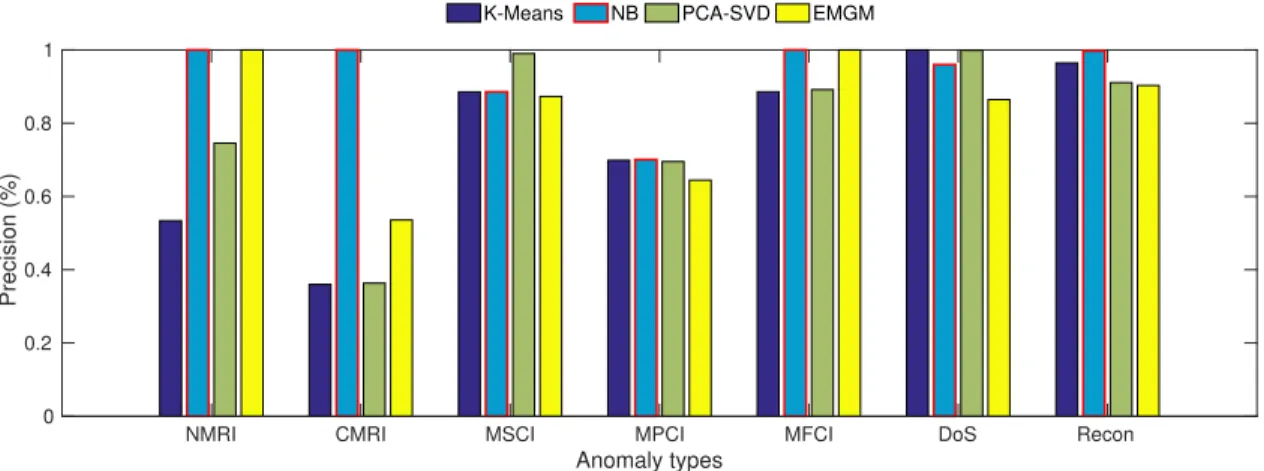
Fig. 3: Performance comparison of AD techniques
(2× (Precision ×Recall) / (Precision+Recall)), and the G-mean (√Precision×Recall). Accuracy is the degree to which the detector classifies data samples correctly; precision is a measure of how many of the positive classifications are correct, i.e., the probability that a detected anomaly has been correctly classified; and recall is a measure of the detector’s ability to correctly identify an anomaly, i.e., the probability that an anomalous sample will be correctly detected. The final two metrics are the harmonic mean (F-score) and geometric mean (G-mean), which provide a more rounded measure of the performance of a particular detector by accounting for all of the outcomes to some degree.
IV. ANALYSIS OFRESULTS
One of the main issues with the raw dataset was that it con-tained missing values, and thus, required from us to perform a set of pre-processing tasks in order to make the dataset suitable for use in our AD implementations. Otherwise, the results of the analysis would not be indicative of the actual performance of the examined AD techniques. Specifically, we pre-process the raw dataset by applying Z-score and principal component analysis techniques such that it remains representative of the
TABLE I: Comparison of AD techniques (combined dataset)
Method ADT Recall Precision Accuracy F-score G-mean
Supervised K-means 0.5728 0.8319 0.5680 0.6751 0.6874 NB 0.7692 0.8195 0.9036 0.8595 0.8605 Un-supervised PCA-SVD 0.2796 0.6472 0.1714 0.2710 0.3331 GMM 0.4416 0.7309 0.4516 0.5583 0.5745
original data, particularly the scope of attack scenarios, while being better suited to use with AD techniques. Henceforth, we call this new derived feature-set as combined dataset since it contains artefacts of the normal data and all seven types of anomalies. Subsequently, we used the combined dataset as an input to our AD implementations. However, some of the operations regarding AD techniques required an excessive amount of time and memory to complete due to the size of the combined dataset (275,000 rows). Therefore, in order to
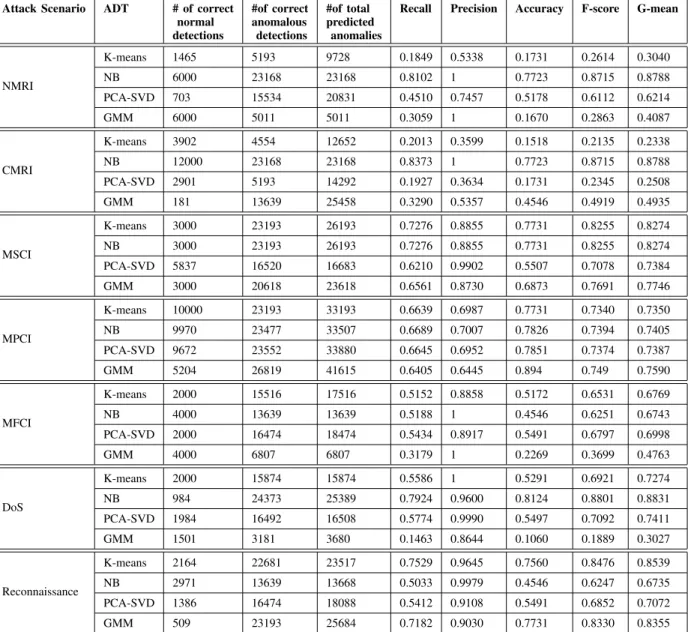
TABLE II: Performance metrics of AD techniques per type of anomaly
Attack Scenario ADT # of correct normal detections #of correct anomalous detections #of total predicted anomalies
Recall Precision Accuracy F-score G-mean
NMRI K-means 1465 5193 9728 0.1849 0.5338 0.1731 0.2614 0.3040 NB 6000 23168 23168 0.8102 1 0.7723 0.8715 0.8788 PCA-SVD 703 15534 20831 0.4510 0.7457 0.5178 0.6112 0.6214 GMM 6000 5011 5011 0.3059 1 0.1670 0.2863 0.4087 CMRI K-means 3902 4554 12652 0.2013 0.3599 0.1518 0.2135 0.2338 NB 12000 23168 23168 0.8373 1 0.7723 0.8715 0.8788 PCA-SVD 2901 5193 14292 0.1927 0.3634 0.1731 0.2345 0.2508 GMM 181 13639 25458 0.3290 0.5357 0.4546 0.4919 0.4935 MSCI K-means 3000 23193 26193 0.7276 0.8855 0.7731 0.8255 0.8274 NB 3000 23193 26193 0.7276 0.8855 0.7731 0.8255 0.8274 PCA-SVD 5837 16520 16683 0.6210 0.9902 0.5507 0.7078 0.7384 GMM 3000 20618 23618 0.6561 0.8730 0.6873 0.7691 0.7746 MPCI K-means 10000 23193 33193 0.6639 0.6987 0.7731 0.7340 0.7350 NB 9970 23477 33507 0.6689 0.7007 0.7826 0.7394 0.7405 PCA-SVD 9672 23552 33880 0.6645 0.6952 0.7851 0.7374 0.7387 GMM 5204 26819 41615 0.6405 0.6445 0.894 0.749 0.7590 MFCI K-means 2000 15516 17516 0.5152 0.8858 0.5172 0.6531 0.6769 NB 4000 13639 13639 0.5188 1 0.4546 0.6251 0.6743 PCA-SVD 2000 16474 18474 0.5434 0.8917 0.5491 0.6797 0.6998 GMM 4000 6807 6807 0.3179 1 0.2269 0.3699 0.4763 DoS K-means 2000 15874 15874 0.5586 1 0.5291 0.6921 0.7274 NB 984 24373 25389 0.7924 0.9600 0.8124 0.8801 0.8831 PCA-SVD 1984 16492 16508 0.5774 0.9990 0.5497 0.7092 0.7411 GMM 1501 3181 3680 0.1463 0.8644 0.1060 0.1889 0.3027 Reconnaissance K-means 2164 22681 23517 0.7529 0.9645 0.7560 0.8476 0.8539 NB 2971 13639 13668 0.5033 0.9979 0.4546 0.6247 0.6735 PCA-SVD 1386 16474 18088 0.5412 0.9108 0.5491 0.6852 0.7072 GMM 509 23193 25684 0.7182 0.9030 0.7731 0.8330 0.8355
overcome the time and memory constraints, we shuffled the data in the combined dataset and selected a subset of it (30%) to perform the training of supervised AD techniques.
Table I depict the results of the binary classification for the combined dataset. Basically, in this approach all anomalous classes are combined into a single anomaly class to be discrim-inated from the normal communications. Both the precision and accuracy results indicate that the supervised techniques (KM and NB) perform better in classifying anomalies when compared with the unsupervised techniques (PCA-SVD and GMM). Specifically, the PCA-SVD becomes less accurate in detecting anomalies since it manages to accomplish only 17% of accuracy. On the contrary, the NB technique shows both a high precision and accuracy level, i.e., 81% and 90%, respectively.
In order to further investigate the performance of the AD techniques in identifying the individual attacks, we created
a separate set of a datasets. Each dataset included normal data and data from one of the anomalies. The benefit of this separation is that there are much more samples of a given attack in each subset compared with the combined dataset, as well as a higher degree of variability within the features. Each dataset is then used as an input to the detector. All datasets were run with the selected four AD techniques. Figure 3a and Figure 3b illustrates the precision and accuracy for each technique in detecting individual categories of anomalies, respectively. The results show that all techniques produced high precision for individual categories with one exception -that of response injection attacks. However, when it comes to accuracy, the NB and KM outperform other techniques, having both a level of accuracy and precision over 80%. These results are similar to what we have seen for a combined dataset.
Table II list the output metrics for each type of anomalies and shows that the supervised techniques have become less
accurate in detecting individual type of anomalies. From these results, it is strongly implied that there is a skewing of results when running the detector with no prior training. The issue lies within the nature of the supervised technique considering each sample to be individual entities to be labelled as anomalous, whereas there could be many samples corresponding to a single anomaly to be classified. Given the discrete nature of attacks, certain features can also be removed to improve the accuracy in supervised mode given the fact that certain features are more revealing about attack than others. However, the feature selection and their analysis is beyond the scope of this work.
An examination of the precision and recall results reveals the exact anomaly types that are being classified incorrectly. The precision rate for denial-of-service, reconnaissance, MFCI and MSCI is over 80%. But for NMRI and CMRI, they are below the acceptable level. Furthermore, some attack types such as MFCI are detected with low recall rate and high precision. This is related to the fact that the samples considered to be these types of anomalies were indeed from these categories, but suffered in detecting all samples that were from each type of an attack. This could be due to a bad value in a network transaction such as an incorrect CRC value in a write function command, which would cause the RTU to ignore the command and in turn may cause a denial-of-service. The result also shows that the recall is lowest for the MPCI and MSCI. The low recall lies in the fact that the system is forced to be placed in normal conditions at the time of anomaly injection, hence, very close similarity between normal and anomalous conditions for these types of attacks.
V. CONCLUSION
In this work, the performance of various AD techniques applied to SCADA communication is evaluated in terms of their ability to identify various attacks. We have analysed the communication between an RTU and MTU in a gas pipeline system. The data in our evaluation were developed by the Mississippi State University, and include artefacts of benign RTU transactions and various attack transactions generated specifically for conducting research in the area of critical infrastructures protection. We have analysed the accuracy of four AD techniques in correctly identifying anomalies using a set of statistical features. Results from our experiments indicate that detection rate differs with respect to the type of the anomaly and the running mode of the applied AD technique. Specifically, AD techniques that run in supervised mode appeared to perform better; however, a dataset to train a technique is not always possible to have. Therefore, we argue that there is a need for developing a robust, and preferably real-time AD technique that can work in unsupervised mode and have a better detection accuracy. The configuration modes, normalization techniques, etc. are yet more variables to con-sider when it comes to apply them operationally.
In the future, we will investigate how to realise anomaly de-tection in an online manner for SCADA systems. Furthermore, we will investigate the performance benefits of data sampling,
so that very large data volumes can be processed in near real-time.
ACKNOWLEDGMENTS
The authors would like to thank T. Morris and the Missis-sippi State University SCADA Laboratory for providing the dataset.
REFERENCES
[1] Dell, “Dell Annual Security Threat Report 2015,” https://software.dell. com/docs/2015-dell-security-annual-threat-report-white-paper-15657. pdf, 2015.
[2] National Cybersecurity and Communications Integration Center, “ICS-CERT Monitor,” https://ics-cert.us-cert.gov/sites/default/files/Monitors/ ICS-CERT Monitor Sep2014-Feb2015.pdf, 2015.
[3] N. Falliere, L. O. Murchu, and E. Chien, “W32. stuxnet dossier,”White paper, Symantec Corp., Security Response, vol. 5, 2011.
[4] J. Slay and M. Miller,Lessons learned from the maroochy water breach. Springer, 2007.
[5] ESET, “The security review: BlackEnergy, Internet Explorer and Fitbit,” http://www.welivesecurity.com/2016/01/18/ security-review-blackenergy-internet-explorer-fitbit/#, 2016.
[6] L. Obregon, “Secure Architecture for Industrial Control Systems,” https://www.sans.org/reading-room/whitepapers/ICS/ secure-architecture-industrial-control-systems-36327, 2015.
[7] P.-Y. Chen, S.-M. Cheng, and K.-C. Chen, “Smart attacks in smart grid communication networks,”Communications Magazine, IEEE, vol. 50, no. 8, pp. 24–29, 2012.
[8] A. Carcano, I. N. Fovino, M. Masera, and A. Trombetta, “Scada malware, a proof of concept,” in Critical Information Infrastructure Security. Springer, 2008, pp. 211–222.
[9] S. Shirazi, S. Simpson, A. Marnerides, M. Watson, A. Mauthe, and D. Hutchison, “Assessing the impact of intra-cloud live migration on anomaly detection,” inCloud Networking (CloudNet), 2014 IEEE 3rd International Conference on, Oct 2014, pp. 52–57.
[10] A. Gouglidis, S. Shirazi, S. Simpson, P. Smith, and D. Hutchison, “A multi-level collaborative framework for critical infrastructures re-silience,” 2016.
[11] A. K. Marnerides, P. Smith, A. Schaeffer-Filho, and A. Mauthe, “Power consumption profiling using energy time-frequency distributions in smart grids,”Communications Letters, IEEE, vol. 19, no. 1, pp. 46–49, 2015. [12] W. Gao, T. Morris, B. Reaves, and D. Richey, “On scada control system command and response injection and intrusion detection,” in eCrime Researchers Summit (eCrime), 2010. IEEE, 2010, pp. 1–9.
[13] I. Marton, A. S´anchezb, S. Carlosa, and S. Martorella, “Application of data driven methods for condition monitoring maintenance,” CHEMI-CAL ENGINEERING, vol. 33, pp. 301–306, 2013.
[14] E. Damiani, “Composite intrusion detection in process control net-works,” 2009.
[15] P. Laskov, P. D¨ussel, C. Sch¨afer, and K. Rieck, “Learning intrusion de-tection: supervised or unsupervised?” inImage Analysis and Processing– ICIAP 2005. Springer, 2005, pp. 50–57.
[16] V. Chandola, A. Banerjee, and V. Kumar, “Anomaly detection: A survey,”
ACM Computing Surveys (CSUR), vol. 41, no. 3, p. 15, 2009. [17] J. P. Sterbenz, D. Hutchison, E. K. C¸ etinkaya, A. Jabbar, J. P. Rohrer,
M. Sch¨oller, and P. Smith, “Resilience and survivability in commu-nication networks: Strategies, principles, and survey of disciplines,”
Computer Networks, vol. 54, no. 8, pp. 1245–1265, 2010.
[18] T. H. Morris, Z. Thornton, and I. Turnipseed, “Industrial control system simulation and data logging for intrusion detection system research.” [19] T. Morris and W. Gao, “Industrial control system traffic data sets for
intrusion detection research,” inCritical Infrastructure Protection VIII. Springer, 2014, pp. 65–78.
[20] J. C. Bezdek, R. Ehrlich, and W. Full, “Fcm: The fuzzy c-means clustering algorithm,” Computers & Geosciences, vol. 10, no. 2, pp. 191–203, 1984.
[21] A. Lazarevic, L. Ert¨oz, V. Kumar, A. Ozgur, and J. Srivastava, “A comparative study of anomaly detection schemes in network intrusion detection.” inSDM. SIAM, 2003, pp. 25–36.