Procedia Computer Science 55 ( 2015 ) 650 – 659
1877-0509 © 2015 Published by Elsevier B.V. This is an open access article under the CC BY-NC-ND license (http://creativecommons.org/licenses/by-nc-nd/4.0/).
Peer-review under responsibility of the Organizing Committee of ITQM 2015 doi: 10.1016/j.procs.2015.07.063
ScienceDirect
Information Technology and Quantitative Management (ITQM 2015)
Augmented visualization for data-mining models
Wilson Castillo Rojas
a*, Fernando Medina Quispe
a, Claudio Meneses Villegas
baArturo Prat University, Av. Arturo Prat 2120, Iquique, Chili bNorth Catholic University, Av. Angamos 0610, Antofagasta, Chili Abstract
This paper proposes a scheme called Augmented Model Visualization for Data Mining (AMV-DM), based on models of visual perception and interaction to represent and operate with data mining models. The scheme has at its core the use of complementary visualizations applied to data-mining (DM) model during the adjustment phase. These complementary views correspond to: a second descriptive technique of data mining, and an appropriate set of graphical artifacts. Defined metrics that measure the distance and similarity of components of a model and allow visual perception empirically data-analyst. AMV-DM is implemented through a prototype visual environment. As a case study explores a decision tree model and each of its nodes. Apply Self-Organizing Map technique on the decision tree (DT) model with a set of graphical artifacts. Two controlled experiments were carried out with 30 users. Preliminary results analysis allows obtaining empirical evidence of the usefulness of the proposed scheme.
© 2015 The Authors. Published by Elsevier B.V.
Selection and/or peer-review under responsibility of the organizers of ITQM 2015
Keywords: Schemes of visualization, visualization of models for data-mining, visualization for data-mining, data-mining models;
1.Introduction
Visualization has been applied in a limited way in the DM process focused primarily data (input) and results (output). It argues that integrated generation and model fit visualizations could help: improve it, understand it, and produce better results.
Nomenclature
DM Data Mining
DT Decision Tree
* Corresponding author. Tel.: +56-998-845-621; fax: +56-572-526-403. E-mail address: [email protected].
© 2015 Published by Elsevier B.V. This is an open access article under the CC BY-NC-ND license (http://creativecommons.org/licenses/by-nc-nd/4.0/).
SOM Self-Organizing Map
VA Visual Analytics
The utility of a DM model depends mainly on two factors: (1) the model's ability to discover interesting patterns, and (2) the ease with which the model structure can be understood and modified by users and data-analysts. For this, appropriate visualizations applied to the models can transform them into understandable tools that convert data into patterns and finally knowledge.
The research objective is to create new visualization schemes for DM models. Schemes that efficiently support the visual exploration stage model refinement. The idea is to combine DM techniques with complementary views. Also, to provide the user with visual elements that can be applied on subsets of data associated with the components of the model, and use appropriate interaction mechanisms that allow you to navigate on this model and explore each of its components.
This paper describes a schema called Augmented Model Visualization Data Mining (AMV-D M), from its definition, architecture and formalizing its entirety as the first stage is proposed. As a second step, this scheme is instantiated by implementing a prototype software tool, and then your application is illustrated with a case study. In this scheme it’s possible to obtain a "visually augmented model" which allows us to understand its inner workings and thus contribute to a better understanding and credibility about the obtained model. It’s presented and discussed as a case study a DT model visually increased with SOM technique.
Finally, results of a subjective evaluation are discussed of the proposed approach through the development of a controlled experiment, which involves capturing the perception of a group of users/data-analysts. Users in the experiment used the prototype software to perform a defined DM task. This enabled capture information about performance, usability, visualization and management support in understanding the DM model.
2. Visualization in Data Mining
Visualization is increasingly being incorporated in the DM process, as a tool to support user interactions and components involved. However, none of the existing process models (Adriaans and Zantinge [1] and Brachman et al. [3] and Fayyad et al. [5] and John [7]) incorporate and discuss the role of visualization in the DM cycle. Meneses and Grinstein [9] discuss elements to move towards a scheme of DM process with support for displaying four types of entities: data, parameter space DM algorithms, induced models and patterns validation.
Most of the visualization work has focused on display data. In DM data generated models (enumeration of patterns) also need to be understood and related data and process results. However, little work has been done to visualize patterns induced by machine learning algorithms and statistical entities (e.g., confusion matrix, cost matrix) in a richer way that only present the topology model or list results applying the model to a data set.
Data visualization supports the interaction between users/data-analysts and data sets involved in DM process. For example, visualization can be used to obtain a preliminary understanding of the data and refine the initial objectives and tasks defined by the user in the problem formulation phase. Several techniques have been proposed to visualize massive data. Some of these techniques are limited to dealing with data sets of low dimensionality (e.g., scatterplots), while others focus on datasets of high dimensionality (e.g., parallel coordinates, iconographic representations, radial visualizations, faces Chernoff [4]). Keim [8] provides a comprehensive taxonomy of visual techniques to explore massive datasets, while Hoffman [6] outlined a categorization of visual techniques for DM tasks.
Supports the model visualization and interaction with the understanding model induced from a training data set for a data-mining algorithm (Thearling et al. [10]). These views should provide a natural way to understand the structure, components, and complexity of a model. Also, visual representations provide a direct way to compare various models and allow the use of human visual perception to formulate new hypotheses and conclusions about the model and its relation to the data. Views of models have been incorporated in some
software tools for data analysis in DM. Becker [2] proposes a simple display Bayes classifier, DT and decision tables, and implemented as part of the SGI-MineSet tool. Meneses and Grinstein [9] developed visualizations for neural networks and Kohonen maps models, and alternative views for simple Bayes classifier and DT models, and implemented in a software platform developed for experimental purposes.
The display patterns validation refers to the display of results of applying a DM model induced in dataset for validation or test Thearling et al. [10] and Humphrey et al. [11]. In the case of predictive models, these results are commonly given as error rates or a confusion matrix. In this case, display may be used to support the interpretation of the results of validation of patterns, and to provide visual feedback to correlate these results with data, parameters, and used to generate models. For descriptive models, visual validation of patterns can be used to support the interpretation and evaluation, as well as a visual inspection of results.
A key factor in improving the predictive or descriptive capacity of a DM model is to understand how the induced model is actually working to make decisions. Among other aspects, for example interested in understanding how the model partitions the set of input data according to different attributes of data, how the components of the model are correlated with a subset of observations, and how the space of attribute values is partitioned by the model. Some machine learning techniques operate as closed systems, where it’s difficult to achieve an interpretation of the patterns obtained and answer user questions about the transformation that takes the model. A notable example is the artificial neural networks, which converge to a set of numerical weights that have no direct interpretation in the problem domain.
Techniques such as DT can only be understood when the model is small, larger trees (more than four levels) have a more complex interpretation. Other learning schemes, such as predictive and associative rules, also present problems model size (long lists of rules) and the development of new compact graphics, allowing better understanding and interacting with them is required. Today, there are few tools that incorporate models visualization (Keim et al. [13] and Castillo et al. [17]).
3. Visual Perception Models in DM
The field of Visual Analytics (VA) described by Keim et al. [13], focuses on the process of analyzing and managing large volumes of data (heterogeneous and dynamic), by integration of human judgment on visual representations interaction techniques. The VA combines display areas, DM and statistics. In VA, visualization is central to the process and not only the means to communicate the values of the data or test results, but is increasingly used to monitor processes of other disciplines such as data management and DM. VA process is characterized by the interaction between data, displays, data on models, and users to discover new knowledge. The first stage is collecting data that may come from heterogeneous data sources that need to be integrated before applying any method of analysis. After data transformation analyst applies a visualization technique or a method of automated analysis, which may include technical mathematics, statistics and DM.
Liu and Salvendy [14] proposed the Conceptual Model for Interactive Visualization of DM Models (VIMMD). This model proposes a generic framework to build a schema for the interactive visualization and analysis models, as well as evaluation of models. Actions taken by both the computer and the user are detailed, and in both cases associated with a logic related interaction with the construction and evaluation of a DM model, i.e. does not take the previous phases (preparation and processing data) and later (acquisition of knowledge). This model is more specific than the one proposed by Keim et al. [13]. It specifies actions undertaken by both the machine and the user associated with logic of interaction related to the construction and evaluation of DM model are detailed. That is, this model does not take the previous phases (preparation and processing of data) and later (acquisition of knowledge). Therefore, it focuses on the various steps required to achieve an appropriate model for DM task, proposing the inclusion of visualization for data, models, and single
or multiple assessment models. This model provides the mechanisms of interaction for the user to better approximate the appropriate model, allowing active role in the process of building the DM model.
Vitiello and Kalawsky [12] propose a model that integrates the VA stream based on a way to prepare, and subsequent generation of knowledge evolved from making decisions from research naturalistic (Klein [15] and Klein [19]). The key aspect of the scheme of this model is that it relates pattern recognition through a workflow. It may look like a mind map where user interaction with visualizations and DM techniques allows, through the development of senses; generate visual perception in the individual which eventually becomes the acquired knowledge or pattern recognition.
These models pose as a common basis:
x The important role that display throughout the DM process. This reaffirms the importance of
implementing views from exploration data to support the construction and visualization of models to obtain knowledge by applying visualization to the resulting patterns, all within an iterative process.
x The combination of DM techniques recommended by some authors (Keim et al. [13] and Liu and
Salvendy [14] and Castillo et al. [16] and Castillo et al. [17]) as a useful tool in the analysis of the model in its construction phase and adjustment.
x These models provide a reference framework for the implementation of views in the construction phase of
the DM model. However, do not provide a detailed specification regarding the models, and do not focus on the use of mechanisms of interaction for the user.
4. AMV-DM Scheme
The proposed scheme is called Augmented Model Visualization for DM (AMV-DM). The AMV-DM scheme incorporates the concept of DM model "visually increased." This AMV-DM approach takes an overview of the visualization process proposed in Keim et al. [13], phases, and detailed actions proposed in Liu and Salvendy [14] model interactions, and finally the framework for sense-making incorporating VA, specifically formalization mechanism posed proposed in Vitiello and Kalawsky [12] model.
Corresponds to an approach that considers central themes:
- Display for exploratory analysis of DM models. - Interaction mechanisms.
- Models of visual perception. - Combining DM techniques.
- Metrics for comparing the model components analyzed. 4.1.Architecture & Components
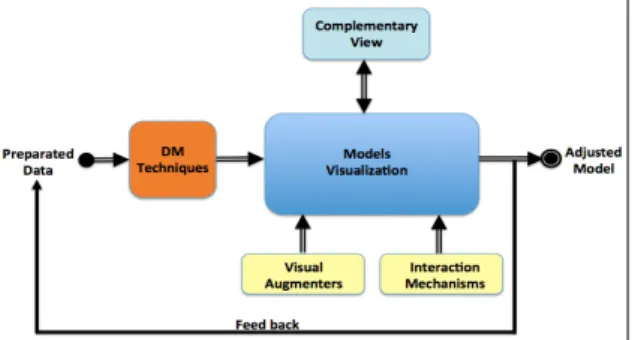
A model of visual perception and user interaction, focused on adjusting step model of a DM process, and provides a way to explore the original model and each of its components is proposed. Defined under the premises recently, AMV-DM architecture scheme is represented generally in Figure 1.
The different components of the architecture are:
Prepared data (d): considers as input dataset (d) ready, i.e. minable view, so they are not considered all operations is related to engineering data, i.e.: extraction, integration, cleaning, and data transformation.
DM techniques (T): is the set of DM techniques available. A technique may have the function of primary
DM technique (PT-DM), and otherwise as secondary DM technique (ST-DM). The ST-DM should correspond to techniques of descriptive type. This suggested that a DM engine that has implemented a set of techniques.
Visual enhancers (a): the set of visual enhancers is composed of artifacts graphics (g), for example, data table, scatterplots, mosaic, histograms, pie charts and points, etc. Also considered in this set the ST-DM selected to act as a visual model explorer (m).
Models Visualization (v): the center of AMV-DM scheme is the main component and corresponds to the
workspace that displays the model (m) generated from a selected PT-DM. This module is applied to the model (m) different visual (a) enhancers, whether artifacts graphics (g) and ST-DM. It’s also the area where the data analyst can interact with the model (m) and components for exploration, travel and analysis using interaction mechanisms (i) required and available for this.
Interaction Mechanisms (i): a set of actions available to the data-analyst to interact with the model (m) and its components.
Complementary views (v'): correspond to views generated through visual (a) enhancers (graphical
artifacts (g) and ST-DM), for observing the model (m) and each of its components, achieving visually increase the DM model (m') generated PT-DM.
Adjusted Model (m’): corresponds to the DM model (m) obtained through the sequence of iterations and
interactions with complementary views (v). This allows the data-analyst to explore the model (m) original and its components, and adjust to the requirements of DM task.
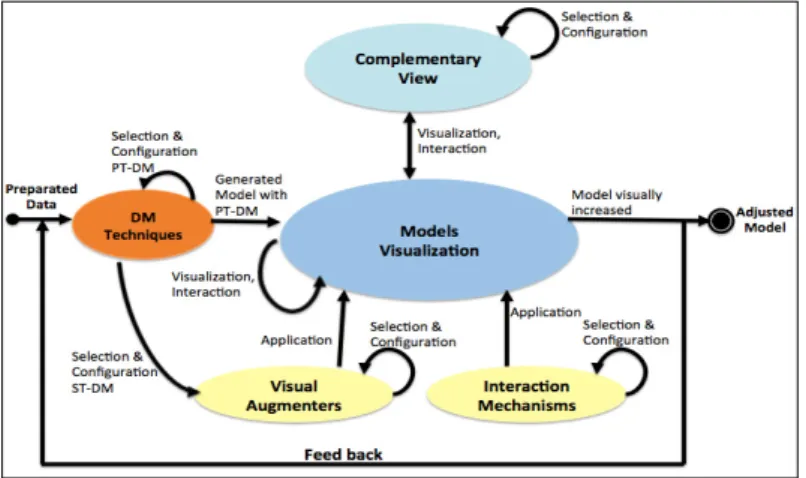
In Figure 2 the actions and interactions that users can perform are added.
Fig. 2. Actions defined.
Where each of the actions implemented is directed towards a particular component and may come indirectly from another, which is indicated by the direction of each arrow. If corresponds to an output action, prosecution or entrance to a component. An arrow represents the form of interaction and its direction determines its origin and destination.
This process is defined as a cycle that allows feedback in the exploration stage, analysis and adjustment of DM model. The result is a "visually augmented model", which allows the data-analyst, has more model analysis tools. This means being able to adjust the model and better understand it’s functioning, and by extension better interprets the final model. Once established the components, actions and interactions of
AMV-DM scheme, the formal specification of the process is done, starting each state to identify and specify actions associated with each component.
Formally:
x ܨͳሺ݀ǡ ݐሻ ՜ ݉Ǣ Given a set of data d, a model m with a primary technique tp is generated.
x ܨʹሺ݉ǡ ݒሺܽሻǡ ݅ሻ ՜ ݉ǯǢThen the model m generated and its components are applied with visual enhancers v (a secondary technique ts and ad-hoc graphical artifacts g). For this interaction mechanisms required i.
And a visually augmented model m’ is obtained as a result.
Where: i) ܽ ൌ ݐݏ ݃Ǣ the assembly formed by the visual augmenters ts and g.
ii) F1 and F2 correspond to the main functions.
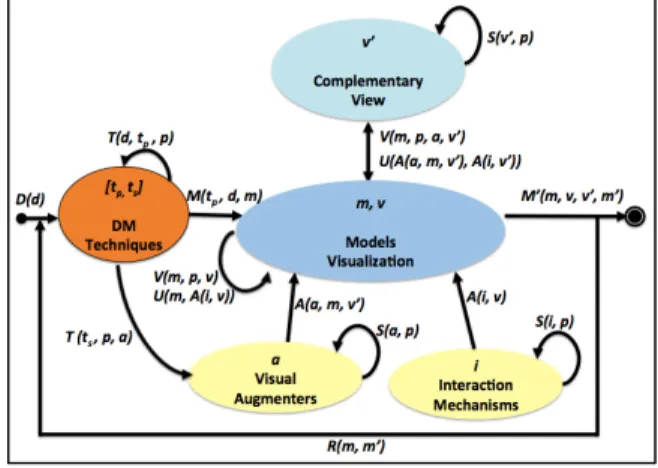
The formal specification for the AMV-DM scheme is illustrated in Figure 3, and functions, which in turn represent the actions, and interactions that can be performed in various components of the scheme, accompanied each of their respective variables.
Fig. 3. Formal specification.
This aims to support the following activities of DM process, specifically set stage model: x Allow the data-analyst to explore the model m in all its parts.
x Data-analyst can get a better understanding of the model m, in terms of: function, components,
distribution of instances, comparing components, and processing it performs. Potentially allow him to respond chords DM task that performs generic questions.
x Set of views v(a) applied to the model m achieve increased expressiveness of the model and support
their visual analysis.
x Get a "visually augmented model" called m'.
x The data-analyst can achieve better understand the inner workings of m model so provide;
o On the one hand, to a better understanding of the model m, o And secondly, to greater credibility of this model.
In Figure 3, the ovals collect the inputs and generate outputs of these containers. Arrows indicate the process functions ܲሺݔሻ where ݔ א ൛ܽǡ ݀ǡ ݅ǡ ݉ǡ ݉ǯǡ ǡ ݒǡ ݒǯǡ ݐǡ ݐ௦ൟǤ
4.2.Quantitative Metrics
Because the focus of this work is focused on the visual exploration of DM models, you need to add to this metric framework permit: 1) To characterize model components using metrics, and 2) To compare components of a model using metrics based on the distance between components, e.g.: intra-component average distance, minimum inter-component distance, etc.
Metrics that are generally used in clustering methods to determine the similarity between two objects, if each component as a group of instances associated generated by the technical rules is considered. For example: homogeneity or dispersion associated with each component. Minkowski metrics for calculating the Euclidean distance is selected, and Pearson correlation measure for the similarity formally specified in [20]. The objective is to have a metric to compare quantitatively form two components of a visual information based on model. For this two types of metrics to provide the data analyst indicators calculated automatically defined below. The shape of this comparison is based on quantitative measures: Distance and Similarity.
These metrics have been selected using as criteria the scope of this research, which considers data-mining techniques to generate models with rule-based structures. The case study corresponds to DM models generated by the DT is combined with the SOM technique defined as a secondary technique in the primary technique proposed scheme. For the calculation of distance and similarity metrics first is obtained for each component (nodes) their respective SOM maps, and each neuron of these maps are applied these metrics.
5. Case Study: Decision Tree
One of the key problems of DM techniques is its visual representation and understanding the inner workings of the model for the user/analyst, which in the case of DT is more complex for: large trees, dataset to be analyzed has a high dimensionality, and due their hierarchical structure characteristic.
For technical DT, most visual representations discussed, proposed a normal form hierarchical dendrogram at a static display, without the possibility that the user/analyst can interact with each one of the nodes of the tree. Most revised DM visual tools, although they deliver general tree information along with the associated confusion matrix, do not allow combining DM techniques to provide information beyond the rules of the model and instances at each node, such as information about data dispersal and spatial distribution at each node, much less provide user interaction mechanisms, in order to browse, select and explore each tree component or node.
Using SOM technique applied to a DT as a visual enhancer has a dual purpose: spatial partition of the subset of data associated with each tree node, and display of this partition using a map. In addition, the SOM technique is appropriate to the domain of the data handled by the DT, and to describe their distribution in each node. This allows a comparison between nodes and thus determining those with similar distribution or large differentiation, through the specification of the distance, the number of instances located over or under the centroid of a grid map.
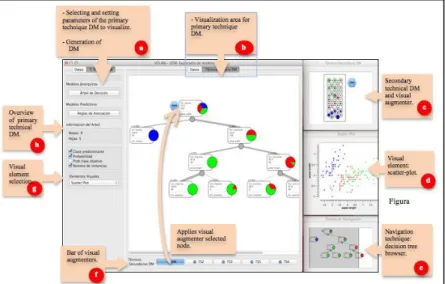
Figure 4 shows an overview of the experimental prototype main interface, which displays a DT in the center, with additional views and visual elements on the right:
a) Selecting and setting parameters of the PT-DM to visualize and generation of a DM model, in this section the user can select the dataset to be analyzed, and then display some characteristics (e.g.: number of instances, type and number of attributes). Also, the user can select the primary technique of DM. Then, once configured with the PT-DM parameters selected, users can run this algorithm in order to generate the DM model. b) Visualization area of the primary technique DM. This is the main work area which shows an overview of the selected PT-DM, and where users can interact (browse, explore and select) with each node of the tree. c) Secondary technique DM as a visual augmenter. In this area, the minimized view of the ST-DM is showed and user can select and apply it to the PT-DM. The user can to maximize the view, allowing changing its settings. For this work, the SOM technique has been considered as visual augmenter ST-DM. d) Visual element. In this area are deployed visual elements selected beforehand. In this area, a scatter plot of the selected node can be observed. e) Navigation technique. It corresponds to a browser of the PT-DM, and allows the user to have the guidance of the area or level where is crossing the DT. f) Visual augmenter bar. It lies at the bottom of the tool working area and provides a set of visual augmenters or ST-DM techniques. g) Selection of visual elements. In this section the user has an appropriate set of graphical artifacts, which can select, configure and apply to the PT-DM. Within the set of visual available elements are: histogram, mosaic and scatter-plots. h) Overview of the PT-DM. Generic information for PT-DM, number of nodes and leaves in the DT are shown.
For each selected node, including the root node, the user can apply SOM to visualize the distribution of the items on the tree nodes, which also provides user interaction elements to change the type of map background color and the type of class, the chart type of each item on the map, to select the type of class to color in the representation, and select the test or training set for visualization.
6. Evaluation & Results Analysis
To estimate the practical value of the characteristics defined in the AMV-DM scheme was carried out controlled to obtain a subjective perception of the usefulness of the scheme to apply visual enhancers on a DM model experiment. This requires a DM task, consisting in generating a DT model induced from a previously prepared data was designed.
6.1. Controlled Experiment
This experiment was performed with a universe of 30 people with different levels of experience in processes and DM tools as basis of comparison used the WEKA software online. The reasons for choosing this tool are essentially two: the experience in the software of the participants, and WEKA has implemented an approach similar to that rose by the AMV-DM scheme visualization.
Thus, the controlled experiment was aimed developed:
x Qualitatively estimate the utility that provides the combination and application of a "visual augmenter" on the components of a generated model.
x Get a characterization of the level of effectiveness of the prototype visual environment on the contributions offered by applying complementary views to a DM model previously generated.
x Check empirically the assumption that the elements equipped with AMV-DM provides schema users
achieve better understand the DM model, applying to each of its elements complementary views obtained with secondary technical or graphical artifacts available prototype environment.
Subsequently, once the DM task, participants must answer a survey designed to capture their subjective judgments regarding the performance of both tools. In particular, about managing the display of generated model, usability and usefulness of the visual elements provided to perform the task, degree of convenience to
combine and apply the ST-DM model generated by a PT-DM achieving a visually model increased and the level of support provided to develop an understanding of the generated model.
The survey contains 28 questions designed and is divided into three sections: a) General aspects in data-analysis, b) Using DM tools, and c) Using the prototype tool and the WEKA software. The details of this survey and the results of its application in this controlled experiment are summarized in [18].
6.2. Results Analysis
All the surveyed participants agree that the use of descriptive data techniques and the nature and understanding of these is key for a successful DM process. An important factor to consider is the previous experience that users have with the different DM tools existed today. The results showed that 100% of participants had previous experience with using the WEKA software.
The experience of developing a DM task using the AMV-DM software prototype was well received by users, from the point of view of usability and performance of this tool, showing 100% of them this tool and its elements allowed them to find some kind of relationship between the attributes of the dataset. Compared with the WEKA software, prevails a great assessment of the degree of usefulness of the options and parameters that provides the prototype software, to understand the generated model. 83.3% of participants considered high and only 20% considered it regularly.
The subjective perception of the usefulness of the set of views provided by the prototype visual environment is high for 69.2% of participants overall and very high at 15.4%. This allows us to affirm that most of the participants had a positive assessment of the views provided to analyze the DM model. The ability to describe the data model in a component DT using a ST-DM (SOM in this case), high perception was about 90%. The degree of acceptance of the prototype software as experience of participants with other DM tools was high in general and only 9% of respondents considered this aspect enough. Regarding the metric, these were applied to the same DT model used by participants, and could be empirically the degree of closeness/remoteness of components analyzed and their level of similarity.
7. Conclusions & Future Work
We conclude that the AMV-DM approach provides:
x A framework that serves as a guide for the development of displays that integrate different elements of
visual analytics for DM models. These are: combination of DM techniques or what is known as hybrid DM, graphics artifacts ad-hoc, and interaction mechanisms that allow travel the model and its components.
x Locate the user data-analyst in the center of the exploration stage and visual analysis of DM model,
considering their expertise and visual perceptual abilities to identify and model fit.
x Provides tools for exploring a DM model: first views, ad-hoc through the use of visual perception achieve
an analysis of qualitative/subjective type. Second, metric (distance and similarity) than through empirical assessment allows obtaining quantitative/target components on the comparison of model analysis. Both tools are complementary to the analyst or data miner.
x Finally, controlled experiments conducted with 30 users to validate the AMV-DM approach, reporting that
their way of working with the elements described, support the analysis and understanding of DT model. This is reflected in the results of the surveys.
With regard to future work, this is related to the following:
x Select additional artifacts graphics that may be more useful in exploring data for each component,
preferably in dataset with high dimensionality.
x Explore and evaluate the possibility of combining other DM techniques, such as visually increase generated
x Deepen aspects of visual perception, exploring other techniques such as texture analysis, use of glyphs, etc.
x Evaluate the use and implementation of additional metrics that provide the comparison of models and
components. 8. References
[1] Adriaans P, Zantinge D. Data Mining. Nueva Delhi, India, Pearson Education. 1996.
[2] Becker B, Kohavi R, Sommerfield D. Visualizing the Simple Bayesian Classifier. In Proceedings of the KDD-97 Workshop on Issues in the Integration of Data Mining and Data Visualization, 1997. Springer-Verlag.
[3] Brachman R, Anad T. The Process of Knowledge Discovery in Databases. In Advances in Knowledge Discovery and Data Mining, 1996. AAAI Press/ The MIT Press, pp. 37-57.
[4] Chernoff H. The Use of Faces to Represent Points in k-dimensional Space Graphically. Journal of the American Statistical Association. 1973, Vol. 68, No. 342, pp. 361-368.
[5] Fayyad U, Piatestky-Shapiro G, Smyth P. The KDD Process for Extracting Useful Knowledge from Volumes of Data. Comm. Of the ACM, 1996, vol. 39, No. 11, pp. 27-34.
[6] Hoffman P. Table Visualizations: A Formal Model and its Applications. Sc.D. Thesis, Massachusetts University. 1999. [7] John G. Enhancements to the Data Mining Process. Doctoral Dissertation, Depart. Of Comp. Science, Stanford University. 1997. [8] Keim D. Visual Techniques for Exploring Databases. Tutorial Notes in the Third International Conference on Knowledge Discovery
and Data Mining, KDD-97. Newport Beach, CA. 1997.
[9] Meneses C, Grinstein G. Visualization for Enhancing the Data Mining Process. In Proceedings of the Data Mining and Knowledge Discovery: Theory, Tools, and Technology III Conference. Orlando, FL. 2001.
[10] Thearling K, Becker B, DeCoste D, Mawby B, Pilote M, Sommerfield D. Visualizing Data Mining Models. In Proceedings of the Integration of Data Mining and Data Visualization Workshop, Springer-Verlag. 1998.
[11] Humphrey M, Cunningham S, Witten I.. Knowledge Visualization Techniques for Machine Learning. Intelligent Data Analysis. 1998, No. 2, pp. 333-347.
[12] Vitiello P, Kalawsky Roy. Visual Analytics: A Sensemaking Framework for Systems Thinking in Systems Engineering. Systems Conference (SysCon). IEEE International. 2012, ISBN: 978-1-4673-0748-2. Page(s): 1 – 6.
[13] Keim D, Kohlhammer J, Ellis G, Mansmann F. Mastering the Information Age Solving Problems with Visual Analytics. Edited by the authors Published by the Eurographics Association Postfach 8043, 38621 Goslar, Printed in Germany, Druckhaus Thomas Müntzer GmbH, Bad Langensalza. Theoretical Issues in Ergonomics Science. 2010, vol. 8, ISBN 978-3-905673-77-7.
[14] Liu Y, Salvendy G. Visualization support to better comprehends and improves decision tree classification modelling process: a survey
and appraisal Theoretical Issues in Ergonomics Science. 2007, ISSN 1463–922X print/ISSN1464–536X.
[15] Klein G. A Recognition-Primed Decision (RPD) Model of Rapid Decision Making. Decision making in action: Models and methods. 1993, vol. 5, no. 4, pp. 138–147.
[16] Castillo W, Meneses C. Graphical Representation and Exploratory Visualization for Decision Trees in the KDD Process, XXXVIII Conferencia Latinoamericana en Informática - CLEI, Medellín-Colombia, 2012. Libro de Resúmenes página 137, ISBN IEEE Xplore: 978-1-4673-0793-2, ISBN CD: 978-1-4673-0792-5. Print ISBN: 978-1-4673-0794-9.
[17] Castillo W, Meneses C. A Comparative Review of Schemes of Multidimensional Visualization for Data Mining Techniques. III Congreso Internacional de Computación e Informática del Norte de Chile (INFONOR-CHILE). Arica – Chile. 2012.
[18] Castillo W, Meneses C, Medina F. Encuesta en línea software prototipo VOLAM-VDM, URL: https://es.surveymonkey.com/s/EncuestaVolam. 2013.
[19] Klein G, Phillips J, Rall E, Peluso D. A data-frame theory of sense making. In Expertise out of context. Proceedings of the 6th Int. Conf. on Naturalistic Decision Making. 2003, pp. 113-155.
[20] Maimon O, Rokach L. Data Mining and Knowledge Discovery Handbook, 2nd ed. Springer Science+Business Media, Inc. Edited by͒Oded Maimon and Lior Rokach͒Tel-Aviv University-Israel. 2010., ISBN 978-0-387-09822-7.