THE ECONOMIC IMPACT AND GUARANTEED PERFORMANCE
OF A TWO-PHASE SEPARATOR IN AN LNG PLANT
L'EFFET ECONOMIQUE ET LA PERFORMANCE GARANTIE D'UN
SEPARATEUR A DEUX-PHASES DANS UN CENTRE GNL
James Jordan, M.E. Mechanical Engineer
Dani Fadda, Ph.D. CFD Engineering Scientist
Peerless Mfg. Co. Dallas, Texas, U.S.A. Don Andress, M.E., M.B.A.
Licensing Engineer Phillips Petroleum Co. Bartlesville, Oklahoma, U.S.A.
ABSTRACT
The purpose of this paper is to present the separator type selection, validation and precautions used to guarantee proper separation performance prior to installing the separator. Economic considerations (price and time) of installing a liquified natural gas (LNG) plant from engineering-procurement-construction (EPC) award to turnover is also discussed.
This vertical gas separator is designed to remove low density hydrocarbon liquids from a gas stream. The designed separator is installed in a major LNG plant in the Western Hemisphere and performs with a very high level of liquid removal efficiency.
RESUME
Le but de ce document est de presenter la selection du type de séparateur, la validation et les precautions prises pour assurer la bonne performance de separation avant l=installation du séparateur. Des considerations économiques (coût et delais) de l=installation d=un centre gaz naturel liquifié (GNF) du moment du contrat jusqu=à la mise en marche sont également discutées.
Ce séparateur de gaz vertical est conçu pour enlever les liquides de hydrocarbures bas densités d=un débit de gaz. Un séparateur de cette conception est installé dans un important centre GNL dans l=hemisphère occidental et a une performance très élevée dans l=enlèvement du liquide.
LNG PLANT ECONOMICS
Base load liquefied natural gas (LNG) projects are highly complex undertakings that require huge investments of time, money, and manpower. In simplest terms, an LNG project is merely converting the lighter components (typically methane and ethane) of natural gas to a liquid in sufficient quantities and at a low enough cost such that the liquefied gas can be sold at a price to provide a satisfactory return on investment to attract participants in the project. In actuality LNG projects are highly complex and consist of several steps, each of
which has its own complexity and range of costs. A typical base load LNG project has the following components:
1) Exploration for and discovery and development of adequate natural gas reserves (associated and/or non-associated gas) to produce 5.36 to 26.79 MNm3/day (200 MMSCFD to 1 BSCFD) or more of gas inlet to the LNG manufacturing facility. 2) Installation of a gas transmission system to move the feed gas from the gas
producing field(s) to the inlet valve of the LNG plant.
3) Construction of the gas treating and liquefaction facility including LNG storage and ship loading facilities.
4) Development and investment in the LNG transportation system. Typically the transportation of large volumes of LNG has been by specially designed, ocean-going ships due to the location of the gas fields and the liquefaction plant. 5) Construction of the LNG Receiving Terminal/Re-gasification Facility.
6) Development of the market for the use of the re-gasified LNG (i.e., power generation, city gas, industrial use).
Over the years, extensive efforts such as those presented in this paper have been undertaken to drive down investment costs of LNG projects. For example, investigating liquefaction plant costs over the last thirty-five years shows that liquefaction plant capital cost estimates have decreased today to approximately $200 per annual tonne of LNG produced (Fig. 1) with further reductions anticipated. These reductions on plant costs have been realized through efforts on many fronts. Some of the most effective cost reduction efforts have been in the area of liquefaction plant costs and plant construction schedule reduction.
Fig. 1, LNG Cost (BP, 2000)
On a recent project in the Caribbean, a base load LNG plant was built, started up and turned over to the owner/operator in less than 36 months from the award of the EPC contract. Comparing the construction and start-up time for this project to previous projects (Table 1) illustrates a reduction of 12 months as compared to typical projects, and 6 months as compared to the most recent Middle East base load LNG project. Furthermore, the installed
1) Judicious liquefaction technology selection by the operator and EPC contractor. Careful liquefaction technology selection allowed the EPC contractor to competitively bid all components of the liquefaction plant from both schedule and cost aspects.
2) Extensive use of the most modern computer based tools for equipment design by both the contractor and equipment vendors. The use of these tools provided a high level of confidence that the plant was designed Afit for purpose.@ This confidence was borne out during performance testing when all performance guarantees were exceeded. Also, the use of these tools allowed equipment to be designed at minimum cost and schedule.
Table 1. Time Required from EPC Award to Turnover
LNG Plant Time (months)
Typical
Most Recent - Middle East (Hause, K., 2000) Recent Caribbean (Petroleum Economist, 1998)
48 42 36
Highly competitive economic considerations make the design of new LNG facilities extremely important. Only the most compact, fastest to implement and most economical designs are considered. The two-phase separator is an essential part of an LNG plant where space, time and cost are major factors that drive the entire plant design.
The separator presented in this paper is part of an LNG plant. The separator is a vertical vessel with two stages of separation. The vessel is compact, cost effective, of superb performance and easy to install as an integral part of the plant.
Keeping the separator as small as possible helps to keep the following costs to a minimum:
1) Fabrication cost of the separator is reduced by using less material and labor/welding costs.
2) Loading on transport at fabrication shop, unloading, loading at port of export and unloading at the plant site.
3) Land freight cost from fabrication shop to Port of Export. 4) Ocean freight cost from Port of Export to plant site. 5) Required space at plant site.
6) Separator foundation savings at plant site.
Presented in this paper are details of selecting, sizing and validating the separation performance. Flow patterns at the separator inlet are discussed. Such patterns form the basis from which separation devices (vessel internals) are selected and designed. The separation performance is validated through the most current one-dimensional and three-dimensional computational fluid dynamics (CFD) flow models.
TWO-PHASE FLOW INTO THE SEPARATOR
Understanding the two-phase flow physical state in the separator inlet gives an estimate of the separation needs under consideration. Computing the inlet flow properties is, therefore, the first and most important step in designing a critical separator, performing under severe conditions (dense gas, light liquid with low surface tension).
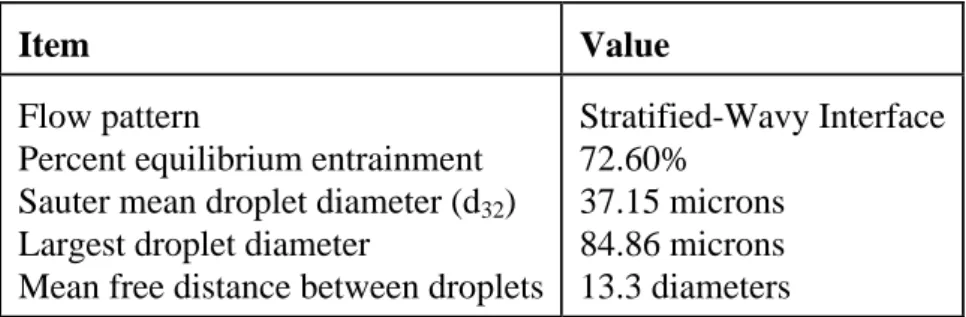
The data shown in Table 2 are excerpted from the calculations. The data reveal a stratified two-phase flow pattern with wavy interface. In this application, only 72.60% of the liquid is entrained in the form of droplets in the gas stream. The Sauter mean liquid droplet diameter (d32) and the largest diameter are computed and shown in Table 2. The
liquid-to-gas ratio for normal plant operation is low, making the mean free distance between adjacent particles an order of magnitude larger than the droplet diameter.
Table 2. Flow in the Inlet Nozzle
Item Value
Flow pattern
Percent equilibrium entrainment Sauter mean droplet diameter (d32) Largest droplet diameter
Mean free distance between droplets
Stratified-Wavy Interface 72.60%
37.15 microns 84.86 microns 13.3 diameters
Based upon the physical properties of the fluids at the inlet and the Sauter mean droplet diameter, the droplet size distribution is computed. The distribution, shown in Table 3, is divided among 8 intervals between zero and a computed largest droplet diameter, measured in microns. Each interval is defined between a minimum (Min-
µ
) and maximum (Max-µ
) droplet size. The average droplet size (Ave-µ
), the number of particles (Num-%) and volume of fluid (Vol-%) for each interval are shown in Table 3.Table 3. Droplet Size Distribution Min (µ) Max (µ) 0 10.61 10.61 21.21 21.21 31.82 31.82 42.43 42.43 53.04 53.04 63.64 63.64 74.25 74.25 84.86 Ave (µ) 5.30 15.91 26.52 37.13 47.73 68.95 68.95 79.55 Num (%) Vol (%) 14% 0% 44% 4% 28% 17% 10% 29% 2% 29% 0% 17% 0% 4% 0% 0%
It is important to note that the occurrence of 0% in Table 3 means less than 0.5%, and does not indicate the absence of liquid droplets in the corresponding size distribution. SEPARATOR TYPES
Different separation components are available and some are presented below. All the types presented are effective and widely used for different applications.
Vane Banks
Vanes (hook vanes) are channels that route two-phase flow into a non-linear path. As the gas makes sharp turns through the channel, liquid droplets impinge on the channel walls. A liquid film forms and drains downward on the channel walls (Fewel and Kean, 1992a). Pockets are also used to enhance the capacity of the vane-type separator.
Mesh Pads
Mesh pads can be used as separators when installed horizontally in a vessel with vertical gas upflow through the pads (York and Poppele, 1963). Compact vessel designs that rely on high capacity vane banks take advantage of mesh pads as agglomerators at the vane face. The use of mesh pads on the vane face enhances the liquid particle removal efficiency.
Coalescing (Absolute) Separators
This type of separator relies on high efficiency disposable coalescing filter elements. The elements capture and separate small liquid particles of submicron diameter from the gas stream.
Filter Separators
In applications where small solid particles are present, filter separators are used. These separators rely on disposable filter elements to capture solids. The filter separators are also effective in applications where the incoming liquid droplets are of small diameter (order of 1 micron). In such applications, the filter elements act as agglomerators and are used in conjunction with a second separation stage for liquid removal.
Cyclonic Separators
The use of cyclone-type separators is ideal for removing both solids and liquids from a gas stream (Perry and Green, 1997). The cyclone tubes rely on centrifugal forces to separate droplets from the main gas stream.
Swirl Tubes (Axial Flow Cyclones)
Swirl tube separators are similar to cyclone tubes in that centrifugal motion in the tube is used to separate liquid droplets from the gas stream (Verlaan, 1991). A separate secondary hydrodynamically driven gas stream is also designed as part of the tube to improve liquid removal from the tube.
VESSEL AND SEPARATION INTERNALS DESIGN
The separator is designed such that the level of liquid carryover is no more than 0.014 cubic meter per million normal cubic meters of gas (0.1 gal/MMSCF). High capacity separation internals are selected to ensure the compactness of the vessel. The vessel is a vertical separator with four banks of mist eliminators (hook vanes with mesh pad agglomerators). The vessel shown in Fig. 2 is equipped with two stages of separation.
Figure 2
SEPARATION VESSEL
A half-pipe inlet baffle is used as a first (liquid knock-out) stage. This baffle is an extension of the inlet pipe into the vessel with the bottom half of the pipe cut off along a major part of the projection inside the vessel. Performance of the half-pipe baffle is outstanding in separating the majority of the incoming liquid, especially with stratified two-phase flow in the inlet pipe as expected in this application (Table 2). The deflector works as follows:
Gas and liquid entering the vessel, initially flowing horizontally through the inlet pipe, deflect downward and split into two adjacent circulating streams. Both streams flow upward on either side of the half-pipe, after losing a significant amount of liquid due to inertia combined with gravitational forces acting on the liquid.
The remaining entrained liquid droplets flow upward with the gas toward the mist eliminator which is a vane pack with mesh pads on the vane face. The vane pack captures liquid droplets at its walls and pockets (Fewel and Kean, 1992). The captured liquid drains to the bottom of the vanes into a drain trough and is then drained to the bottom of the vessel through drain pipes (downcomers). The downcomers are extended downward in the vessel beneath the liquid-free surface (only one is shown and identified in Fig. 2) into the liquid collection section at the bottom of the vessel.
Mesh pads at the vane face capture small (diameter <8 micron) liquid droplets by providing a coalescing surface. Upon contact with the mesh pad wires, small droplets coalesce and agglomerate into larger droplets. With mesh pads acting as coalescers, droplets entering the vane pack are enlarged and separated in the vane. Efficiency of the mist eliminator (composed of the vane packs and mesh pads) is checked and validated as discussed in the sections below.
Intermittent slugs may occur in stratified flow due to changes in elevation in the pipeline upstream of the designed vessel. Slug handling capability is, therefore, built into this vessel by providing additional volume in the bottom of the vessel for capturing an expected volume of liquid slugs. The half-pipe inlet deflector works with stratified and slug flow as it causes a very limited shear force on the liquid and allows the stratified portion of the liquid to drain down to the bottom of the vessel.
VALIDATION BY ONE-DIMENSIONAL, TWO-PHASE FLOW MODEL
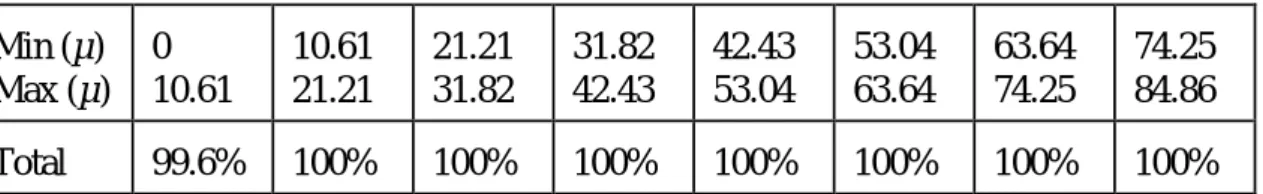
A one-dimensional, two-phase flow model is used to compute an estimate of the carryover level past the inlet baffle and mist eliminator. In this model the separation efficiency of each component is computed individually based upon the incoming liquid droplet size distribution. The total vessel separation efficiency is computed as the compounded efficiency for the components. The purpose of this validation step is to ensure that the efficiency of the equipment used will result in a carryover level less than the guaranteed 0.014 cubic meter per million normal cubic meters of gas (0.1 gal/MMSCF).
A close look at the values presented in Table 4 indicates that the liquid droplets in the range 0-10.61 microns are captured with 99.6% efficiency, while all larger particles are captured with 100% efficiency.
Table 4. Droplet Removal Efficiency Min (µ) Max (µ) 0 10.61 10.61 21.21 21.21 31.82 31.82 42.43 42.43 53.04 53.04 63.64 63.64 74.25 74.25 84.86 Total 99.6% 100% 100% 100% 100% 100% 100% 100%
Combining this calculation with the incoming liquid load reveals that the liquid carryover is less than 0.014 cubic meter per million normal cubic meters of gas (0.1 gal/MMSCF). The low computed liquid carryover level proves that the vessel type selected exceeds the liquid separation needs under the actual gas and liquid flow rates and conditions expected in the field (Fewel, et. al., 2000).
VALIDATION BY THREE-DIMENSIONAL NUMERICAL MODELS
A tetrahedral finite volume, three-dimensional, half-symmetry grid of 159,387 cells is used to create the flow simulation in the vessel, constricted by the vessel shell and the stagnant free liquid surface. A commercial CFD code (FLUENTJ, a registered trademark of Fluent, Inc., Lebanon NH) is used to iteratively solve the governing partial differential equations, specifically, the Navier-Stokes equations with the K-
∈
m odel of turbulence. A uniform velocity with a ten percent (10%) level of turbulence is prescribed at the vessel inlet and a uniform pressure is prescribed at the outlet.The mist eliminator banks (vane banks and mesh pads) are simulated by the porous media equations (Nield and Bejan, 1992), and their coefficients are computed directly from laboratory experimental data. Inertial pressure loss is imposed through the mist eliminators while other relatively minor losses are disregarded.
Gas velocities in the mist eliminators are closely observed. Specifically, the computed velocity maldistribution ratio (MD = ratio of maximum velocity to average velocity) in the four-bank mist eliminator is compared to the allowable MD ratio. This allowable MD is a function of the specific mist eliminator type in use, and the properties and flow rates of the gas and liquid.
Fig. 3, Velocity Contours and Vectors
The maximum allowable MD ratio is determined through air/water laboratory testing, scaled to the gas and liquid flow rates and physical properties at normal vessel operation temperature and pressure. Under the defined fluid flow conditions and for the specific mist eliminator type considered in this work, this maximum allowable velocity is such that the maldistribution in the mist eliminators is 1.80.
A maldistribution value larger than the maximum allowable demonstrates that the capacity of the mist extractor is exceeded, thus indicating poor separation performance. Simply, the high velocity region acts like a hole in the mist extractor through which entrained liquid penetrates with minimal hindrance (Fadda, 2000).
Contours representing the velocity magnitude entering the mist eliminators are presented in Fig. 3. The numbers indicating contour levels in Fig. 3 represent the velocity magnitude values in meters per second (m/s). The maximum computed velocity corresponds to a maldistribution ratio of 1.58, which is fourteen percent (14%) lower than the allowable value. The numerical simulation results, therefore, confirm the validity of the vessel design. CONCLUSION
The use of CFD, combined with high capacity vane internals, results in the design of a compact vessel with a minimum liquid carryover level and optimum performance.
REFERENCES
BP, 2000, ALNG Imports Needed to Meet Growing US Gas Supply Deficit,@Oil and Gas Journal, October 2, 2000, Vol. 98, No. 40, p. 29
Fadda, D., 1998, AComputational Flow Model of a Two-Phase Separator,@ ASME Energy Sources Technology Conference and Exhibition, Feb. 2-4, 1998, Houston, Texas. Fewel, K. J., Fadda, D., and Porneala, D., 2000, ATwo-Phase Separator Design: An Advanced
Integrated Approach,@ Laurance Reid Gas Conditioning Conference, Feb. 27-Mar. 1, 2000, Norman Oklahoma.
Fewel, K. J., and Kean, J. A., 1992, AThe Use of Computational Fluid Dynamics (CFD) in the Design of Gas/Liquid Separation Equipment,@ Laurance Reid Gas Conditioning Conference, March 2-4, 1992, Norman, Oklahoma.
Hause, K., 2000, ADesert Challenge: Oman LNG on Target and Under Budget,@ Foster Wheeler Review, Summer 2000, P. 13.
Nield, D., and Bejan, A., 1992, Convection in Porous Media, Springer-Verlag, New York. Perry, R. H., and Green, D. W., 1997, Perry=s Chemical Engineers= Handbook, McGraw-Hill
Companies, Inc.
Petroleum Economist, 1998, AIncreasing the Capacity per Train,@Petroleum Economist, Vol. 64, Issue 4, P. 32, April 1998.
Verlaan, C., 1991, APerformance of Novel Mist Eliminators,@ Ph.D. Dissertation, Delft University of Technology, Faculty of Mechanical Engineering and Marine Technology. Wallis, G. B., 1969, One-Dimensional Two-Phase Flow, McGraw-Hill, New York. York, O. H., and Poppele, E. W., 1963, AWire Mesh Mist Eliminators,@ Chemical