Boise State University
ScholarWorks
Materials Science and Engineering Faculty
Publications and Presentations Department of Materials Science and Engineering
1-1-2016
Revealing Student Misconceptions and Instructor
Blind Spots with Muddiest Point Formative
Feedback
Cindy WatersNorth Carolina A&T State University Stephen J. Krause
Arizona State University Janet Callahan Boise State University Barry Dupen
Indiana University - Purdue University, Fort Wayne Mary B. Vollaro
Western New England University See next page for additional authors
Authors
Cindy Waters, Stephen J. Krause, Janet Callahan, Barry Dupen, Mary B. Vollaro, and Peggie Weeks
Paper ID #15012
Revealing Student Misconceptions and Instructor Blind Spots with Muddiest
Point Formative Feedback
Dr. Cindy Waters, North Carolina A&T State University
Dr. Cindy Waters is an assistant professor in the Mechanical Engineering and she specializes in porous metals for biological and transportation applications, and engineering education. Dr. Waters’ research expertise is in the creation and characterization of metallic foams and porous metals for the future of ap-plications ranging from space exploration to biomedical implants. These metals display a high density to strength ratio and improved ability for energy absorption, which leads to usefulness in many applications. Dr. Waters is also known for her engineering education efforts. She has past and current NSF funding with several facets of engineering education and these include: Assessment studies of classroom material science pedagogical implementations; Just in Time Teaching with Web-based Tools of Material Science; Case Studies in Material Science and Various Engineering Disciplines and; Engineering Faculty Barriers to Adopt Evidence-Based (or nontraditional) Teaching Methods. She has been invited to speak at confer-ences (MRS, MS&T, and ASEE) worldwide on the topic of Material Science education. She serves as the College of Engineering liaison to ASEE and advises the Society of Women Engineers student chapter and leads the students in developing and implementing yearly outreach events for the K-8 female community. She is author of many peer-reviewed conference proceeding and journal papers in the areas of both porous metals and engineering education.
Prof. Stephen J. Krause, Arizona State University
Stephen Krause is professor in the Materials Science Program in the Fulton School of Engineering at Arizona State University. He teaches in the areas of introductory materials engineering, polymers and composites, and capstone design. His research interests include evaluating conceptual knowledge, mis-conceptions and technologies to promote conceptual change. He has co-developed a Materials Concept Inventory and a Chemistry Concept Inventory for assessing conceptual knowledge and change for intro-ductory materials science and chemistry classes. He is currently conducting research on NSF projects in two areas. One is studying how strategies of engagement and feedback with support from internet tools and resources affect conceptual change and associated impact on students’ attitude, achievement, and per-sistence. The other is on the factors that promote persistence and success in retention of undergraduate students in engineering. He was a coauthor for best paper award in the Journal of Engineering Education in 2013.
Dr. Janet Callahan, Boise State University
Janet Callahan is Professor and Chair of Materials Science and Engineering at Boise State University. Dr. Callahan received her Ph.D. in Materials Science, M.S. in Metallurgy, and B.S. in Chemical Engi-neering from the University of Connecticut. Her educational research interests include materials science & engineering, freshman engineering programs, math education, and retention and recruitment of STEM majors.
Dr. Barry Dupen, Indiana University - Purdue University, Fort Wayne
Dr. Dupen is an Associate Professor of Mechanical Engineering Technology at Indiana University – Pur-due University Fort Wayne (IPFW). He has nine years’ experience as a metallurgist, materials engineer, and materials laboratory manager in the automotive industry. His primary interests lie in materials en-gineering, mechanics, and engineering technology education. He is also an experienced contra dance caller.
Dr. Mary B. Vollaro, Western New England University
Mary B. Vollaro is Associate Professor of Mechanical Engineering at Western New England University in Springfield, Massachusetts. Dr. Vollaro received her Ph.D. at the University of Connecticut, her M.S. at Rensselaer Polytechnic Institute, and her B.S.M.E. at Western New England University. She has held
c
Paper ID #15012
engineering positions in industry (in particular, the materials science area) and was Chair of the ASEE Materials Division. She has written in the area of materials science education and is now working on leadership and teaming activities for engineers.
Ms. Peggie Weeks
Peggie Weeks has twice been a Program Officer at the National Science Foundation and currently serves as External Evaluator on six National Science Foundation projects and centers. She was on the faculty at Corning Community College for 16 years. Prior to teaching, she was employed as a Process Engineer with Corning, Inc. She has a master’s degree in ceramic engineering from Alfred University and a bachelor’s degree in metallurgy and materials science from Carnegie Mellon University.
c
Revealing Student Misconceptions and Instructor Blind Spots
With Muddiest Point Formative Feedback
Cindy Waters, Janet Callahan, Steve Krause, Peggie Weeks, Barry Dupen and Mary Vollero
Abstract
Of interest to all engineering disciplines, well-designed formative feedback has the potential to enhance both instructor teaching and student learning. Delivering fundamental courses year after year, can ultimately lead faculty to use stale notes or slides from past years. This approach may save time, but does not meet the shifting needs of our students who have high expectations from their instructors. One simple method to improve teaching is to employ muddiest point reflections. Muddiest point reflections involve simply asking students to anonymously reflect on what was “muddy”, i.e. confusing, during class and to rank their level of confusion which not only addresses students falling behind, but also shows students a commitment to their education especially when the instructor puts direct student quotes on the screen. Initially, developing a formative feedback process takes some effort, but once established, using a formative feedback process requires little effort. The formative feedback process includes four steps: 1) acquiring data from student reflections; 2) assessing and characterizing student responses in order to diagnose the learning issues that can impede students from achieving their learning goals; 3) designing and synthesizing the type and mode of formative feedback that best addresses the learning issues; and 4) selecting a formative feedback delivery method that quickly
communicates to students the information and/or resources that they can use to enhance progress toward their learning goals.
This paper presents and discusses the nuts and bolts of implementing the feedback process when using end-of-class “Muddiest Point” (MP) student reflections. These are collected following a class topic and are collected for the purpose of identifying – and quickly correcting – points of confusion that students individually report (their muddiest point). In addition, we report on several instructor perceptions of their teaching that result from using “muddiest points” for the first time. These instructors deployed MP in a systematic way in fall, 2015 in several different materials science courses across the country. Finally, we share strategic examples from each instructor, of how using muddiest points in fall, 2015, caught a misconception or point of confusion in their teaching that probably would not have been otherwise known.
I. Introduction Formative Feedback
One of the goals in engineering education, as included by ABET into its accreditation criteria,1 is
to promote practices that teach students how to become lifelong learners, or "learning how to learn". Yet, the majority of classes in engineering are still taught by lecturing, or the
"transmission" mode of teaching. In the past, student learning in higher education has been conceptualized as a simple process of acquisition of knowledge based on transmission of information by instructors. Education research has shown that it is a process by which students actively construct their own knowledge.2 Students interact with relevant content in different settings, including social engagement with other students, and connect with prior knowledge to build a conceptual framework of retrievable knowledge and understanding of the new content.3 A shift has taken place in theories of how students learn. The shift has gone from "instructor-centered teaching" to "student "instructor-centered learning." In effect, this means that the responsibility and management of learning is shifted from the instructor to the student. In spite of the shift in attitude about how learning is conceptualized, approaches to teaching have trailed and most engineering classes are taught and students assessed by traditional lecturing and testing. During a traditional setting, students have little input or control of the course content. As such, instructors "transmit" feedback to students mainly with assessment by grading of homework, quizzes and tests as to whether the work is correct, or incorrect. Instructors may falsely assume that students can use this limited information to then expand their knowledge and understanding of the content. However, if the feedback loop, or formative assessment, is entirely controlled by the instructor, we may be wrong to think that students can develop the skills of lifelong learning such as defining goals, monitoring progress, and diagnosing and addressing learning issues that arise along the pathway to goal achievement.2 These are the very metacognitive skills that make up the learning strategies used in the progression towards self-regulation by expert learners.4 Effective self-regulation involves students targeting goals against which performance can be measured and assessed. Feedback is the information about how the student’s present state (of learning and performance) relates to these learning goals. Internal feedback in self-regulation helps students to monitor and assess progress toward goals with respect to either success or possible difficulties with learning activities and tasks. More effective self-regulation produces better feedback. External feedback from external resources such as students, teachers, interactive web sites, etc., can contribute to the self-regulated learners' assessment of progress toward goals as well as provide assistance in overcoming impediments in progress towards their learning goals.
The overall benefits of good feedback practice have been summarized by Nicola and McFarlane-Dick:2
1. Helps clarify the nature and criteria of students learning goals.
2. Facilitates the development of reflection and self-regulation in learning. 3. Delivers high quality information to students about their learning. 4. Encourages teacher and peer dialogue around learning.
5. Encourages positive motivational beliefs and self-esteem.
6. Facilitates opportunities to close the gap between current and desired performance toward desired learning goals.
7. Provides information to instructors to help them adjust their teaching strategies and practice.
Muddy Points
Muddiest Points reflections give instructors authentic, rich insights and information on student learning issues they can effectively use to synthesize external formative feedback. Such feedback can then be used by students to assess and monitor progress and overcome learning issues. “Muddiest points” are shared with their instructor by students based on their unclear
understanding of topics. Frederick Mosteller is credited in 1988 to be a first implementer of muddiest points through the solicitation of responses to the following three questions: 1) What was the most important point in lecture? 2) What was the muddiest? and 3) What would you like to hear more about? Following analysis of the student responses, Mosteller addressed issues using both class time and handouts. Mosteller stated that although this activity required class time, the students enjoyed the exercise and he was able to modify 15% of his class behavior.5,6 Also in 1988, Angelo and Cross highlighted “muddiest points” as a subsection of one of thirty classroom assessment technique classification.7 It has been suggested that the collection of most
interesting points is a beneficial addition to balance perceived negativity by focusing only on muddiest point.8
This paper presents results and experiences gained by five different faculty members in the United States who have used the technique of “muddiest points” to gather formative feedback in their undergraduate coursework. In this paper we have a main but not exclusive focus on the use of this approach in the introductory course to the field of Materials Science and Engineering. Three of these faculty were new to using this approach and began using the technique at the end of each class starting in fall, 2015. These faculty each have 15 or more years of teaching
experience and are regular attendees at ASEE. The other two faculty have substantial experience in the “muddiest points” approach. In order to capture possible changes associated with
beginning to use frequent formative feedback in their courses, we included a pre-post survey of the three faculty new to the approach; these surveys and how they were implemented are described in the following section.
II. Experimental Methods
Three surveys were conducted, taken just before classes started in fall, and also again at the end of the semester. The surveys were administered only to the three faculty who had not previously used Muddiest Points feedback in their classrooms. Survey (1) was the “Approaches to Teaching Inventory” (ATI), a statistically reliable and valid instrument developed by Trigwell and Prosser9 to test how faculty approach their teaching and view their students' learning. It measures faculty beliefs with respect to the extent to which they teach with an approach toward instructor-centered knowledge transmission versus student-centered conceptual change. It was successfully applied as a 16 item survey to a study of engineering faculty beliefs change.10
The second survey, the Reformed Teaching Observation Protocol (RTOP), was used because, again, it is a well-known and respected instrument.11 The RTOP is a classroom observational protocol that quantitatively characterizes the extent to which faculty implement evidence-based instructional strategies as evidenced by student-centered behaviors observed in their own
main categories of instructor classroom behaviors that are scored by the observer. They are: 1) Lesson Design and Implementation; 2) Content: Propositional Pedagogic Knowledge; 3) Content: Procedural Pedagogic Knowledge; 4) Communicative Interactions; and 5) Classroom Culture: Student/teacher Relationships. It should be noted that the RTOP survey is normally used by trained classroom observers, but in this study it was used by the faculty themselves to reflect on their own classroom practice and, therefore, the data is self-reported. With RTOP scores scaling from 1 to 100, a value less than 40 is indicative of more teacher-centered classroom behaviors. Scores from 40 to 60 are indicative of a mixture of both teacher-centered and student-centered classroom behaviors whereas scores above 60 are more indicative of student-student-centered behaviors. Self-reported scores tend to trend higher when compared to the values obtained by an observer of the same person instructing in the classroom, but still provide insight into an
instructor's perception of their teaching.
A third survey, the Faculty Teaching and Learning Awareness survey was developed for the project to gather information about the extent to which faculty are aware of their teaching practices based on student feedback. This survey has not been tested extensively, and it was administered to see whether a correlation existed among the responses of the three surveys. [Copies of the surveys can be found in the Appendix.]
III. Results and Discussion
Implementation of Muddiest Points
In any informal discussion about formative feedback, the details of how the formative feedback is collected, and what the instructor does with it are inevitably discussed from the perspective of “how much time will it take me to do this?” The following sections are therefore devoted to describing how muddiest points were implemented in their classroom as well as some insights learned as a result of them.
Experienced Instructors with the Muddiest Point Approach.
Two of the authors of this paper have a very sophisticated approach to deploying Muddiest Points in their classrooms.
Instructor A: My initial efforts at using Muddiest Point feedback were flawed because I did not collect information on a regular basis or did not provide feedback to students the next class. By the end of that term my response rate was 15% to 20%. Another problem was that I was not using student quotes in my next-class Muddiest Point slide. Instead, I was summarizing the most frequent Muddiest Points and then discussing them in a more general sense. After the initial two semesters I started using student quotes in my Muddiest Point slide, which proved to be very popular with the students. At semester end they commented that they felt less isolated because other students were having the same kinds of issues that they were. Other students commented that the Muddiest Points helped them realize better what they didn’t know themselves. Still responses declined to 35% to 45% by the end of the semester without incentives. After two years of using end-of-class Muddiest Point sheets to collect data, I shifted to the automated survey tool on Blackboard which greatly facilitated data collection. Additionally, the survey tool allowed me to record who had submitted their Muddiest Point each class, which then allowed me to give extra credit for submission, about 5% added to the final grade. Submission rates increased to
60% to 90% across the semester, with a modest drop of 10% to 20% in the middle of the term, and a rise again to 80% to 90% by the end of the term (when the students need the extra credit. After automating Muddiest Points many other faculty became interested in using the technique, whereas using paper and pencil end-of-class Muddiest Point sheets attracted no interest by other faculty.
I have greatly expanded access to automated Muddiest Point feedback by creating a training video for implementing daily class Muddiest Point surveys on Blackboard. The training video was uploaded to the already existing "materialsconcepts" YouTube channel. The 30-minute video describes in detail how the Muddiest Point survey and downloading tools can be easily set up for a course for an entire 20-class semester within 60 to 90 minutes by a faculty member or student.
The other automated Muddiest Point data collection on Concept Warehouse (CW) had new capabilities added last year including a calendar function with start-and-stop times on desired days across a semester. The CW site is http://cw.edudiv.org/. Over the past few years the number of faculty using the method has grown and some will find it a wonderful means to increase student learning by modifying the feedback loop. They are designed to give instructors authentic, rich insights and information on student learning issues they can effectively use to synthesize external formative feedback. Such feedback can then be used by students to assess and monitor progress and overcome learning issues. The feedback also offers important opportunities for instructors to reflect on their own beliefs and practice and catalyze change to students' learning opportunities and their classroom experience.
Instructor B: I have used two different methods now to automate collection of muddy points. Three years ago I began using the Concept Warehouse (CW) to have students login and record their muddy points. Last year I used the capabilities of setting it all up at the beginning of the semester with the calendar function with start-and-stop times on desired days across a semester. Students voiced that they did not like having to go to a separate website to record responses and consequently this year I set up the assessment on Blackboard which allows the students to have more “one stop” assessment. In my class, about 70% of students complete the surveys. I
incentivize it by telling them that 80% participation gave them full credit for the portion of their grade that was for attendance and participation. My implementation is short and sweet: each day ~ 30 minutes before class I quickly read their responses and create a slide or two to address the most common. We then spend the first few minutes of class to discuss them. The appendix contains some representative responses.
Instructors New to Muddiest Point Approach in Fall, 2015 (Faculty 1, 2 and 3).
The three faculty using the new approach are longstanding colleagues from graduate school who are now faculty members at three different institutions across the United States. One of them, Prof. C, recruited the other two to engage in this activity after spending time learning in depth about the muddiest point approach through several extended phone conversations with Instructor A. Instructor A has a well-established approach that has already been described.
Self-reflection of faculty:
Faculty #1: My approach to deploying muddiest points was as presented in the YouTube video. I hired an undergraduate to watch the “how to” video and then she set up 25 Blackboard quizzes timed to become active at the end of class, and remain open that day until midnight. The quizzes simply stated, “Describe in a sentence what was confusing or needed more detail or
explanation.” Taking a single quiz was worth one point of extra credit, and there were 25 opportunities to elect to provide feedback in this way. This corresponded to a potential 2.5% boost in grade for regular participation. The hired student also compiled the feedback into a single word document and created three short slides containing representative comments and questions from students that she emailed to me. This took her no more than one hour per week to accomplish. Approximately 80% of the time, I started class by reviewing these points using the slides; this took approximately 5 to 10 minutes per class. It could have taken much longer; I had to decide what to focus on as I had about 80 students in the class and there were plenty of muddy points to choose from.
In general, students appeared to embrace the use of “muddiest points.” The average number of extra credit points from answering the survey was 12.9, with a high of 25 and a low of 0. The distribution of points from MP across the semester was relatively even. Students were instructed that they could comment on what was clear to them, if they had no “muddy point,” and were assured that the survey was anonymous. There was no clear correlation between course grade earned and participation in the survey.
I found myself thinking more deeply about the course content as a result of the student questions. I realized many points of confusion for students that were previously unknown to me. For
example, a muddiest point that caught me by surprise surrounded the issue of how temperature affects recovery and electric conductivity. Student’s muddy points opened up a great discussion about mechanical deformation and about electrical conductivity, and how “annealing” differs from looking at properties as a function of temperature. Students were clearly being reflective about what they learned, and having the formative feedback seemed to deepen their learning experience.
In general, students really appreciated beginning class with going over review points. One day, when I had fallen behind for about two classes in doing muddiest points, I devoted an entire class to going over them. The following survey had a student remark: “Thank you for giving us a day of review. I love it when professors do that, and answering muddiest questions for review was spectacular! [happy face emoticon].” However, on that same review day, one student reported, “Spend more time on new and needed material and less on muddiest points.”
Faculty #2: I taught a freshman Materials and Processes class for 23 mechanical and industrial engineering technology students in Fall 2015. We used Muddy Points to evaluate the well-written, commercially-available textbook, and to evaluate and improve the class experience. For the textbook, I asked students to discuss the muddiest point from the reading assignment. We did not discuss these points, but I recorded them for submission to the textbook author.
For the class experience, students wrote their muddiest point from the lecture on a 3x5 notecard. I typed up all of the students’ muddy points verbatim, along with my commentary (answers to questions or more complete explanations of materials concepts), handed out the results in the
next class meeting, and discussed the muddy points with the class. This process led to additional class discussion of any topics that were still not completely clear.
Periodically, I asked the class whether the Muddy Points exercise was worthwhile, and the overwhelming response was positive – students wanted to continue using the 3x5 cards. However, the number of cards submitted during each class meeting declined as the semester progressed. At the beginning of the semester, 96% of students submitted cards. By the end of the semester, only 22% of the students were submitting cards. The overall participation rate was 58%. The participation rate in the textbook muddy points was far higher, ranging from 57% to 87%, and not changing much during the semester. The overall participation rate was 79%. Most likely, students participated at a higher rate because the textbook muddy points were graded as part of the homework, whereas the 3x5 cards were purely voluntary.
Most student comments on the textbook fell into one of these categories:
Terminology is not explained fully, and in not enough detail.
Mathematical symbols are not explained.
Explanations are too abstract.
There isn’t sufficient connection between theory and the real world.
Insufficient examples are given for solving mathematical problems.
On the class meeting 3x5 cards, most students asked for more detail of some topic discussed in the lecture. In some lectures, the topic was difficult to absorb in one sitting. For example, in the introductory lecture on steel, students had many questions about ferrite, cementite, the formation of pearlite and martensite, and the steel phase diagram.
Usefulness of the Muddy Points approach: In the short term, I am using Muddy Points feedback on the fall 2015 lectures to improve the spring 2016 lectures. In the long term, the textbook muddy points will lead to the design of a new textbook that is tailored to my students. A good model is my Strength of Materials textbook, which is updated every semester based on student feedback.10
Faculty #3: I executed “muddiest points” in two introductory materials science courses (27 and 29 students enrolled) in the same manner as presented by XU in their YouTube video. For each class and each section a separate survey was set up in short answer format. This was done to assure students saw their own words being addressed. I persisted with this method all semester for each class. I also posted the results of surveys in Kodiak (virtual classroom). One
modification made was to give the students a longer time to add posts to the Muddiest Points survey. I initially followed the XU model by leaving the survey open for a few hours after class, then at the request of the students I left it open to the last possible moment before I was to address the ‘points’ in the next class. With a general survey of the students, they felt it would be better to have the survey open longer in case they had questions on the homework, not just the lecture. So the survey was open for nearly two days and included being open past lecture and the time the students were expected to do the homework on WileyPlus. I made a point to assure students that there were no ‘bad’ posts and I would treat each one with ‘care’ and preserve anonymity of the post.
My reflection:It didn’t work. In the beginning (first 4 weeks), I got some survey answers, about 50% of which were ‘no questions’ or ‘everything was clear,’ 40% which were relevant to the lecture and 10% which were way off topic. The off-topic questions seemed to be the student’s personal interest from work or an internship, or some information they found on the internet to, possibly, test my knowledge. I believe students who submitted relevant muddiest points were happy with the answers and clarification; however, they wanted the answer earlier ‘to do the homework’. (Although if they asked about the homework in person or email, they received assistance.) I did try to clarify that Muddiest Points was for misconceptions in lecture, and even used examples. Well, it was to no avail. Response was still poor and the students responding ‘all clear’ or ‘no questions’ stopped responding. By mid-semester response was sporadic, yet I diligently invited students to post! Another note, I had the least amount of email or personal requests for homework help in many years.
How did it affect my teaching?Honestly, I am not sure. The computer survey method was on a workload level that I could handle and easily integrate into my class. Questions posed in muddiest points were ‘misconceptions’ I have been aware of and most I had brought to the forefront in class lecture, but going over them in the muddiest points context was beneficial because it was student driven. Implementing muddiest points did not give me any new insights into my teaching, or more importantly, provide me any data or evidence to address the needs and concerns of the students.
How did it affect student learning?I believe students who used it as intended, got something out of it. I believe other students felt it wasted time from me teaching them ‘how to do the
homework’ for the next assignment. My personal impression was that answering the muddiest point survey was just one more thing they had to do for no credit.
Survey Results and Discussion
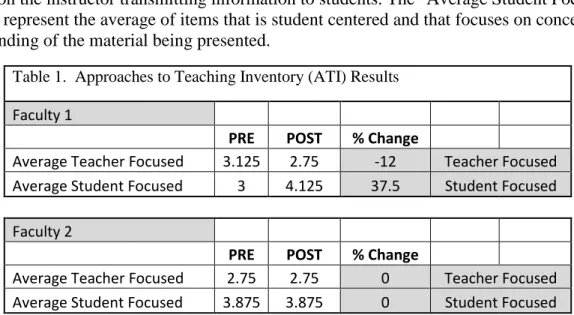
Table 1 presents the results of the ATI survey for the three faculty before and after they implemented Muddiest Points in their classrooms. The "Average Teacher Focused" numbers represent the average of survey items on a 5-point Likert scale that describe a teaching approach focused on the instructor transmitting information to students. The "Average Student Focused" numbers represent the average of items that is student centered and that focuses on conceptual understanding of the material being presented.
Table 1. Approaches to Teaching Inventory (ATI) Results
Faculty 1
PRE POST % Change Average Teacher Focused 3.125 2.75 -12 Teacher Focused Average Student Focused 3 4.125 37.5 Student Focused
Faculty 2
PRE POST % Change
Average Teacher Focused 2.75 2.75 0 Teacher Focused Average Student Focused 3.875 3.875 0 Student Focused
Faculty 3 PRE POST % Change Average Teacher Focused 3.75 3.75 0 Teacher Focused Average Student Focused 2.875 3.5 21.7 Student Focused
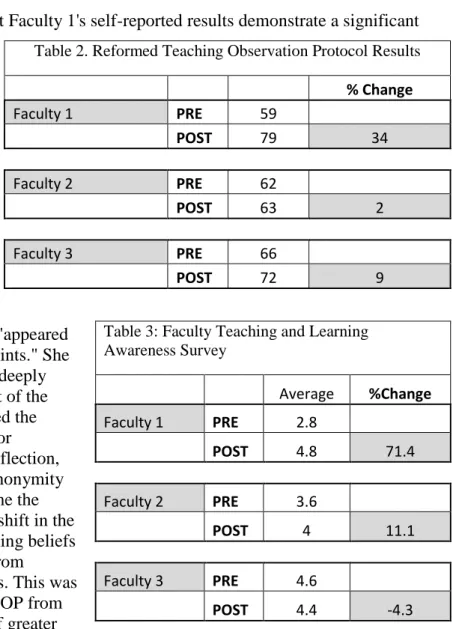
Table 2. shows the results for the self-reported RTOP survey, and Table 3 presents the results for the recently developed Faculty Teaching and Learning Awareness Survey.
For all three surveys, it is clear that Faculty 1's self-reported results demonstrate a significant change from the beginning to the
end of the semester. It is also clear from the first two surveys (ATI and RTOP) that Faculty 2 had the most limited pre-post changes, and that Faculty 3's results demonstrate modest change after implementing the Muddiest Points feedback strategy in the classroom.
Analysis of Survey Results
Faculty 1 shared that her students "appeared to embrace the use of Muddiest Points." She also stated that she thought "more deeply about the course content as a result of the student questions." She incentivized the process by giving students credit for participating in Muddiest Points reflection, and she maintained the students' anonymity in the process. Along with this came the result that she also had the largest shift in the ATI toward student-centered teaching beliefs along with the largest shift away from
instructor-centered teaching beliefs. This was complemented by a shift in the RTOP from 59 to 79 which is also indicative of greater
student-centered classroom behaviors. The Faculty Teaching and Awareness survey also showed a large gain of 71%. These data suggest that incentivizing Muddy Point participation for students results in greater participation and more information for instructors to provide feedback, which may be richer because of more involved students providing information about their learning issues.
Table 2. Reformed Teaching Observation Protocol Results % Change Faculty 1 PRE 59 POST 79 34 Faculty 2 PRE 62 POST 63 2 Faculty 3 PRE 66 POST 72 9 Table 3: Faculty Teaching and Learning Awareness Survey Average %Change Faculty 1 PRE 2.8 POST 4.8 71.4 Faculty 2 PRE 3.6 POST 4 11.1 Faculty 3 PRE 4.6 POST 4.4 -4.3
Faculty 2 stated that he used the Muddiest Points both for feedback about the lecture (using 3x5 cards rather than implementing electronically in a course management system) as well as feedback about the textbook. He said that in general, his students felt that the Muddiest Points exercise was worthwhile. He gave credit for the textbook Muddiest Points as part of the students' homework, but he did not give credit for the lecture (3x5 card) Muddiest Points. The
participation rate in the textbook Muddiest Points was significantly higher. This instructor had no shift in ATI values which may be due to relatively high values in ATI for student-centered teaching beliefs initially. There was a negligibly small gain from 63 to 63 in RTOP, but this also could indicate that he was already practicing student-centered behaviors in his classroom. There was a small gain of 11% in the Faculty Teaching and Awareness survey which indicates that may have been some minor shift in practice. It appears that this instructor was already practicing student-centered teaching to a significant extent, but it is possible that, because Muddy Point classroom feedback was not incentivized, that the more limited participation may have reduced opportunities to have more significant impact on students and resultant enhancement of already very good classroom practices.
Faculty 3 stated that Muddiest Points "didn't work." In general, she said that students who submitted relevant Muddiest Points were happy with the process; but there were significant numbers of students who did not participate. Faculty 3 gave no credit to the students for their Muddiest Points submissions. In a subsequent conversation with Faculty 3, she noted that her class had a highly bimodal distribution; i.e., roughly half the class was highly motivated and did very well in her class, and the other half received poor grades and did not appear to be motivated. This was also reflected in exam scores, quiz averages, and project grades. The exam scores for the class ranged from 105 to 32. This instructor showed greater teacher-centered beliefs with a value of 3.75 which did not change, but interestingly showed an increase in student-centered beliefs from 3 to 4.1, indicating that Muddiest Point feedback may have had some impact on teaching beliefs. The RTOP change was positive with an increase from 66 to 72 indicating student-centered classroom behaviors may have increased slightly which would correlate to an increase in student centered beliefs in the ATI. There was also a slight and negligible decrease in the value to the Faculty Teaching and Awareness survey. Overall, there was some enhancement of student-centered beliefs and practice, but this was limited, possibly due to the limited and decreasing numbers of Muddiest Point feedback across the semester. This again was due in part not incentivizing students for Muddiest Point feedback. With much less feedback there is also considerable reduction to hear the student voice on difficult concepts and learning issues, which may result in reduced opportunity to shift beliefs and practice toward student-centered teaching. Incentivizing Muddy Point participation might have some effect. Faculty 3 has reported that muddiest points will be implemented the next time she offers the course. She will persist with the ease of implementation through the virtual classroom surveys and adding an incentive of a scale that will motivate students to answer the survey, i.e. “Muddiest Points”, on a routine basis throughout the semester.
Limitations: Data is all self-reported for all studies, which usually results in a somewhat more positive results regarding preferences for student-centered practice and beliefs, but still can reveal insights about beliefs and practice and possible change. In future studies, especially in the case of the Faculty Teaching & Learning Awareness Survey, it might be better to administer a retrospective pre-post survey. This is because the baseline for responses may be very different at the end of a study compared to the beginning. A retrospective assessment would address this
issue to some extent. The data from these three instructors shows strong indications that incentivizing, or not, collection of Muddiest Point data certainly affect the percent of students responding, which decreases dramatically without incentives. It may also affect the quality of the responses since students may value them less without incentives. With less student input there is less opportunity for instructors to reflect on their practice which can reduce the potential for change.
IV. Summary and Conclusions
What the majority of faculty who shared in this paper have found is that the effort is worth the time but as with any classroom pedagogy the “devil is in the details.” One can conclude that implementation is paramount to control final results of a classroom innovation. Of the three instructors who were new to the muddy point approach the faculty who was able to have the highest level of student participation and was also able to reflect to the highest level saw the greatest change in student motivations and possibly learning. The same trend is reflected in the other two faculty: mid-level participation yielded mid-level results and lower participation saw the least return on investment. Of particular note is the following trend – the highest level of student participation resulted from the highest level of incentive (up to 2.5% of course grade). In summary, we have found that deploying formative feedback in the form of “muddiest points” is relatively easy to implement, not requiring much by way of instructor time as a result of the tutorials available online. We report the highest value from using “muddies points,” (measured by student participation levels, reported by the faculty, and measured with survey instruments) corresponded to an incentivized use of formative feedback. We conclude that incentivizing students to take the opportunity to give formative feedback is critical to obtaining the greatest value from both the student and faculty perspective using “muddiest points.”
Acknowledgements
This material is based upon work supported by the National Science Foundation under Grant No. DUE-1226325. Any opinions, findings, and conclusions or recommendations expressed in this material are those of the author(s) and do not necessarily reflect the views of the National Science Foundation.
References
1. Criteria for Accrediting Engineering Programs, ABET Engineering Accreditation Commission (2005).
2. Nicol, D. J. & Macfarlane-Dick, D. (2006). Formative assessment and self-regulated learning: A model and seven principles of good feedback practice. Studies in Higher Education, 31(2), 199-218.
3. Donovan, M. S., Bransford, J. D. & Pellegrino, J. W. (Eds.) (1999). How people learn: Bridging research and practice. National Academy Press, Washington, DC.
4. Butler, D. L. & Winne, P. H. (1995). Feedback and self-regulated learning—A theoretical synthesis. Review of Educational Research, 65(3), 245-281.
5. F. Mosteller, "Broadening the Scope of Statistics and Statistical Education Broadening the Scope of Statistics and Statistical Education," The American Statistician, vol. 42, pp. 93-99, 1988.
6. F. Mosteller, "The 'Muddiest Point in the Lecture' as a Feedback Device," The Journal of Harvard-Danforth Center, pp. 10-21, 1989.
7. K. P. Cross and T. Angelo, Classroom Assessment Techniques: A Handbook for Faculty, pp. 1-168, 1988.
8. S. Peltsverger, "Maintaining Balance between Theory and Practice in Information Security Courses," Information Security Curriculum Development Conference, pp. 59-60, 2011.
9. Trigwell, K., and Prosser, M. (2004). Development and use of the approaches to teaching inventory. Educational Psychology Review, 16(4), 409-424
10. McKenna, A., B. Yalvac, and G. Light (2009). The role of collaborative reflection on shaping engineering faculty teaching approaches; Journal of Engineering Education, 98,17-26.
11. Sawada, D., Piburn, M. D., Judson, E., Turley, J., Falconer, K., Benford, R., and Bloom, I. (2002). Measuring reform practices in science and mathematics classrooms: The Reformed Teaching Observation Protocol. School Science and Mathematics, 102(6), 245-253
12. Dupen, B. (2014, June), How to Improve a Textbook with Engineering Technology Students Paper presented at 2014 ASEE Annual Conference, Indianapolis, Indiana. https://peer.asee.org/20567
Appendix
Survey I. Approaches to Teaching Inventory Instructions:
This survey measures faculty perceptions about their own teaching. There are 16 items
addressing a variety of aspects of teaching undergraduate science, technology, engineering and mathematics (STEM) courses. Please rate your perception of your own teaching for each of the items on a 1 to 5 scale as it pertains to this class.
1 = Strongly Disagree 2 = Disagree
3 = Neither Agree nor Disagree 4 = Agree
5 = Strongly Agree
Example:
I incorporate demonstrations in my lecture 1 2 3 4 5
If you strongly agree that you incorporate demonstrations in your lecture, you would circle 5.
If you disagree that you incorporate demonstrations in your lecture, but do not strongly disagree, you would circle 2.
There are no right or wrong answers. Please complete all items. Do not spend too much time on any one item.
The results of this survey will be used to examine the kinds of teaching practices that tend to encourage student success in the first two years of undergraduate STEM coursework. Your responses will be kept strictly confidential. Only summary data will be shared.
Approaches to Teaching Inventory Survey
1. I feel it is important that this subject should be completely described in terms of specific objectives relating to what students have to know for formal assessment items.
1 2 3 4 5
2. I feel it is important to present a lot of facts in classes so that students know what they have to learn for this subject/course.
1 2 3 4 5
3. In this subject/course I concentrate on covering the information that might be available from a good textbook.
1 2 3 4 5
4. I think an important reason for running teaching sessions in this subject/course is to give students a good set of notes.
1 2 3 4 5
5. In my class/tutorial for this subject I try to develop a conversation with students about the topics we are studying.
6. In this subject/course, I only provide the students with the information they will need to pass the formal assessments.
1 2 3 4 5
7. I encourage students to restructure their existing knowledge in terms of the new ways of thinking about the subject that they will develop.
1 2 3 4 5
8. I structure this subject/course to help students to pass the formal assessment items.
1 2 3 4 5
9. I feel a lot of teaching time in this subject/course should be used to question students’ ideas.
1 2 3 4 5
10. I feel that it is better for students in this subject/course to generate their own notes rather than always copy mine.
1 2 3 4 5
11. I feel that I should know the answers to any questions that students may put to me during this subject/course.
1 2 3 4 5
12. In teaching sessions for this subject/course, I use difficult or undefined examples to provoke debate.
1 2 3 4 5
13. I set aside some teaching time so that the students can discuss, among themselves, the difficulties that they encounter in studying this subject.
1 2 3 4 5
14. I design my teaching in this subject with the assumption that most of the students have very little useful knowledge of the topics to be covered.
1 2 3 4 5
15. I feel that the assessment in this subject should be an opportunity for students to reveal their changed conceptual understanding of the subject.
1 2 3 4 5
16. I make available opportunities for students in this subject/course to discuss their changing understanding of the subject.
1 2 3 4 5
Survey II. Faculty Teaching & Learning Awareness Survey
Think about your current teaching practices and about your recent students, in general, as you respond to the following questions. Your name will be used only for tracking purposes, and your responses will be shared without attribution.
Almost Never 1 Infrequently 2 Sometimes 3 Frequently 4 Almost Always 5 1. I am aware of how my
2. I am aware of my students’ misconceptions/erroneous thinking. 3. I reflect on my students’ learning difficulties and misconceptions/erroneous thinking. 4. I modify or adjust my instruction to address my students’ learning difficulties and misconceptions/erroneous thinking. 5. I am aware of how changing my instruction impacts my students’ learning and performance.
Survey III. Reformed Teaching Observational Protocol (RTOP)
This is a classroom observation designed to assess the extent of active learning behaviors used by an instructor in their own classroom. However, it can also be used by an instructor to assess perception of their own behaviors in their classroom. The scale is 0 to 4 with 4 being strong agreement with the statement. This instrument will be filled out at the beginning of the semester and then again at the end to measure potential change in classroom practice. The survey was slightly modified to refer to activities in a course rather than a single lesson.
LESSON DESIGN AND IMPLEMENTATION
1. The instructional strategies and activities respected students’ prior knowledge and the preconceptions inherent therein.
0 1 2 3 4
2. Lessons were designed to engage students as members of a learning community. 0 1 2 3 4
3. In this class, student exploration preceded formal presentation. 0 1 2 3 4
4. Lessons encouraged students to seek and value alternative modes of investigation or of problem solving.
0 1 2 3 4
5. The focus and direction of classes was often determined by ideas originating with students.
0 1 2 3 4
CONTENT
Propositional knowledge
6. Classes involve fundamental concepts of the subject. 0 1 2 3 4
7. Classes promoted strongly coherent conceptual understanding. 0 1 2 3 4
8. The teacher had a solid grasp of the subject matter content inherent in the lesson.
0 1 2 3 4
9. Elements of abstraction (i.e., symbolic representations, theory building) were encouraged when it was important to do so.
0 1 2 3 4
10.Connections with other content disciplines and/or real world phenomena were explored and valued.
0 1 2 3 4
Procedural Knowledge
11.In this class students used a variety of means (models, drawings, graphs, concrete materials, manipulatives, etc.) to represent phenomena.
0 1 2 3 4
12.Students make predictions, estimations and/or hypotheses and devised means for testing them.
0 1 2 3 4
13.Students are actively engaged in thought-provoking activity that often involved the critical assessment of procedures.
0 1 2 3 4
14.Students are reflective about their learning. 0 1 2 3 4
15.Intellectual rigor, constructive criticism, and the challenging of ideas were valued.
0 1 2 3 4
CLASSROOM CULTURE Communicative Interactions
16.Students are involved in the communication of their ideas to others using a variety of means and media.
0 1 2 3 4
17.The teacher’s questions triggered divergent modes of thinking. 0 1 2 3 4
18.There was a high proportion of student talk and a significant amount of it occurred between and among students.
0 1 2 3 4
19.Student questions and comments often determine the focus and direction of classroom discourse.
0 1 2 3 4
20.There was a climate of respect for what others had to say. 0 1 2 3 4
Student/Teacher Relationships
21.Active participation of students is encouraged and valued. 0 1 2 3 4 22.Students are encouraged to generate conjectures, alternative solution strategies, and
ways of interpreting evidence.
0 1 2 3 4 23.In general the teacher is patient with students. 0 1 2 3 4 24.The teacher acts as a resource person, working to support and enhance student
investigations.
0 1 2 3 4 25.The metaphor "teacher as listener" is very characteristic of this classroom. 0 1 2 3 4
Typical “Muddiest Point” reflections:
Muddiest Point: Describe in a sentence what was confusing or needs more explanation. Given Answers
Total free energy and the relation with the critical radius is something that I need more explanation on. Also more description on the nucleations.
The free energy equation was a little bit confusing, but would be better helpful if we use it to solve a problem, that is given.
The differences between homogeneous and heterogeneous nucleation.
I could use some more review on the nucleation and free energy
I think I need more explanation on the r* stuff I understand the concept I just need to do some practice problems to fully understand it.
I am confused on the microstructures of the perlite, austenite, martenite, etc.
Getting Pearlite and Bainite is due to produce different phases in different temperature, isn't is?
The topic in today's class that needs more explanation is the Heterogeneous nucleation process.
More examples on r* and volume free energy equations
To learn is how to apply today
The most confusing thing in class today was the phase diagram
What methods are actually used to heat and control the temperature of a metal during heat treatment.
I don't know the different between volume free energy and surface free energy.
The muddiest point was homogeneous nucleation. That process needs more explanation.
One thing that I continue to struggle with is how to find the heat treatment for a given microstructure.
how does the course and fine perlite form in the same sample
I wish we could run through the solidification of homogeneous substances once more (with the diagram too).
Interesting Point: In a sentence explain what you found the most interesting about today's class.
Given Answers
What was very interesting in today's class would be solid phase changes.
This course let me know that I should get more knowledge in this term.
As the solid grows in size,both the magnitude of the total volume free energy and surface free energy increases...
The slowest of diffusion and nucleations governs solidifications. Materials solidify because the difference volume free energy
It is interesting how whether a nucleation forms or not depends on the size of the nucleation in addition to the temperature
I thought that the it was interesting how small a margin of error there is when heat treating a metal as far as temperature and time
I found the elapsed time activity interesting/
The most interesting point about today's class applying the different formulas to free energy.
Substances become solids when the energy needed to be in a solid state is less than the energy needed to be in a liquid state.
The diagram displaying the driving force of solidification and and melting made things more clear as to why the materials behave the way they do around the melting
temperature
I found the transformation diagrams the most interesting part of class.
What I found most interesting about todays class is that when you look
at Martensite, Pearlite, Spheroidite and Bainite on the triple T curve it looks like they are simple to form but it comes down to seconds to form these and if you are not precise you will have to start back at Austenite.
I find it interesting that various phases can be created from Austenite. The materials created can only derive from Austenite and nothing else.
I found it interesting when dealing with any the spherodite, pearlite,
bainite,or martinsite, you can make any of these metals just by turning them back to austenite.
I understood homogeneous and heterogeneous nucleation during this class. Also, that solidify is the energy of the crystal structure.