Sagkriotis, S., Kolomvatsos, K., Anagnostopoulos, C. , Pezaros, D. P. and
Hadjiefthymiades, S. (2020) Knowledge-centric Analytics Queries
Allocation in Edge Computing Environments. In: IEEE ISCC Symposium
on Computers and Communications, Barcelona, Spain, 29 June - 03 July
2019, ISBN 9781728129990 (doi:
10.1109/ISCC47284.2019.8969706
).
This is the author’s final accepted version.
There may be differences between this version and the published version.
You are advised to consult the publisher’s version if you wish to cite from
it.
http://eprints.gla.ac.uk/184022/
Deposited on: 15 April 2019
Enlighten – Research publications by members of the University of Glasgow
http://eprints.gla.ac.uk
Knowledge-centric Analytics Queries Allocation in
Edge Computing Environments
Stefanos Sagkriotis, Kostas Kolomvatsos, Christos Anagnostopoulos, Dimitrios P. Pezaros, Stathes Hadjiefthymiades*
School of Computing Science, University of Glasgowe-mail: [email protected];{kostas.kolomvatsos, christos.anagnostopoulos, dimitrios.pezaros}@glasgow.ac.u.k *Dept Informatics & Telecommunications, University of Athens
e-mail: [email protected]
Abstract—The Internet of Things (IoT) involves a huge number of devices that collect data and deliver them to the Cloud. The processing of data at the Cloud is characterized by increased latency in providing responses to analytics queries defined by analysts or applications. Hence, Edge Computing (EC) comes into the scene to provide data processing close to the source. The collected data can be stored in edge devices and queries can be executed there to reduce latency. In this paper, we envision a case where entities located in the Cloud undertake the responsibility of receiving analytics queries and decide on the most appropriate edge nodes for queries execution. The decision is based on statistical signatures of the datasets of nodes and the statistical matching between statistics and analytics queries. Edge nodes regularly update their statistical signatures to support such decision process. Our performance evaluation shows the advantages and the shortcomings of our proposed schema in edge computing environments.
I. INTRODUCTION
Edge Computing (EC) facilitates the efficient management of data collected by numerous nodes. The vast infrastruc-ture of the IoT involves heterogeneous devices capable of interacting with their environment and collecting data. Data could be gathered into a number of nodes at the edge of the network, thus, performing local processing to save time and resources for the provision of analytics. Analytics are derived over the collected data and corresponding to analytics queries issued by analysts, users, or applications. We envisage a set of Edge Nodes (ENs) and streams of analytics queries allocated to such nodes for execution. The ENs are regarded as distributed data repositories where queries can be executed through their corresponding Query Processors (QPs). The efficient management and allocation of incoming analytics queries as well as the provided results characterize the success of the supported applications. Usually, applications demand a response in the minimum time to provide high quality services to end users. Hence, the ENs/QPs should adopt query allocation and execution plans that limit the time required for obtaining the final analytic result.
Challenges: Should we desire to significantly reduce the time required for delivering final results of incoming analytics queries, the selection of the appropriate query execution plans is the first step of the process. Then, one should involve the selection of an efficient queries allocation plan. This means
that one should select the most appropriate subset of nodes that will deliver the appropriate results according to queries seman-tics and in the minimum time. Then, an efficient aggregation mechanism on the partial results should be invoked. In this paper, we focus on the allocation process of analytics queries arriving at a Query Controller (QC) in the Cloud taking into consideration the sufficient statistics (statistical signatures) of the data present in each EN. We consider that the underlying nodes are logically clustered based e.g., on geospatial criteria, imposed by the analytics applications. We introduce a decision making mechanism that exploits the statistical signatures of nodes’ datasets and concludes on most appropriate subset of nodes for allocation and execution. Based on this approach we reduce the time for getting responses and increase their quality as nodes with irrelevant data (compared to queries semantics) are excluded from the query allocation and execution process. The ENs regularly send their statistical signatures to the QC (at pre-defined intervals) involving the elimination of outliers and the reduction of the data dimensionality. This way, ENs send reliable statistics for their dataset that consequently support the QC’s decision making.
The paper is organized as follows. Section II reports on re-lated work, Section III formulates the problem and Section IV introduces our scheme. In Section V, we provide experimental evaluation of our mechanism, while Section VI concludes the paper reporting future research agenda.
II. RELATEDWORK
In edge computing environments many efforts study op-portunities for management of distributed data. The Dragon scheme in [17] identifies nodes that can reply to users’ requests based on criteria describing nodes themselves and their data. In [15] the authors propose a distributed data service providing functionality for data collection and processing. The objective is to enable multiple IoT middleware systems to share common data services covering interoperability issues. The parallel execution of queries increases the performance of the applications and at the same time, analytics are retrieved by different nodes aggregating them to deliver the final outcome. It is of high importance to obtain a view on the data statistics on each node since we can estimate the relevance between
the data and analytics queries as studied in [18], [19], [20]. Multiple efforts handle the problem of allocating data to specific nodes. In [4] data streams are partitioned on-the-fly taking into consideration the query semantics. A multi-route optimizer is proposed in [5] exploting intra- and inter-stream correlations to produce effective partitions. The schemes in [11] and [26] propose the separation of streams into sets of sub-streams over which queries are executed in parallel.
Query engines for the IoT domain [24] provide results in real time and data are processed at the devices at network edge. Such edge-centric processing is important in real-time, mission-critical applications such as self-driving vehicles [7]. Significant examples of edge-centric processing are: [1], [8], [21], [23], [27], [14]. Some efforts deal with the automated separation of queries graphs into two sets [10]: queries pro-cessed at the edge devices and queries propro-cessed in the cloud. In [22], the authors adopt statistical learning to recommend a previously generated query plan to the optimizer for a given query. The objective is to predict the query execution time for workload management and capacity planning. The delivery of edge analytics involves communication efficient predictive modeling within the edge network [13]. Analytics are derived by models dealing with dynamic optimal decisions for data deliver in light of communication efficiency [27], [6]. Several schemes exploit the computational capability of edge nodes to launch algorithms directly at the data sources [2], [9], [16].
Contribution: In our past research we dealt with the allocation of queries to a set of nodes; in [18], we proposed a time-optimized scheme for selecting the appropriate nodes adopting the odds algorithm while in [19], we presented a reinforcement learning model for query allocation. Our ex-tended work in [20] incorporates statistical learning processes for query load balancing. The proposed scheme in this paper significantly supports our previous schemes by intelligently providing a statistics-based efficient mechanism responsible to deliver the minimum sufficient information of the data for query allocation in edge computing environments. Such mechanism is exposed to the Cloud infrastructure being part of the schemes proposed in [18], [19], [20].
III. DEFINITIONS& PROBLEMFORMULATION
We consider a set of N ENs E = {n1, n2, . . . , nN} placed at various locations, e.g., in a city. IoT nodes like smartphones and sensors are connected with ENs to deliver their contextual data. At the upper layer, e.g., in the Cloud, there is a set of Query Controllers (QCs) responsible to receive and execute analytics queries q1, q2, . . . defined by
analytics applications and/or end users (data analysts). Such queries are then allocated to the appropriate QPs for execution functioning in the available ENs. Consider the set of N QPs
P ={p1, p2, . . . , pN}, each one corresponding to an EN. A QC after receiving an analytics query, it invokes the most appropriate subsetP0 ⊂ Pof QPs to get their query results and
return the finalaggregatedresult to the requesting applications depending on howrelevantis the query to the underlying data of each EN. The determination of the subset P0 is achieved
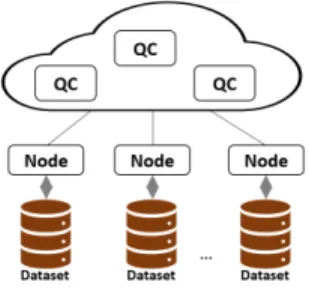
from certain statistics of data that each EN delivers to the back-end infrastructure, i.e., QC. Such statistics support the QC with the necessary view on what data are present in each EN used for the statistical matching with each incoming analytics query. Figure 1 illustrates the considered architecture.
Definition 1: A dataset Di = {xj}mj=1i of the EN i is a
set of mi row data vectorsx = [x1, . . . , xd] ∈Rd with real
attributes xk ∈R.
Analytics queries are issued over ad-dimensional data space and bear two key characteristics: First, they define a subspace of interest, using various predicates on attribute (dimension) values. Second, they perform aggregate functions over said data subspaces (to derive key statistics over the subspace of interest). We adopt a general vectorial representation for modeling a query over any type of data storage/processing system. Predicates over attributes define a data subspace over a datasetDformed by a sequence of logical conjunctions using (in)equality constraints (≤,≥,=). A range-predicaterestricts an attributexkto be within range [lk,uk]:xk ≥lk∧xk≤uk,
k = 1, . . . , d. We model a range query over a dataset D
through conjunctions of predicates, i.e.,Vd
k=1(lk≤xk≤uk) represented as a vector inR2d.
Definition 2:A (range) row analytics query vector is defined as q = [l1, u1, . . . , ld, ud]∈ R2d corresponding to the range
queryVd
k=1(lk ≤xk ≤uk).
For instance, consider an analytics range query asking for ex-tracting the correlation between temperaturex1 and humidity
x2 in the 2-dim subspace [5,10]×[80,100]⊂R2. If such a
query is executed over a dataset where the pairs (temperature, humidity) are outwith the above-mentioned 2-dim subspace, then the corresponding node will waste computational re-sources for executing this range query. In addition, such results will affect the final response due to aggregation.
Every ENiat pre-defined intervals calculates certain statis-tics of its dataset Di forming the statistical signature:Si. Si contains sufficient statistics of the underlying data vectors in
Di. In this paper, we adopt the following of statistics for the signature: the mean row vectorµ= [µ1, . . . , µd], the variance row vector σ = [σ1, . . . , σd] and the eigenbase Wd×K of the first K ≤ d column eigenvectors wk ∈ Rd (Principal
Components) produced by the Principal Component Analysis (PCA) [12] over the data in Di (or a sample); see Section IV-B. The signature of ENi is:
Si = {µi,σi,Wi,d×K}. (1) Note that, the signature should be constructed and incremen-tally updated in limited time, thus, the performance of nodes is not affected. The extraction of the signatureSi is based on a multidimensional outliers elimination model. The outliers elimination model is based on an aggregation scheme over two known statistical measures of χ2 and the Grubb’s test in
order to decide about the presence of outliers in theDi. The outcomes of the two outliers techniques are combined and then the signature is constructed overoutliers-free data.
Each datasetDiis updated over the time as data streams are produced by IoT devices at high rates. In our context, the QC
does not have any view on the data present in every dataset since data are not delivered to the Qc;onlytheir corresponding statistical signatures are delivered and updated regularly.
The QC receiving a queryqshould conclude on a matching degree between the query and the available signatures{Si}Ni=1.
Based on this matching, the QC should decide on the most appropriate subset P0 ⊂ P of QPs referring to those EDs
that will selectively execute the query q. Based on this partial engagement of the QPs, irrelevant ENs are excluded from the query execution thus avoiding providing results that do not match the query predicates. Hence, irrelevant nodes are not in-volved in the execution of queries whose data are not matched with the queries semantics (represented by predicates). We then formalize our problem:
Problem 1: Given an analytics query q to the QC and a set of N statistical signatures {Si}Ni=1 derived fromN ENs,
seek the most appropriate subset of QPs P0 ⊆ P which will
be engaged for executing the query q.
Fig. 1. The considered architecture with QCs and edge nodes.
IV. SCALING-OUTQUERIESASSIGNMENT
In this section, we elaborate on our methodology for finding the relevant subset P0 of the QPs given a random range
analytics queryqin the QC. We first introduce an aggregation mechanism for removing outlies from the ENs’ datasets before constructing the statisitcal signatures. Then, we provide the construction of the signatures and elaborating on the method-ology of selecting the most relevant ENs for query execution based on the query semantics and the signatures.
A. Aggregation-based Outliers Elimination
For detecting multivariate outliers in a dataset Di, we can rely on widely adopted techniques, which could be catego-rized to: (i) statistical-based (parametric or non-parametric approaches), (ii) nearest neighbor-based, (iii) clustering-based, (iv) classification-based (Bayesian network-based and sup-port vector machine-based approaches), and (v) spectral decomposition-based approaches. In this work we focus on the statistical methods that require less computational resources. We introduce an aggregation scheme of theχ2 metric and the
Grubb’s test [12] for the final outliers outcome. A data vector
x∈Di is considered as an outlier if theχ2-statistic exceeds a specific threshold, which is defined as:
χ2(x) = d X k=1 (xk−µk) 2 µk (2)
whereµk is thek-th mean value dimension of the mean vector
µ of the dataset Di. According to the central limit theorem whendis large (30), theχ2 has approximately a Gaussian
distribution [25]. The Grubb’s test is also adopted for outlier elimination providing the so-calledz-score for data vectorx∈
Di defined as: z(x) = maxmax(kx−µk)
k=1,...,d(σk). The vector x∈Di is
considered as an outlier when
z(x)≥|Dpi| −1 |Di| v u u t t2 α/(2|Di|),|Di|−2 |Di| −2 +t2α/(2|Di|),|Di|−2 (3) wheret2
α/(2|Di|),|Di|−2 is retrieved by the t-distribution at the
significance level ofα/(2|Di|).
Our outlier aggregation mechanism is based on a conjunc-tion of the outlier result determined byχ2(x)and Grubbz(x).
Specifically, let the outlier indicator functions be Iχ(x) = 1 and IG(x) = 1, respectively denoting that x is an outlier based on the above-mentioned statistics. Then, the vectorxis considered as an outlier in the datasetDiifIχ(x)∧IG(x) = 1; otherwise the data vector is not an outlier. This means that we require both methods should agree on the result. If there is a disagreement, x is not an outlier and is included in the construction of the statistical signatureSi.
B. Statistical Signature
The statistical signature Si of EN i is based on the data vectors inDi, which are not considered outliers based on the above-mentioned methodology, i.e.,D˜i={x∈Di :Iχ(x)∧
IG(x) = 0}. The basic statistics of the mean vector µ and the variances vectorσ are directly determined and efficiently incrementally updated from the outliers-free datasetD˜i. They are both used for matching with the query predicates, as will be discussed later. Now, for establishing the minimum sufficient statistics that can reflect the basis of the underling data, we use the first Kd principal components of the data vectors in
˜
Di that explain the α percentage of the inherent variance (normally α = 0.9). Specifically, we seek the eigenbase of the outlier-free dataD˜isuch that given an random data vector
y ∈ Rd we can efficiently determine if this vector can be reconstructed (derived from) from the eigenvectors of those data x∈D˜i. This is the rationale behind the concept of the signature where we extract the sufficient synopsis of the data deriving the most representative eigenvectors of D˜i. If the vector y can be explained by the eigenbase of D˜i then we draw the conclusion that y belongs (can be projected onto) to the subspace ofD˜i. Otherwise,yis considered statistically irrelevant toD˜i. In order to come up with this reasoning, we need first to derive theKPCs ofD˜iby adopting (incremental) PCA over the datasetD˜i.
In PCA over theD˜i, we seek thed×K matrix Wi of K column (eigen)vectors{wk}Kk=1that minimizes the objective:
min Wi∈Rd×K:W> iW=I X xj∈D˜i kxj−WiW>i xjk2, (4)
where kxk is the Euclidean norm of the vector x. That is, we try to find those K PCs in the eigenbase Wi such that
when we project ad-dim vector onto the subspace defined by those PCs, the error of the projection vector x˜ =WiW>i x and the actual vector x is minimized. Hence, we argue that if x belongs to this subspace then the projection error is the minimum w.r.t. theK PCs. We select the first K PCs, which are ordered by their eigenvalues λk, k = 1, . . . , K, such that the explain α(%) of the variances inD˜i. This is achieved by selecting the firstKPCs such that:K= min{K0: PK
0
k=1λk
Pd k=1λk ≥
α}. Given aprojection error tolerance >0and the eigenbase
Wi reflecting the sufficient eigenvectors from D˜i we infer that a random vectory∈Rd belongs to the subspace defined
by the PCs of D˜i iff its projection error ky−WiW>i yk ≤
; otherwise, the vector y is considered statistical irrelevant (cannot be explained from) toD˜i, or in other words it is highly unlikely to be observed in ENi. The statisitcal signatureSi=
{µi,σi,Wi}is then delivered to the QC. Note, the eigenbase
Wi can be incrementally updated with trivial computational complexity adopting well-known incremental PCA methods. The ENiregularly updates the QC with an updated signature
S0
i ={µ0i,σ0i,W0i}iff there is a significant difference inkµi−
µ0ik,kσi−σ0ikandkWi−W0ik; otherwise there is no meaning for an update.
C. Signature-based Query Assignment
The QC receives the signatures {Si}Ni=1 from all N ENs
in order to reason about the most relevant subset of QPs to engage for each analytics query. This means that, for each query q a different subset P0 of QPs is determined
engaging the corresponding ENs. Given an analytics query
q= [lk, uk]kd=1∈R2d, the QC derives itsd-dim center query
vector y = [lk+uk 2 ]
d
k=1 = [yk]dk=1 ∈ Rd, where each k-th
component yk refers to the center of k-th range predicate, i.e., yk = lk+2uk. The center query y is then projected onto each eigenbase Wi of EN i in order to judge whether the center predicate semantics are projected over the data subspace define by eachD˜i. If the vectoryis approximately considered to belong to the eigenbase Wi based on the error tolerance
ky−WiWi>yk ≤ then the associated QPiis a candidate to be engaged for the execution of this query. Otherwise, the dataset Di is not relevant for providing analytics results for the query q. In the case where the QP i is candidate for query q, we further examine if the underlying data are statistically sufficient (in number) to support the query. This is examined by using the ratio of data dimensions with
yk∈[µk−σk, µk+σk],k= 1, . . . , d. If we letI(yk) = 1if
|yk−µk| ≤σk; otherwise 0, we can then introduce thedegree
of engagement I(q,Si)of an analytics query to a QPi over the dataset Di of ENias:
I(q,Si) = 0 if ky−W iW>i yk> , 1 + 1dPd k=1I(yk) otherwise (5)
Hence, given a query q at the QC, we first derive its cen-ter query vector y and then for each QP i, we check its corresponding degree of engagement I(q,Si) based on the
signatureSi. Then, the QC determines the subsetP0(q)⊆ P
of those QPs withI(q,Si)>0, i.e.,
P0(q) ={pi∈ P:I(q,Si)>0}. (6) The QC assigns the analytics query q to the QPs belonging inP0(q)to execute that query over their corresponding ENs.
V. EXPERIMENTALEVALUATION
This section describes the experimental setup that has been employed to evaluate the proposed mechanism presented in Section IV. Furthermore, the performance metrics that have been used are presented alongside the comparison baseline, which has been established to examine the performance of our mechanism. The outcome of the performance assessment is discussed at the end of this section.
A. Setup
To evaluate our approach, we simulated a deployment scenario that involves four ENs that gather two-dimensional data over time. To make the experiments reproducible, a publicly available dataset has been chosen to simulate the data repositories of the ENs [28]. The dataset is composed of sensor readings that originate from four Raspberry Pis, each one attached to an Unmanned Surface Vehicle (USV)1. The
sensors gather temperature and humidity readings over time at the sea surface, hence, the two dimensional data vectors of our scenario. However, different nodes stop gathering data at different times. To compensate for that inconsistency, we chose the time at which the first USV node stops gathering data to indicate the end of the dataset. In this way, we maintain consistency through all nodes for data gathered before that time.
When the simulation commences, no data is available to the (USV) nodes. Instead, data is parsed gradually according to typical node behaviour. Once a predefined amount of data is available in an EN/USV, the method that builds the statistical signature for this last amount of data is triggered and builds the relevant statistical signature Si as defined in (1). All USV/nodes transmit their latest statistical signatures to the QC. In turn, the QC receives a four-dimensional analytics query randomly generated according to a uniform distribution which ranges between[0,40]for humidity and[0,60]for temperature attributed. The QC, based on the initial query qk, calculates the two-dimensional center query vector yk. Decisions on which nodes will accommodate the query are based on the mechanism described in Section IV-C. The error tolerance
defined in (5) is pre-determined to a certain value for each run of the experiment.
B. Performance Metrics
After queries are allocated to QPs, the responses are based on the available contextual data on each node. Prior to using the proposed method, the query would be allocated to every
QP in the network, i.e., the baseline solution engaging all
1The contextual data were derived from the experimentation EU-funded project GNFUV: https://sites.google.com/view/gnfuv/home
USVs. By using our proposed query allocation and execution mechanism, the amount of nodes that receive the query is expected to decrease because of the statistical irrelevance of their data. As a result, the data that will formulate the response to the query will be fewer and more relevant to the query, which is our desideratum. In order to evaluate this rationale, we calculate the total variance of the data existing in nodes after a query allocation: Vtotal0 =PN0
i=1σi, forN
0 =|P0(q)|
and compare it against the total variance of data across all
nodes (prior to applying the proposed mechanism) Vtotal =
PN
i=1σi, for N=|P|, where|P|is the cardinality of the set P.
After the query allocation phase is complete, the nodes that have been found to hold relevant data for the issued queries
are marked in order to examine the total node-involvement ratio per query. Theinvolvement ratiois defined as the number of nodes that were identified to hold relevant data over the total number of nodes r = N0
N, with 0 ≤ N
0 ≤ N. Such
involvement ratio provides a high-level metric of the resources that are utilized per query execution. By utilizing a portion of the nodes and thus having a small involvement ratio, the message exchanges are reduced and fewer query processing transactions are required. Maintaining a small involvement ratio r while accommodating the needs of queries translates to more efficient use of the available resources: this is an im-portant aspect when considering scenarios involving resource-constrained edge nodes, like the UxV environments.
C. Performance Assessment
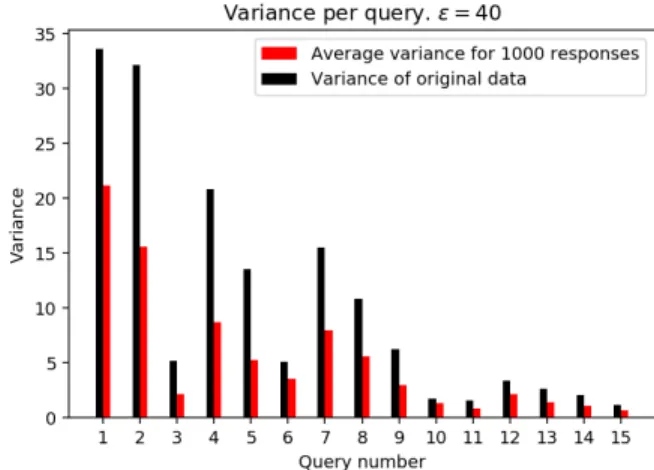
We set a comparison baseline by examining the case of not using the query allocation mechanism. In that case, the queries are allocated to every QP available in the edge network. After conducting experiments for this use case and obtain the aforementioned metrics, we repeat the experiments with the query allocation mechanism enabled. To ensure convergence of the obtained results, we conducted repeated experiments and used the average of the outcome. The query allocation mechanism was executed 1000 times over the previously described setup. The error tolerance was fixed, = 40 for the execution of the experiments. Since the data are gathered in batches before a statistical signature is built, to ensure synchronization between the queries we fixed the size of the batches to 40 rows, resulting in statistical signatures for data of 40 rows and 2 columns.
The results in Fig. 2 shows that the Vtotal0 values obtained through the use of the query allocation mechanism are sig-nificantly lower when compared with the values occurring when the mechanism is not in use. The observed variance decrease fluctuates between 30% −60%, depending on the query. The reduced variance indicates a higher quality of the query response as it will be based on data with smaller variance not including irrelevant contextual information.
In order to examine the relation of the reduced variance and the involvement ratio, we compared the two metrics in Fig. 3. The plot shows that variance decrease is, for the most of the time, inversely proportional to the involvement ratio. What
this reveals that data from nodes with irrelevant information are not included in the query execution process. This results from the selectivity of the statistical signatures, which are exploited to represent the current eigenbase of each contextual data space of each EN. Hence, incoming queries are directed to those ENs where the underlying contextual data space is relevant to the analytics query. The statistical relevance results to more accurate predictive analytics results and also to engage only those ENs holding relevance contextual data per query. Our mechanism succeeded in avoiding the use of unnecessary resources for responding to a query, by examining the statistical relevance of the data stored on each node,before
assigning a query.
In Table I, we included a summary of measurements of the average involvement ratio for different error tolerance values and batch sizes. Our aim is to determine the impact that the error tolerancehas on the involvement ratio. We found that regardless of the batch size, increasing values of the error tolerance lead to higher average involvement ratio.
Fig. 2. Comparison between the variance that a query is exposed to w.r.t. the baseline solution and our proposed mechanism.
Fig. 3. The involvement ratioris compared to variance decrease that occurs from our query allocation mechanism.
TABLE I
IMPACT OF ERROR TOLERANCEON EXPECTED INVOLVEMENT RATIOr.
Average involvement ratior
Batch size tolerance 30 40 50 20 0.225 0.21667 0.20834 30 0.425 0.38334 0.4375 40 0.6625 0.58334 0.47916 50 0.7625 0.88334 0.85416 60 0.9875 1 0.875 VI. CONCLUSIONS
In this work we proposed an edge-centric query allocation and execution mechanism for analytics queries based on the
statistical relevance of the edge nodes. The collected con-textual data stored in edge computing and sensing devices are exploited to attract only those analytics queries that are relevant for the underlying data sub-spaces and then being executed locally to significantly reduce latency. We propose a methodology where entities located in the Cloud undertake the responsibility of receiving analytics queries and decide on the most appropriate edge nodes for queries execution thus minimizing the redundant engagement of edge nodes holding irrelevant contextual data. The decision is based on statistical signatures (derived from the principal eigenvectors) of the datasets of nodes and the direct statistical matching between statistics and analytics queries. Our performance evaluation shows the advantages of our proposed schema in edge computing environments engaging only a subset of nodes relevant for incoming queries.
ACKNOWLEDGMENT
This research has been supported in part by the UK En-gineering and Physical Sciences Research Council (EPSRC) projects EP/N033957/1, and EP/P004024/1; by the European Cooperation in Science and Technology (COST) Action CA 15127: RECODIS – Resilient communication and services; and by the EU H2020 GNFUV Project RAWFIE-OC2-EXP-SCI (Grant No. 645220) under the EC FIRE+ initiative.
REFERENCES
[1] Al-Hoqani, N., ’In-Network On-Demand Query-Based Sensing System for Wireless Sensor Networks’, Wireless Comm.and Networking Conf. 2017, 1–6.
[2] Anagnostopoulos, C., Quality-optimized predictive analytics, Applied Intelligence, 45(4), 2016, pp. 1034–1046.
[3] Anagnostopoulos, C., Time-optimized contextual information forwarding in mobile sensor networks, J. Parallel and Distributed Computing, 74(5), 2014, pp. 2317–2332.
[4] Balkensen, C., Tatbul, N., ’Scalable Data Partitioning Techniques for Par-allel Sliding Window Processing over Data Streams’, 8th Int. Workshop Data Management for Sensor Networks, 2011.
[5] Cao, L., Rundensteiner, E., ’High Performance Stream Query Processing with Correlation-Aware Partitioning’, VLDB J., 7(4):265–276, 2013. [6] Cheng, N., et al., Vehicle-assisted device-to-device data delivery for smart
grid, IEEE Trans. on Vehicular Technology, 65(4): 2325–2340, 2016. [7] Chowdhery, A. et al., ’Urban IoT Edge Analytics’, Fog Computing in the
Internet of Things, Springer, 2018, 101–120.
[8] Diallo, O. et al., ’Real-time data management on wireless sensor net-works: A survey’, J. Netw. Computer Applications, 1013–1021, 2012. [9] Gabel, M., et al., Monitoring least squares models of distributed streams,
21th ACM SIGKDD, 319–328, 2015.
[10] Govindarajan, N. et al., Event processing across edge and the cloud for internet of things applications, IEEE MDM 2014, 101–104.
[11] Gedik, B., ’Partitioning Functions for Stateful Data Parallelism in Stream Processing’, VLDB J. 23(4):517–539, 2014.
[12] Han, J., Kamber, M., Pei, J., ’Data Mining, Concepts and Techniques’, Morgan Kaufmann Publ. 2012.
[13] Harth, N., and Anagnostopoulos, C., Quality-aware Aggregation & Predictive Analytics at the Edge, IEEE Big Data, 17–26, 2017. [14] Hu, L. et al., ’A Stream processing system for multisource heterogeneous
sensor data’, Sensors, 2016.
[15] Huacarpuma, R. C., at el., ’Distributed Data Service for Data Manage-ment in Internet of Things Middleware’, Sensors, 17, 2017.
[16] Kamath, G., et al., Pushing analytics to the edge, IEEE GLOBECOM, 1–6, 2016.
[17] Kolcun, R., McCann, J. A., ’Dragon: Data Discovery and Collection Architecture for Distributed IoT’, Int. Conf. on IoT, 2014.
[18] Kolomvatsos, K., ’An Intelligent Scheme for Assigning Queries’, Ap-plied Intelligence, 2018.
[19] Kolomvatsos, K., Hadjiefthymiades, S., ’Learning the Engagement of Query Processors for Intelligent Analytics’, Applied Intelligence, 46(1):96–112, 2017.
[20] Kolomvatsos, K., Anagnostopoulos, C., ’Reinforcement Machine Learn-ing for Predictive Analytics in Smart Cities’, Informatics, 4(16), 2017. [21] Mo, S. et al., ’TinyQP: A query processing system in wireless sensor
networks’, Intl Conf Web-Age Info Management, 788–791, 2013. [22] Quoc, H. N. M., et al., ’A learning approach for query planning on
spatio-temporal IoT data’, 8th Intl Conf Internet of Things, 2018. [23] Rahmani, A. M., ’Exploiting smart e-health gateways at the edge of
healthcare internet-of-things: A fog computing approach’, Future Gener-ation Computer Systems, 78:641–658, 2017.
[24] Widya, P. W., wet al., ’A oneM2M-Based Query Engine for Internet of Things (IoT) Data Streams’, Sensors, 18, 2018.
[25] Ye, N., Chen, Q., ’An Anomaly Detection Technique Based on a Chi-Square Statistic for Detecting Intrusions into Information Systems’, QRE International, 17:105–112, 2001.
[26] Zeitler, E., Risch, T., ’Scalable Splitting of Massive Data Streams’, DASFAA, vol 5982, Springer, 2010.
[27] Harth, N., Anagnostopoulos, C. ‘Edge-centric Efficient Regression An-alytics’, IEEE EDGE 2018, USA.
[28] GNFUV Unmanned Surface Vehicles Sensor Data. https:
//archive.ics.uci.edu/ml/datasets/GNFUV+Unmanned+Surface+Vehicles+ Sensor+Data+Set+2