Covenant Journal of Engineering Technology (CJET) Vol.1 No. 2, Dec. 2017
An Open Access Journal Available Online
Comparative Study of the use of Arithmetic Mean and
Geometric Mean for Data Aggregation in FMEA
Analysis
1
Ikuobase Emovon &
2Modestus Okechukwu Okwu
1,2Department of Mechanical Engineering,
Federal University of Petroleum Resources, Effurun, Nigeria
Abstract: Failure Mode and Effects Analysis (FMEA) is a commonly use approach for ranking risk of failure modes of most marine machinery system. However, the Risk Priority Number (RPN) use for evaluating risk within FMEA framework have several limitations and as such most researchers focus had been in the area of improvement of the tool without considering the effect of the aggregated data from multiple experts use as input into the decision making process. The purpose of this paper therefore, is to perform a comparative analysis of the aggregation techniques for combining multiple experts’ ratings of failure modes in order to establish their degree of similarity and their effect on the output of the ranking tools. The commonly used aggregation techniques in the literature considered are; Arithmetic Mean (AM) and Geometric Mean (GM). The index for comparison of the AM and GM was based on the effect of their respective aggregated data on the rank produced by four well known ranking tools; RPN of FMEA, Compromise Programming (CP), Vlsekriterijumska Optimizacija Ikompromisno Resenje, meaning: Multicriteria Optimization and Compromise Solution (VIKOR), Weighted Sum Model (WSM) and Weighted Product Model (WPM). A case study of fuel oil system of marine diesel engine of ship system was utilised to demonstrate the effectiveness of the two techniques.
Ikuobase E. & Modestus O. O. CJET (2017) 1(2) 24-39
Keyword: Arithmetic Mean, Geometric Mean, Failure modes, Aggregation techniques, MCDM, FMEA
1. Introduction
One of the major element of any maintenance system is risk assessment,
this is because generally the
maintenance strategy that need to be
implemented for plant system
maintenance will depend on it degree of risk. Failure Mode and Effect Analysis (FMEA) is popular technique for evaluating risk of failure modes of most industrial system. FMEA fundamentally carried out three functions. These are (Ben-Daya 2009): (1) to identify potential failures together with their causes and effects, (2) to estimate and rank identified failure modes and (3) to recommend actions to either mitigate or probably eliminate the chance of the
potential failures from occurring.
FMEA utilises RPN in estimating risk of failure and RPN is a product of three decision criteria; Occurrence of failure (O), Severity of the failure (S) and Detectability of the failure (D).
The application of the technique in evaluating risk have been reported in literature. Souza and Alvares (2008) proposed FMEA in conjunction with Fault Tree Analysis (FTA) as a risk assessment tool for application within the framework of Reliability Centred Maintenance (RCM). Cicek and Celik (2013) applied the FMEA in prioritising risk of crankcase failures of ship main engine. Cicek et al., (2010) used the approach to estimate risk of fuel oil system of marine diesel engine. Sankar and Prabhu (2000) applied FMEA to prioritise risk of failure of a cooling sub-system in an off-shore plant. However, the conventional FMEA had been criticised in the literature to have several limitations such as the inability to utilise more than three decision
criteria in determining risk. On the basis of the limitations different enhanced FMEA approaches were developed and reported in the literature. For example, the Multi-Criteria Decision Making (MCDM) tool such as COPRAS, VOKOR and WSM had been applied in enhancing FMEA in the literature.
Vahdani, (2015) utilised TOPSIS in enhancing FMEA for effective ranking
of failure modes. Emovon et al., (2015)
proposed the use of VIKOR technique for prioritising risk of failure modes of marine machinery system. In a similar
research, Emovon (2016) applied
integrated Dempster Shafer Theory and ELECTRE method for estimating risk of various equipment items of a marine diesel engine. Braglia, (2000) utilised AHP methodology in prioritising risk of failure modes. Sachdeva et al. (2009) used an integrated Shannon’s entropy and TOPSIS techniques for risk assessment of a digester of a paper manufacturing plant in India. Zhao et al., (2017) proposed the use of
MULTIMOORA combined with
entropy for the ranking of failure modes.
Researchers have been much concerned about continuous improvement of
ranking tools for effective risk
prioritisation without considering the effectiveness of tools applied for aggregating data used as input into the ranking tools. There are basically two
aggregating techniques commonly
applied for aggregating failure modes ratings obtained from multiple experts. They are; Arithmetic Mean (AM) and Geometric Mean (GM) techniques. In this paper a comparative analysis of the aforementioned methods is carried out in order to establish how they compare
and their effects on the output of the ranking tools.
2. Methodology
2.1 Experts ratings aggregation methods
Averaging is the most frequently applied technique for combining inputs and it is regularly use in statistical analysis, multi-criteria decision making
among others (Beliakov et al., 2016). In
this paper, two most commonly used averaging function are considered for the aggregation of group experts ratings of failure modes (alternatives) in a group multi-criteria decision making process. They are; Arithmetic Mean (AM) and Geometric Mean (GM). The ratings assigned by multiple
experts which are tagged for
aggregation are usually represented in the form of a decision matrix. The decision matrix formed as a result of z experts’ ratings of failure modes i with respect to criteria j is expressed as:
2.1.1 Arithmetic Mean (AM)
AM of the ratings assigned to alternative i based on certain criteria j by z number of experts can be expressed as:
2.1. 2 Geometric Mean (GM)
GM of the assigned ratings to alternative i with respect to criteria j by z number of experts can be expressed as follows:
2.2 Ranking tools
2.2.1 FMEA
CEIEN 60812 Standard (2006) define FMEA as a methodology for industrial system analysis in order to identify potential failure modes and their
corresponding effects on the
performance of the system. FMEA uses RPN to estimate the risk contribution of each failure modes to the system and it is expressed as a product of probability of failure Occurrence (O), Severity of failure (S) and Detection of failure probability (D)
RPN = O x S x D (4) The ratings to O, S and D are commonly assigned by experts based on their judgement using a pre-determined scale. See an example in the work of Cicek and Celik (2013).
2.2.2 MCDM method
The most regularly used method for making decision involving more than one criteria is the Multi-Criteria Decision Making (MCDM) tool. There are many variant of the MCDM which
include among others; VIKOR,
TOPSIS, CP, WSM and WPS. The different types of MCDM tools have been applied in the literature in the modelling and solving diverse multi-criteria problems in various fields of human endeavour. In this paper; CP, VIKOR, WSM and WPM are applied as alternative to RPN of the FMEA in prioritising risk of failure modes. 2.2.2.1 Compromise Programming (CP) In the year 1973 the CP method was proposed by Po-lung Yu and Milan Zeleny (Zeleny, 1982). The approach has since by applied in the literature in
addressing different multi-criteria
decision problem. The aim is to obtain a solution that is closest to the ‘ideal’ solution. This can be achieve by
comparing distances of different
Ikuobase E. & Modestus O. O. CJET (2017) 1(2) 24-39
alternatives at various points to a particular reference point refer to as the ideal point. The alternative with the shortest distance to the reference point is the optimal solution. Diaz-Balteiro et al. (2011) proposed the use of CP technique for the ranking of seventeen European countries based on the sustainability of their paper industries. Amiri et al., (2011) used the approach for selection of portfolio based on 35 stock indices of Iranian stock market. Phua and Minowa (2005) applied the
technique for forest conservation
planning.
The steps involved in the CP analysis are as follows:
Step 1. The best and worst values evaluation for each criterion.
The best and worst values for each criterion are evaluated as follows:
Where
is the best value for criterion,
and
is the worst value for the criterion.
Step 2. Evaluation of the performance index
The performance index is evaluated using the best and worst values as follows:
Subject to 1 ≤ ≤
In this paper, the value of was
denoted as 2 because this is the value generally applied in the literature (Phua and Minowa, 2005; Zeleny, 1982).
The alternatives are ranked based on the performance index and the smaller the value the better the alternative.
2.2.2.2 VIKOR method
The VIKOR technique is an MCDM tool which select a compromise solution using an index based on a measure of closeness to the positive ideal solution (Opricovic and Tzeng, 2004). The alternatives with the highest and lowest values with regard to risk criteria are the positive and negative ideal solutions respectively (Chu et al., 2007) while the optimum or compromise solution is the alternative farthest to the negative ideal solution. The application of the VIKOR technique in addressing different multi-criteria decision problems have been reported in the literature. Pamucar et al., (2017) applied the method to select the best location of a logistical center. Hsu et al., (2012) used the approach in the selection of vendors. Anojkumar et al., (2014) applied the technique in material selection problem.
The steps in the VIKOR analysis are as follows (Çalişkan et al., 2013):
Step 1. Determination of the utility measure and regret measure.
The best and worst values, determined using Equation 4 are applied as input data to determine utility and regret measures as follows:
Where
is the weight of criterion s
is the utility measure is the regret measure
Step 2. Evaluation of the performance index
The performance index is expressed as:
Where can be any value from 0 to 1
and is generally set at 0.5 (Çalişkan et al., 2013). The ranking of the alternative is based on the performance index and the smaller the value the better the alternative.
2.2.2.3 Weighted Sum Model (WSM) The WSM is the simplest form of MCDM technique and it utilises a linear relationship in the decision making process (Zardari et al., 2015). The approach have been applied in the literature in addressing various decision problem involving conflicting decision
criteria. For example, Triantaphyllou
and Mann, (1989) demonstrate the effectiveness of the approach using a numerical example.
The steps involves in the WSM analysis
are (Chakraborty and Zavadskas, 2014):
Step 1: Normalisation of decision The normalisation method depend on the type of criteria which is either
beneficial or non-beneficial. The
normalisation of the beneficial criteria is carried out using the following expression:
While the non-beneficial criteria
normalisation is performed as follows:
Step 2: Performance index evaluation
The performance index of alternative ith
using WSM is evaluated as follows:
The alternatives are ranked based on the evaluated performance index and the higher the value the better the alternative.
2.2.2.4 Weighted Product Model (WPM)
The WPM is a modified WSM designed in a way to avoid some of its limitations
(Triantaphyllou and Mann, 1989).
The WPM begin with normalisation of the decision matrix using either Equations 9 or 10. The performance of
alternative ith is then evaluated as
follows (Chakraborty and Zavadskas,
2014):
The alternatives are ranked with respect to the performance index, pQi, and the optimal solution is the one with the highest value of pQi.
3. Case Study
To demonstrate the effectiveness of AM and GM techniques as tool for aggregating multi experts ratings of alternatives, comparative analysis was conducted in search for better solution using a case study of fuel oil system of
Ikuobase E. & Modestus O. O. CJET (2017) 1(2) 24-39
marine diesel engine of a ship system. Ten failure modes of the fuel oil system were identified for some equipment items of the system. The failure modes
together with the failure causes, effects of the failure and failure detection scheme of the system are presented in Table 1
.
Table 1 Failure modes of fuel oil system FM # Failure modes Equipme nt items Failure cause
Local effects Global effects Detectio n system 1 pipe leakage/ rupture, sludge in fuel line Fuel system- pipes, filter deposits, low quality fuel oil Hot spot , fuel oil spill
Stop engine, fire probable Visual, high temperat ure deviation , 2 Clogged fuel filter Fuel system- pipes, filter Contamin ants, Lack of maintena nce Restriction in fuel flow (low fuel pressure), erratic cylinder firing Engine speed drop, stop engine Different ial pressure alarm 3 Low supply pressure High pressure fuel pump Suction valve opens too early or late Engine operates erratically Reduced engine performan ce, stop engine Low pressure alarm 4 Running without oil Transfer/ supply/B ooster pump Wear-out gear Low supply pressure Reduce output from engine ,, 5 Abnormal sound Transfer/ supply/B ooster pump Bearing defective/ shaft displacem ent Overloading of electric motor Reduce output from engine ,, 6 Fuel valve leaked Fuel valve Erosion, deposits Excessive temperature after individual unit dropped Reduce output from engine, hot spot High exhaust temperat ure alarm 7 Seizure of injection valve spindle in open position Fuel valve Control system failure Excessive fuel injected into the affected cylinder, high exhaust temperature, black smoke Reduced engine performan ce, environme ntal damage High exhaust temperat ure alarm 29
8 Fuel valve nozzle obstructed Fuel valve Inadequat e maintena nce, incorrect fuel temperatu re, contamin ants, poor fuel quality Poor combustion, discolored exhaust Reduced engine performan ce, followed by engine failure High exhaust temperat ure alarm 9 Early opening of fuel valve Fuel valve Low service pressure Rough running, loss of compression and poor starting Reduced engine performan ce Low pressure alarm 10 Dripping Fuel valve Oversized injection mechanis ms Sticking of piston rings in their groove Reduced engine performan ce, engine damage High exhaust temperat ure alarm
For each of the failure modes, ratings assigned by three experts are presented in Table 2. Expert 1 rating in Table 2 were an agreed consensus rating of the ten failure modes from multiple experts
obtained from the work of Emovon (2016). Expert 2 and 3 ratings were generated to be within close range of Expert 1 ratings.
Table 2 Failure Mode Ratings
Failure modes
Expert 1 Expert 2 Expert 3
O S D O S D S O D 1 6 7 2 8 6 3 6 8 4 2 6 7 2 7 6 4 5 9 3 3 5 8 5 4 7 3 4 7 3 4 5 8 5 7 7 5 7 6 5 5 6 7 4 5 9 6 8 9 3 6 5 7 2 4 8 3 6 7 2 7 4 9 2 6 7 2 3 6 4 8 5 8 2 4 6 4 8 9 2 9 6 7 6 8 8 5 8 7 5 10 4 8 2 2 9 2 6 6 4 30
4. Case Study Analysis
4.1 Experts ratings aggregation The experts’ 1, 2 and 3 ratings in Table 2 are aggregated using Equations 2 and
3 to obtain AM and GM ratings of failure modes respectively and the results are shown in Table 3.
Table 3 AM and GM values of failure modes
Failure modes AM GM O S D O S D 1 6.6667 7.0000 3.0000 6.6039 6.9521 2.8845 2 6.0000 7.3333 3.0000 5.9439 7.2304 2.8845 3 4.3333 7.3333 3.6667 4.3089 7.3186 3.5569 4 6.3333 7.0000 5.0000 6.2573 6.9521 5.0000 5 6.3333 8.3333 4.3333 6.2145 8.2768 4.1602 6 5.0000 7.3333 2.3333 4.9324 7.3186 2.2894 7 4.3333 7.3333 2.6667 4.1602 7.2304 2.5198 8 5.6667 7.6667 2.6667 5.4288 7.5595 2.5198 9 7.3333 7.3333 5.3333 7.2685 7.3186 5.3133 10 4.0000 7.6667 2.6667 3.6342 7.5595 2.5198
The AM and GM ratings or values are then use as input into the different failure mode ranking techniques.
4.2 Comparative analysis of AM and GM
The AM and GM techniques are compared by inputting both aggregated ratings in Table 3 into each of the ranking tools; RPN, CP, VIKOR, WSM and WPM in turns to determine the similarity of the AM and GM data aggregation approach and their effect on the ranking tools.
4.2.1 Comparative analysis of AM and GM based on RPN
The AM and GM aggregated ratings of failure modes in Table 3 was used as input data in turns into Equation 4 to obtain RPN of failure modes of fuel oil system based on AM and GM respectively. The RPN of failure modes and corresponding ranking obtained based on AM and GM data are presented in Table 4.
Table 4 Comparison of AM and GM based on RPN failure modes rankings
FM # AM GM O S D RPN Rank O S D RPN Rank 1 6.6667 7.0000 3.0000 140.0 4 6.6039 6.9521 2.8845 132.4 4 2 6.0000 7.3333 3.0000 132.0 5 5.9439 7.2304 2.8845 124.0 5 3 4.3333 7.3333 3.6667 116.5 6 4.3089 7.3186 3.5569 112.2 6 4 6.3333 7.0000 5.0000 221.7 3 6.2573 6.9521 5.0000 217.5 2 5 6.3333 8.3333 4.3333 228.7 2 6.2145 8.2768 4.1602 214.0 3 31
6 5.0000 7.3333 2.3333 85.6 8 4.9324 7.3186 2.2894 82.6 8
7 4.3333 7.3333 2.6667 84.7 9 4.1602 7.2304 2.5198 75.8 9
8 5.6667 7.6667 2.6667 115.9 7 5.4288 7.5595 2.5198 103.4 7
9 7.3333 7.3333 5.3333 286.8 1 7.2685 7.3186 5.3133 282.6 1
10 4.0000 7.6667 2.6667 81.8 10 3.6342 7.5595 2.5198 69.2 10
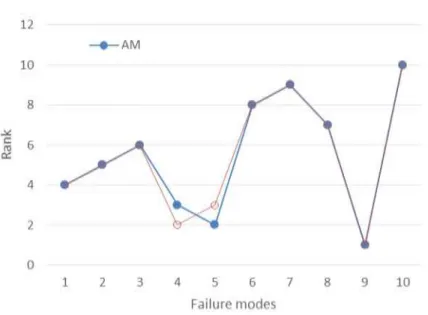
The ranks of failure modes obtained based on AM and GM data are also presented in Figure 1. From Table 4 and Figure 1, Failure mode 1, 2, 3, 6, 7, 8, 9 and 10 have the same rank when both AM and GM data are applied as input data while Failure mode 4 and 5 have
one rank difference in between. From the comparative analysis, it is obvious that the ranking obtained for both AM and GM being applied as input data in RPN for the ranking of failure modes are almost completely the same.
Fig. 1 Comparison of AM and GM based on RPN failure modes rankings
4.2.2 Comparative analysis of AM and GM based on CP
The first step in the comparative analysis of AM and GM is the determination of the weight of decision criteria; O, S and D. The entropy method was applied to estimate weights of decision criteria. The results for O, S and D are 0.3081, 0.0197 and 0.6722 respectively when AM data in Table 3 was applied into entropy methodology
while the weights for O, S and D are 0.3162, 0.0171 and 0.6667 respectively when GM data also in Table 3 are used as input data into entropy method. The CP performance index of the failure modes is then evaluated using Equation 5 and 6 on AM and GM decision matrix data in Table 3 and criteria weights.
The performance index and
corresponding rank obtained for failure modes based on AM and GM input data
Ikuobase E. & Modestus O. O. CJET (2017) 1(2) 24-39
are shown in Table 5. The ranks of failure modes obtained based on AM
and GM data are also presented in Figure 2.
Table 5 Comparison of AM and GM based on CP failure modes rankings
FM# AM GM CP Rank CP Rank 1 0.2768 5 0.2911 5 2 0.2859 6 0.3029 6 3 0.2024 4 0.2297 4 4 0.0129 2 0.0143 2 5 0.0572 3 0.0747 3 6 0.4900 10 0.4942 9 7 0.4199 8 0.4673 8 8 0.3765 7 0.4102 7 9 0.0002 1 0.0002 1 10 0.4345 9 0.4994 10
Fig. 2 Comparison of AM and GM based on CP failure modes rankings
From Table 5 and Figure 2, in almost all the failure modes, the same rank was obtained when both AM and GM data are applied as input data with the exception of failure mode 6 and 10 which has one rank difference in between. Again comparative analysis of AM and GM, showed that the ranking
of failure modes are almost completely the same when AM and GM data are used as input data.
4.2.3 Comparative analysis of AM and GM based on VIKOR
Using VIKOR method as the basis of comparison of AM and GM, firstly the best and worst values of failure modes
are determined using Equation 5 on AM and GM data in Table 3. This is followed by the determination of the utility and regret measures, by applying Equations 7 and 8 on the estimated decision criteria weights and the best
and worst values. Finally, the
performance index of each failure
modes based on AM and GM data are determined using Equation 9 and the results are presented in Table. Based on the performance index, the failure modes are ranked and the results for both AM and GM are compared as shown in Table 6.
Table 6 Comparison of AM and GM based on VIKOR failure modes rankings
FM # AM GM Qi Rank Qi Rank 1 0.7136 5 0.7216 5 2 0.7450 6 0.7506 6 3 0.6340 4 0.6335 4 4 0.1546 2 0.1448 2 5 0.3267 3 0.3644 3 6 0.9929 10 0.9682 10 7 0.9288 8 0.9388 8 8 0.8577 7 0.8771 7 9 0.0000 1 0.0000 1 10 0.9432 9 0.9612 9
From Table 6, same rankings of failure modes were obtained when both the AM and GM data were applied as input into the VIKOR technique.
4.2.4 Comparative analysis of AM and GM based on WSM
In comparing AM and GM based on WSM ranking of failure modes, the process starts with normalisation of decision matrix in Table 3 using Equation 10. The normalised matrix
and the evaluated decision criteria weights is then applied as input into Equation 12 to determined WSM performance index. The performance index and corresponding rankings obtained for failure modes when AM and GM aggregated data are used as input into WSM are presented in Table 7. The ranking of failure modes based on AM and GM data are also presented in Figure 4.
Ikuobase E. & Modestus O. O. CJET (2017) 1(2) 24-39 Table 7 Comparison of AM and GM based on WSM failure modes rankings
FM# AM GM WSM Rank WSM Rank 1 0.6776 7 0.6768 7 2 0.6504 5 0.6488 5 3 0.6650 6 0.6602 6 4 0.9175 9 0.9125 9 5 0.8360 8 0.8319 8 6 0.5237 1 0.5223 2 7 0.5380 3 0.5352 3 8 0.5948 4 0.5934 4 9 1.0027 10 0.9979 10 10 0.5248 2 0.5216 1
Fig 4 Comparison of AM and GM based on WSM failure modes rankings
From Figure 4, rankings obtained when AM and GM data are used as input into WSM are the same for failure modes 1,2,3,4,7 and 8 and slightly different for failure mode 5, 6, 9 and 10 with each having a rank difference of one between failure modes. Conclusively, ranking obtained for failure modes for both AM and GM data are relatively similar. 4.2.5 Comparative analysis of AM and GM based on WPM
To compare AM and GM methods based on WPM, decision matrix for
both AM and GM input data are normalised firstly. The normalised matrix and the evaluated decision criteria weights for AM and GM are applied as input into Equation 13 to produce WPM performance index for failure modes. The WPM performance index and corresponding rank for failure modes are shown in Table 8. The ranks for failure modes in both cases are also presented in Figure 5.
Table 8 Comparison of AM and GM based on WPM failure modes rankings FM# AM GM WPM Rank WPM Rank 1 0.3257 6 0.3261 7 2 0.3156 5 0.3156 5 3 0.3267 7 0.3255 6 4 0.4520 9 0.4510 9 5 0.4120 8 0.4112 8 6 0.2520 1 0.2520 1 7 0.2638 3 0.2633 3 8 0.2868 4 0.2868 4 9 0.4943 10 0.4936 10 10 0.2576 2 0.2569 2
Fig 5 Comparison of AM and GM based on WPM failure modes rankings
From Figure 5, failure modes 2, 4, 5, 6, 7, 8, 9 and 10 representing 80% of the total failure have the same rank for both AM and GM aggregating technique
while failure modes 1 and 3
representing 20% of the total failure modes have a difference of one rank in between failure modes. The rank
obtained in both scenario; AM and GM are almost completely the same. 5. Conclusion
In this paper two techniques are presented for the aggregation of experts assigned ratings for failure modes of marine machinery system. The two techniques are AM and GM. To
Ikuobase E. & Modestus O. O. CJET (2017) 1(2) 24-39
ascertain the effectiveness of the two approaches, a comparative analysis was performed in search of the better option using a case study of fuel oil system of marine diesel engine of a ship system. To achieve the paper objective, ratings assigned to failure modes of fuel oil system were aggregated with both AM and GM techniques. The aggregated ratings obtained by both methods were then used input data into RPN of FMEA, CP, VIKOR, WSM and WPM for the ranking of failure modes. The comparative analysis revealed that when AM and GM data are applied as input into RPN, CP and WPM, almost completely same ranking for failure modes were produced in both cases while when applied as input into VIKOR method, same result were generated for failure modes in both scenarios. However, when AM and GM data are applied as input into the WSM method significant difference in failure modes ranking were observed in both scenarios. Conclusively, the level of similarity between the AM and GM depend on the ranking tool applied for the prioritising failure modes. It can further be concluded, that VIKOR method is most stable of all the ranking methods having produced same ranking for failure modes irrespective of the aggregated data applied as input into the methodology.
References
Amiri, M., Ekhtiari, M. and Yazdani, M., 2011. Nadir compromise
programming: A model for
optimization of multi-objective
portfolio problem. Expert
Systems with Applications, 38(6), pp.7222-7226.
Beliakov, G., Sola, H.B. and Sánchez, T.C., 2016. A practical guide to
averaging functions (Vol. 329). Heidelberg: Springer.
Ben-Daya, M., 2009. Failure mode and effect analysis. In Handbook of maintenance management and engineering (pp. 75-90). Springer London.
Braglia, M., 2000. MAFMA: Multi-attribute failure mode analysis. International Journal of Quality and Reliability Management 17 (9), 1017-1034.
Çalişkan, H., Kurşuncu, B.,
Kurbanoĝlu, C., Güven, T.Y., 2013. Material selection for the tool holder working under hard milling conditions using different multi criteria decision making methods. Materials and Design 45, 473-479.
Cicek, K. and Celik, M., 2013. Application of failure modes and effects analysis to main engine crankcase explosion failure on-board ship. Safety Science, 51(1), pp.6-10.
Cicek, K., Turan, H.H., Topcu, Y.I. and Searslan, M.N., 2010, March.
Risk-based preventive
maintenance planning using
Failure Mode and Effect Analysis
(FMEA) for marine engine
systems. In Engineering Systems Management and Its Applications
(ICESMA), 2010 Second
International Conference on (pp. 1-6). IEEE.
CEIEN 60812 Standard (2006),
Analysis techniques for system reliability – Procedure for failure
mode and effects analysis
(FMEA).
Chakraborty, S. and Zavadskas, E.K., 2014. Applications of WASPAS
method in manufacturing
decision making. Informatica, 25(1), pp.1-20.
Chu, M.-T., Shyu, J., Tzeng, G.-H., Khosla, R., 2007. Comparison among three analytical methods
for knowledge communities
group-decision analysis. Expert Systems with Applications 33 (4), 1011-1024.
Diaz-Balteiro, L., Voces González, R.,
Romero, C., 2011. Making
sustainability rankings using
compromise programming. An application to European paper industry. Silva Fennica 45 (4), 761-773.
Emovon, I. (2016) Failure Mode and Effects Analysis Of Ship Systems using an integrated Dempster Shafer Theory And ELECTRE Method, Journal of Advanced
Manufacturing Technology,
10(1), p45-60.
Emovon, I., Norman, R.A., Murphy, A.J. and Pazouki, K., 2015. An integrated multicriteria decision
making methodology using
compromise solution methods for
prioritising risk of marine
machinery systems. Ocean
Engineering, 105, pp.92-103. Hsu, C.H., Wang, F.-K., Tzeng, G.-H.,
2012. The best vendor selection
for conducting the recycled
material based on a hybrid MCDM model combining DANP
with VIKOR. Resources,
Conservation and Recycling 66 (0), 95-111.
Opricovic, S., Tzeng, G.H., 2004. Compromise solution by MCDM methods: A comparative analysis
of VIKOR and TOPSIS.
European Journal of Operational Research 156 (2), 445-455.
Pamučar, D.S., Božanić, D. and Ranđelović, A., 2017. Multi-criteria decision making: An example of sensitivity analysis. Serbian Journal of Management, 12(1), pp.1-27.
Phua, M.-H., Minowa, M., 2005. A GIS-based multi-criteria decision
making approach to forest
conservation planning at a
landscape scale: a case study in
the Kinabalu Area, Sabah,
Malaysia. Landscape and Urban Planning 71 (2–4), 207-222. Ravi Sankar, N. and Prabhu, B.S., 2001.
Modified approach for
prioritization of failures in a system failure mode and effects analysis. International Journal of
Quality & Reliability
Management, 18(3), pp.324-336. Sachdeva, A., Kumar, P., Kumar, D.,
2009. Maintenance criticality
analysis using TOPSIS, 2009 IEEE International Conference on
Industrial Engineering and
Engineering Management, Hong Kong, pp. 199-203.
Triantaphyllou, E. and Mann, S.H., 1989. An examination of the
effectiveness of
multi-dimensional decision-making
methods: a decision-making
paradox. Decision Support
Systems, 5(3), pp.303-312.
Vahdani, B., Salimi, M. and
Charkhchian, M., 2015. A new FMEA method by integrating
fuzzy belief structure and
TOPSIS to improve risk
evaluation process. The
International Journal of
Advanced Manufacturing
Technology, 77(1-4), pp.357-368. Zardari, N.H., Ahmed, K., Shirazi, S.M. and Yusop, Z.B., 2015. Literature
Ikuobase E. & Modestus O. O. CJET (2017) 1(2) 24-39
Review. In Weighting Methods and their Effects on Multi-Criteria Decision Making Model Outcomes in Water Resources Management (pp. 7-67). Springer International Publishing.
Zeleny, M., 1982. Multiple Criteria Decision Making. McGraw-Hill.
Zhao, H., You, J.X. and Liu, H.C., 2017. Failure mode and effect analysis using MULTIMOORA method with continuous weighted
entropy under interval-valued
intuitionistic fuzzy environment. Soft Computing, 21(18), pp.5355-5367.