A Framework for Creating
Production and Inventory Control Strategies
By
OLADIPUPO A. OLAITAN
B.Sc., M.Sc.
A DISSERTATION SUBMITTED IN FULFILMENT OF THE
REQUIREMENTS FOR THE AWARD OF
DOCTORATE OF PHILOSOPHY (Ph.D.)
Supervisors:
Dr. John Geraghty
Dr. Paul Young
Dublin City University
School of Mechanical & Manufacturing Engineering
January 2016
I
I hereby certify that this material, which I now submit for assessment on the programme of study leading to the award of Doctor of Philosophy (PhD) is entirely my own work, that I have exercised reasonable care to ensure that the work is original, and does not to the best of my knowledge breach any law of copyright, and has not been taken from the work of others save and to the extent that such work has been cited and acknowledged within the text of my work.
II
ACKNOWLEDGEMENTS
First, I give gratitude to God for his protection and direction through these years. I also appreciate my parents for their guidance and for taking the right decisions for me at the early years of my education.
I wish to give special thanks to my supervisors (Dr. John Geraghty and Dr. Paul Young) for their support in a lot of ways. I cannot thank you enough for giving me the opportunity to achieve this. I am grateful for the opportunity to work on the DREAM project and for your unrelenting support throughout the project. I could not have wished for a better opportunity than that which made it possible for me to collaborate internationally and solve real life industry problems.
I also wish to thank Dr. Anna Rotondo for her support, both in the DREAM project and in my PhD research. Your hard work and willingness to undertake a major share of the tasks for the DREAM project provided me with a lot a room to manage my commitments to both activities.
I would like to thank the reviewers that I have had through the course of this research – Dr. Lorna Fitzsimons and Dr. Dermot Brabazon.
I am grateful to my siblings – Dolamu, Kunle, Tope and Bukky – for their encouragements, and also for being good examples to look up to.
Finally, to everyone who has in one way or the other contributed to my success, I want you to know that I am grateful.
III
TABLE OF CONTENTS
Page DECLARATION ... I ACKNOWLEDGEMENTS ... II TABLE OF CONTENTS ... III LIST OF FIGURES ... VIII LIST OF TABLES ... X LIST OF ABBREVIATIONS AND NOTATIONS ... XII ABSTRACT ... XV
CHAPTER - 1: Introduction ... 1
1.1 BACKGROUND ... 1
1.2 MOTIVATION AND OBJECTIVES ... 2
1.3 STRUCTURE OF THESIS ... 3
CHAPTER - 2: Literature Review ... 5
2.1 INTRODUCTION ... 5
2.2 PRODUCTION CONTROL STRATEGIES ... 6
2.2.1 Materials Requirements Planning – A Push Strategy ... 6
2.2.2 Traditional Kanban Control Strategy – A Pull Strategy ... 7
2.2.3 Constant Work in Progress (CONWIP) ... 9
2.2.4 Base Stock Control Strategy (BSCS) ... 10
2.2.5 Extended Kanban Control Strategy (EKCS) ... 11
2.2.6 Generalized Kanban Control Strategy (GKCS) ... 12
2.3 OTHER CLASSES OF PRODUCTION CONTROL STRATEGIES.... ... 14
2.3.1 Bottleneck and Workload Oriented Concepts ... 14
2.3.2 Product Grouping Concepts ... 15
2.3.3 Flexible or Adaptive Control Strategies ... 16
IV
2.4.2 Other Hybrid Strategies ... 18
2.5 EXTENSION OF PULL PRODUCTION CONTROL STRATEGIES TO MULTIPRODUCT MANUFACTURING ENVIRONMENTS . ... 18
2.5.1 Kanban Allocation Policies ... 19
2.5.2 Dedicated Kanban Allocation Policy (DKAP) ... 20
2.5.3 Shared Kanban Allocation Policy (SKAP) ... 20
2.5.4 Logic of Operation of Kanban Allocation Policies Under EKCS and GKCS ... 22
2.6 HYBRID KANBAN ALLOCATION POLICY ... 25
2.7 SIMULATION MODELLING AND OPTIMISATION ... 28
2.7.1 Simulation Warmup Period ... 29
2.7.2 Simulation Run Length and Number of Replications ... 30
2.7.3 Performance Measures ... 31
2.8 MANUFACTURING SYSTEM OPTIMIZATION ... 33
2.8.1 Optimisation of Multiproduct Systems ... 35
2.8.2 Robustness of Pull Production Control Strategies ... 37
2.8.3 Design of Experiments for Sensitivity Analysis ... 38
2.9 REVIEW OF TECHNIQUES AND TOOLS FOR DESIGN OF EXPERIMENTS AND RESULTS ANALYSIS ... 39
2.9.1 Latin Hypercube Sampling for Design of Experiments ... 39
2.9.2 Stochastic Dominance Test of Robustness ... 40
2.9.3 ExtendSim – Simulation Modelling ... 42
2.9.4 JMP – LHS Design of Experiments and Results Analysis ... 42
2.9.5 ModelRisk – Stochastic Dominance Tests ... 42
2.10 KEY INSIGHTS FOR THIS RESEARCH FROM REVIEWED LITERATURE ... 43
CHAPTER - 3: Research Outline and Preliminary Comparison of Control Strategies ... 44
3.1 INTRODUCTION ... 44
3.2 RESEARCH OUTLINE ... 45
3.3 PRELIMINARY COMPARISON OF STRATEGIES ... 45
V
Demand Variability ... 48
3.4.2 System Assumptions ... 49
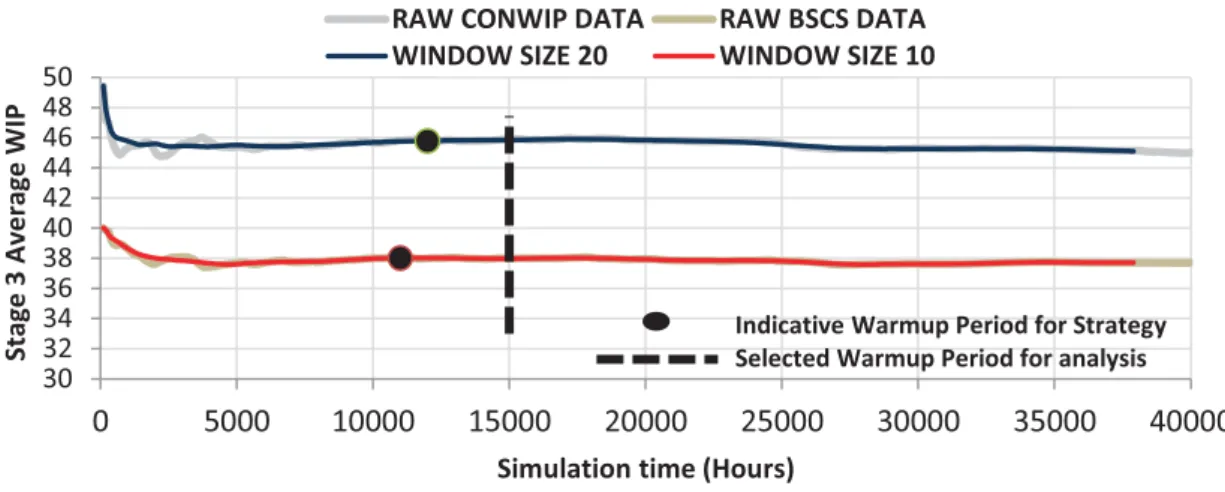
3.4.3 Simulation Warmup Period ... 50
3.4.4 Simulation Run Length and Number of Replications ... 51
3.4.5 Common Random Number Seeds ... 52
3.5 SYSTEM OPTIMISATION... 53
3.6 DESIGN OF EXPERIMENTS FOR SENSITIVITY ANALYSIS ... 56
3.7 RESULTS FROM SCENARIO 1: HIGH PRODUCT 1 VARIABILITY – LOW PRODUCT 2 VARIABILITY ... 57
3.7.1 Robustness of Products’ Service Levels ... 57
3.7.2 Inventory Control Effectiveness of Strategies ... 60
3.7.3 Insights into Robustness of Strategies ... 61
3.7.4 Insights into Performance of Kanban Allocation Policies ... 62
3.8 CONCLUSIONS ... 65
CHAPTER - 4: Evaluation of Kanban Allocation Policies ... 66
4.1 INTRODUCTION ... 66
4.2 SECOND SET OF EXPERIMENTS FOR POLICY COMPARISONS ... 67
4.3 SYSTEM OPTIMISATION... 67
4.4 RESULTS FROM COMPARISON OF POLICIES FOR EKCS AND GKCS ... 69
4.4.1 Criteria 1: Ability of Products to achieve Service Levels corresponding to their Demand Variability Levels... 70
4.4.2 Criteria 2: Service Levels and WIP Control Robustness ... 79
4.5 IMPACT OF SENSITIVITY ANALYSIS FACTORS ... 80
4.5.1 Demand Variability of Products ... 81
4.5.2 Mean Time Between Demands ... 84
4.5.3 Level of Availability of Machines ... 89
4.6 INSIGHTS FOR THE DEVELOPMENT OF A NEW POLICY ... 93
4.6.1 Selection of Suitable Strategy for New Policy ... 94
4.6.2 Combination of Policies ... 98
VI
Policies ... 100
5.1 INTRODUCTION ... 100
5.2 SETUP OF EIGHT PRODUCT SYSTEM AND EXPERIMENTS .. 101
5.2.1 Setup of Experimental Scenarios (Product Mix Scenarios)... 102
5.2.2 SimPy – Simulation Modelling ... 105
5.2.3 Simulation Warmup Period, Run Length & Number of Replications ... 106
5.3 LOGIC OF OPERATION OF PROPOSED POLICY ... 108
5.4 SYSTEM OPTIMISATION... 109
5.5 DESIGN OF EXPERIMENTS FOR SENSITIVITY ANALYSIS .... 116
5.6 RESULTS FROM COMPARISON OF PROPOSED POLICY AGAINST EXISTING POLICIES ... 117
5.6.1 50% System Capacity Load Level ... 119
5.6.2 72.5% System Capacity Load Level ... 121
5.6.3 95% System Capacity Load Level ... 124
5.7 Impacts of Demand Arrival Rates on Inventory... 133
5.8 Conclusions from this Chapter ... 136
CHAPTER - 6: Conclusions & Recommendations ... 139
6.1 INTRODUCTION ... 139
6.2 KEY FINDINGS AND CONTRIBUTIONS ... 140
6.3 IMPACT OF THIS WORK ... 141
6.4 FURTHER WORK ... 142
REFERENCES ... 144
LIST OF PUBLICATIONS ... 159
EU-FP7 DREAM PROJECT RESEARCH ... 160
DEMONSTRATIONS AND TUTORING ... 161 APPENDIX - A : TWO PRODUCT SYSTEM’S LHS RUNS TABLES ... A-1
VII
DIFFERENCE IN PRODUCTS’ SERVICE LEVELS UNDER
DKAP ... B-1
APPENDIX - C : ROBUSTNESS OF PRODUCT SERVICE LEVELS UNDER
DKAP and SKAP ... C-1
APPENDIX - D : IMPACT OF VARIATION IN PRODUCTS’ DEMAND
VARIABILITY ... D-1
APPENDIX - E : IMPACT OF VARIATION IN PRODUCTS’ MEAN TIME
BETWEEN DEMANDS ... E-1 APPENDIX - F : IMPACT OF THE LEVEL OF AVAILABILITY OF STAGES ...
... F-1
APPENDIX - G : EIGHT PRODUCT SYSTEM’S OPTIMISED SETTINGS AND
LHS RUNS TABLES ... G-1 APPENDIX - H : GROUP SERVICE LEVEL ROBUSTNESS ... H-1 APPENDIX - I : IMPACTS OF MEAN DEMAND ARRIVAL RATES ... I-1
VIII
LIST OF FIGURES
Page
Figure 2-1: The Kanban Control Strategy from [10] ... 8
Figure 2-2: The CONWIP strategy ... 9
Figure 2-3: The Base Stock Control Strategy ... 10
Figure 2-4: The Extended Kanban Control Strategy from [10] ... 11
Figure 2-5: The Generalized Kanban Control Strategy from [10] ... 12
Figure 2-6: DKAP in a Multiproduct environment ... 20
Figure 2-7: SKAP in a Multiproduct environment ... 21
Figure 2-8: Operation of the DKAP under the EKCS from [10] ... 23
Figure 2-9: Operation of the SKAP under the EKCS from [10] ... 23
Figure 2-10: Operation of the DKAP under the GKCS from [10] ... 24
Figure 2-11: Operation of the SKAP under the GKCS from [10] ... 25
Figure 2-12: First Order Dominance [172] ... 40
Figure 2-13: Second Order Dominance [172] ... 41
Figure 3-1: Simplified Two Product Manufacturing System ... 46
Figure 3-2: MTTF and MTTR of the manufacturing stages ... 46
Figure 3-3: CONWIP and BSCS Warmup period Welch graph ... 51
Figure 3-4: Confidence Intervals for different replication numbers ... 52
Figure 3-5: Cumulative Density Function Plot for SL1 ... 58
Figure 3-6: Cumulative Density Function Plot for SL2 ... 58
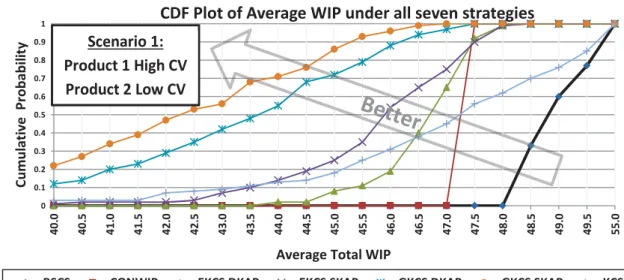
Figure 3-7: Cumulative Density Function Plot for WIP ... 60
Figure 3-8: EKCS DKAP SLs for Products 1 and 2 ... 63
Figure 3-9: EKCS SKAP SLs for Products 1 and 2 ... 63
Figure 3-10: GKCS DKAP SLs for Products 1 and 2 ... 64
Figure 3-11: GKCS SKAP SLs for Products 1 and 2 ... 64
Figure 4-1: SLs under EKCS DKAP and SKAP (Scenario 2) ... 72
Figure 4-2: Significant Differences in SL1 and SL2 EKCS (Scenario 3) ... 73
Figure 4-3: SLs under EKCS DKAP and SKAP (Scenario 3) ... 74
Figure 4-4: Significant Differences in SL1 and SL2 EKCS DKAP (Scenario 4) ... 75
IX
Figure 4-7: Significant Differences in SL1 and SL2 GKCS DKAP (Scenario 4) ... 78
Figure 4-8: Correlation between SL1 and SL2 ... 79
Figure 4-9: Mean Demand Impact on SLs and WIP EKCS (Scenario 4) ... 88
Figure 4-10: Stage Avail. Impact on SLs and WIP GKCS SKAP (Scenario 1) ... 91
Figure 4-11: SKAP Demand, Part and Kanban synchronisation from [10] ... 96
Figure 4-12: Suitability of strategies and corresponding policies ... 99
Figure 5-2: Warmup Period estimation for Eight Product System ... 107
Figure 5-1: HKAP Logic of Operation... 109
Figure 5-3: ACO Path Representation... 110
Figure 5-4: ACO Paths for Stage 1 after Pheromone Update ... 111
Figure 5-5: ACO process with Total Kanban cap ... 114
Figure 5-6: Group 1 Average SL Robustness – 50% Load Level Scenario 4 ... 119
Figure 5-7: Group SL Robustness – 72.5% Load Level Scenario 2 ... 122
Figure 5-8: WIP across LHS Runs at 72.5% Load Level (Scenario 2) ... 123
Figure 5-9: Group SL Robustness – 95% Load Level Scenario 4 ... 125
Figure 5-10: Products 5-8 Demand Arrival rate impact on SLs... 130
Figure 5-11: Products’ Demand Arrival rates impact on WIP ... 135
X
LIST OF TABLES
Page
Table 2-1: LHS factor division and sampling ... 40
Table 3-1: Setting Products’ Mean Times between Demands ... 47
Table 3-2: Demand ܥܸ Levels for the Products ... 48
Table 3-3: Experimental Scenarios ... 48
Table 3-4: Strategies and Policies for the First Set of Experiments ... 49
Table 3-5: Scenario 1: BSCS Solution Space and Optimal Settings ... 55
Table 3-6: Scenario 1: KCS Solution Space and Optimal Settings ... 55
Table 3-7: Scenario 1: EKCS DKAP Sample Space and Optimised Settings ... 55
Table 3-8: Scenario 1: EKCS SKAP Sample Space and Optimised Settings ... 55
Table 3-9: Scenario 1: GKCS DKAP Sample Space and Optimised Settings... 56
Table 3-10: Scenario 1: GKCS SKAP Sample Space and Optimised Settings ... 56
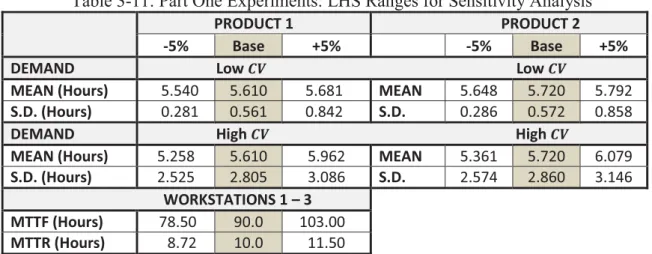
Table 3-11: Part One Experiments: LHS Ranges for Sensitivity Analysis... 57
Table 3-12: Product 1 SL Robustness Test results ... 59
Table 3-13: Product 2 SL Robustness Test results ... 59
Table 3-14: Average System WIP Robustness Test results ... 61
Table 4-1: Scenarios 3 to 4 (Second Set of Experiments) ... 67
Table 4-2: Optimised ܵ and ܣܭ for EKCS DKAP and SKAP ... 68
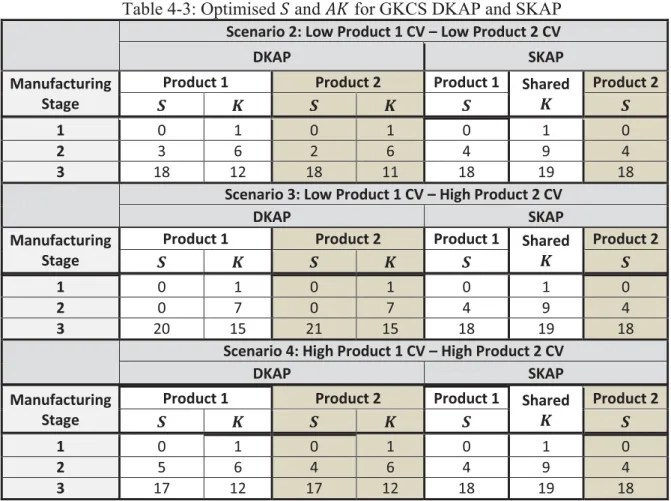
Table 4-3: Optimised ܵ and ܣܭ for GKCS DKAP and SKAP ... 69
Table 4-4: Policies’ ability to differentiate product performances under EKCS ... 71
Table 4-5: Policies’ ability to differentiate product performances under GKCS ... 76
Table 4-6: Stochastic Dominance Comparison of EKCS DKAP & SKAP ... 80
Table 4-7: Stochastic Dominance Comparison of GKCS DKAP & SKAP ... 80
Table 4-8: Impact of Products’ Demand CVs under EKCS DKAP ... 81
Table 4-9: Impact of Products’ Demand CVs under EKCS SKAP ... 81
Table 4-10: Impact of Products’ Demand CVs under GKCS DKAP ... 83
Table 4-11: Impact of Products’ Demand CVs under GKCS SKAP ... 83
Table 4-12: Impact of Products’ Demand Arrival Rates under EKCS DKAP ... 85
Table 4-13: Impact of Products’ Demand Arrival Rates under EKCS SKAP ... 85
Table 4-14: Impact of Products’ Demand Arrival Rates under GKCS DKAP ... 87
XI
Table 4-17: Impact of Stage Availability Level under EKCS SKAP ... 90
Table 4-18: Impact of Stage Availability Level under GKCS DKAP ... 91
Table 4-19: Impact of Stage Availability Level under GKCS SKAP... 91
Table 4-20: Stoch. Dominance Comparison of GKCS & EKCS (DKAPs) ... 94
Table 4-21: Stoch. Dominance Comparison of GKCS & EKCS (SKAPs) ... 94
Table 5-1: Eight Product System: Scenario 1 ... 104
Table 5-2: Eight Product System: Scenario 2 ... 105
Table 5-3: Eight Product System: Scenario 3 ... 105
Table 5-4: Eight Product System: Scenario 4 ... 105
Table 5-5: Eight Product System: Scenario 5 ... 105
Table 5-6: Setting of Kanban and basestock under the three policies ... 108
Table 5-7: Sample Ant ܣܭ and ܵ Settings ... 110
Table 5-8: LHS Ranges for Sensitivity Analysis on Eight Product System ... 116
Table 5-9: Significant declines in Group Average SLs – 50% ... 119
Table 5-10: WIP Control Effectiveness – 50% Load Level ... 120
Table 5-11: Significant declines in Group Average SLs – 72.5% ... 121
Table 5-12: WIP Control Effectiveness – 72.5% Load Level ... 123
Table 5-13: Significant declines in Group Average SLs – 95% ... 124
Table 5-14: WIP Control Effectiveness – 95% Load Level ... 126
Table 5-15: Instances of Products’ Demand Variation Impact ... 127
Table 5-16: Demand Arrival rate impact on Product SLs (Scenario 1) ... 128
Table 5-17: Demand Arrival rate impact on Product SLs (Scenario 2) ... 129
Table 5-18: Demand Arrival rate impact on Product SLs (Scenario 3) ... 131
Table 5-19: Demand Arrival rate impact on Product SLs (Scenario 4) ... 132
XII
LIST OF ABBREVIATIONS AND NOTATIONS
ABBREVIATION EXPLANATION
ACO Ant Colony Optimisation
ADI Advance Demand Information
BK-CONWIP Basestock Kanban CONWIP BSCS Base Stock Control Strategy
C.I Confidence Interval
CDF Cumulative Density Function
CONFLOW Constant Flow
CONLOAD Constant Load
CONWIP Constant Work In Progress
CONWORK Constant Work
D Demand Buffer
DBR Drum Buffer Rope
DKAP Dedicated Kanban Allocation Policy EKCS Extended Kanban Control Strategy ERP Enterprise Resource Planning FIFO First In First Out
GA Genetic Algorithm
GKCS Generalised Kanban Control Strategy HKAP Hybrid Kanban Allocation Policy
I Input Part Buffer
ICT Information and Communications Technology IEKCS Independent Extended Kanban Control Strategy
ܭ Total Kanban setting
KAP Kanban Allocation Policy
KCS Kanban Control Strategy
LHS Latin Hypercube Sampling
ܯ Mean demand arrival rate
XIII
MRP II Manufacturing Resource Planning
MS Microsoft
MTTF Mean Time to Failure
MTTR Mean Time to Repair
Opt. Optimised Setting
PA Part + Kanban Buffer
PCS Production Control Strategy
PFB Pull From Buffer
POLCA Paired-cell Overlapping Loops of Cards with Authorisation PPCS Pull Production Control Strategy
S Basestock setting
SA Starvation Avoidance
SEKCS Simultaneous Extended Kanban Control Strategy SKAP Shared Kanban Allocation Policy
SL Service Level
ܵܮͳ Service Level of Product 1 ܵܮʹ Service Level of Product 2
ܵܮܩͳ Average Service Level of Group 1 ܵܮܩʹ Average Service Level of Group 2 ܵܮ݅ Service Level of Product ݅
ܶ Throughput rate
WIP Work In Progress
WIPLOAD Constant Work in Progress Load
λ Product Demand Arrival rate
μ Mean of Normal distribution
σ Standard Deviation of Normal Distribution
τ Product Processing time
ܥܸ Coefficient of Variation
ࣝ Probability of selection of a Kanban or basestock setting ܣ Stage, ݆, Kanban Buffer
ܣீ Stage, ݆, Group, ݅, Shared Kanban Buffer ܣܭ Extra Unattached Kanban setting
XIV
ܦܣ Stage, ݆, buffer for demands for part type, ݅, merged with Kanbans ܦ Demand information for product, ݅
ܦ Stage, ݆, demand buffer for part type, ݅ ܨሺݔሻ Cumulative Density Function of ݔ
ܭௗ Ratio of Demand Arrival rates between Group 1 and 2 ܭ Dedicated Kanban for product, ݅, at Stage, ݆
ܭ Shared Kanban for Stage, ݆
ܭ Ratio of Processing times between Group 1 and 2
ܲܣ Stage, ݆, buffer for finished part type, ݅, with attached Kanban
ܲ Part type, ݅
ܲ Finished parts buffer for product, ݅, at Stage, ݆ ܵ Basestock setting for product, ݅, at Stage, ݆ ܵ Basestock level for for part type, ݅, at stage, ݆
ܶܭሺሻ Total Kanban cap
݊ா௧ Size of elite population
݊ா௧ோ Number of ants in the elite population that have selected an AK or S ݊ூ௧ோ Number of initial representations of an AK or S in the options list ݊௧ Total number of representations of all AK or S in the options list ݊ Number of representations of an AK or S in the options list
XV
OLADIPUPO OLAITAN
A Framework for Creating Production and Inventory Control Strategies In multiproduct manufacturing systems, it is difficult to assure that an optimised setting of a pull production control strategy will be able to maintain its service level and inventory control performances. This is because the competition for resources among products is liable to make them affect the service levels of one another.
By comparing different pull strategies, this research has observed that tightly coupled strategies are able to maintain lower amount of inventory than decoupled strategies, but they do so at the detriment of service level robustness. As a result, tightly coupled strategies are better suited to manufacturing environments with low variability, while decoupled strategies are more robust in high variability environments. Here, robustness is a measure of how well a strategy is able to minimise the drop below its original optimised service level when the initial system conditions change.
Furthermore, the Kanban allocation policy applied under a strategy plays a major role in its ability to manage the performances of multiple products. Experimental results show that the Shared Kanban Allocation Policy (SKAP) keeps a lower amount of inventory than the Dedicated Kanban Allocation Policy (DKAP), but it is more susceptible to the variability in the demand or processing times of one product impacting the service level of another. Therefore, a Hybrid Kanban allocation policy (HKAP) that combines both the DKAP and the SKAP has been implemented. This approach considers products’ demand and processing time attributes before categorising them into the same Kanban sharing group. The results of the implementation of the HKAP show that it can keep as low inventory as the SKAP and avoid products impacting the service levels of one another. Additionally, it offers a better approach to managing large multiproduct systems, as the performances of product groups can be differentially managed through the combination of Kanban sharing and dedication policies.
Lastly, the observations on the performances of strategies and policies under different system conditions can be used as a framework through which line designers select strategies and policies to suit their manufacturing system.
1
1.1 BACKGROUND
The aim of this research is to develop a new production and inventory control approach. To this end, it will look into the necessities that have led to the development of production and inventory control approaches in the past. It will also review the methodologies that were followed in the development of those approaches.
The Toyota manufacturing concept (also called Lean Manufacturing) was the first widely acknowledged success story of a manufacturing approach [1, 2]. The company’s success in cutting down on waste and remaining responsive to customer demands generated a lot of interest in the industry. The development of the lean manufacturing concept led to the introduction of pull based manufacturing control where a product is only produced to meet a specific demand. The pull based control uses authorisation cards called Kanbans to limit the amount of inventory in the system to just what is needed to be immediately responsive to customer demands. It is called pull production control because it uses the Kanbans to also serve the purpose of pulling the parts through the system in response to arriving customer demands.
2
About the same period when the Lean Manufacturing concept and the Kanban control approach appeared, an approach called Material Requirements Planning (MRP) was developed to push items through the system in anticipation of demand forecasts [3]. It allowed companies to use computers to centrally coordinate the amount of inventory items kept within the system. The success of its central coordination of inventory must have encouraged the subsequent incorporation of other enterprise related functions into it. The widening of its scope beyond materials requirement planning thus made it to become known as Manufacturing Resource Planning (MRP II) [4] and later as the present day Enterprise Resource Planning (ERP), due to the incorporation of even more functions. Also, having realised that the original MRP had high throughput benefits which can be combined with the inventory control benefits of the Kanban control approach, from the mid-1980s, some researchers developed a hybrid push-pull concept that would combine the throughput benefits of the push (MRP) with the inventory control benefit of the pull (Kanban control approach) [5]. The hybrid strategy’s push component was expected to loosen the pure pull strategy’s inventory control which had become a deterrent for some high variability companies that wanted to adopt the pull strategy. It also improved the applicability of the pull approach to multiproduct manufacturing environments [6, 7].
Not too long afterwards was the development of the CONWIP – a pure pull strategy, which was also developed to suit manufacturing environments that are prone to different sources of variability [8]. Similar to the hybrid push-pull, its localised push control was expected to make it applicable to such environments. Over time, there have been numerous strategies developed from either combining existing ones or developing entirely new ones that still retain the original pull philosophy. These will be discussed in further details in Chapter 2.
1.2 MOTIVATION AND OBJECTIVES
As the application of pull control strategy extended into multiproduct environments more thought was given to the operational details of how the Kanban control was going to be operated among different products. A study suggested two possible approaches of either sharing Kanbans between the different products or dedicating separate sets of Kanbans to each one [9]. Prior to this study, the default assumption in literature was that
3
each product would have its own set of Kanbans, and this is probably due to it being the straightforward extension from a single product environment. However, a later study which reinforced the two approaches contributed to the recently increased research interests in them [10]. The two were termed the Shared Kanban Allocation policy (SKAP) and the Dedicated Kanban Allocation policy (DKAP) [10]. Research works that have been done since then have found that the two policies have pros and cons that depend on the condition of the manufacturing system in which they are deployed [11-13], just like it has been observed with the push and the pull strategies [8, 14]. Interestingly, there has been no attempt in literature to combine both policies in the way it has been done with the push and the pull strategies.
Therefore, it is the aim of this research to fill this research gap by developing a framework for combining the two policies into a Hybrid Kanban Allocation policy (HKAP). This will be achieved by first conducting investigations into the behaviour of both policies before applying the outcomes in the implementation of the HKAP in a case study manufacturing system. The performance of the HKAP will then be compared against the pure application of either policy. The intended benefits of this HKAP policy are: (1) to achieve the benefits of both policies in the same system, (2) to use it in a way that the performance of multiple products can be differentially managed in a system by categorising them into different Kanban sharing groups.
This research is somewhat related to the simultaneous EKCS (SEKCS) and independent EKCS (IEKCS) approaches proposed in [15], or, to some extent, the independent and simultaneous traditional Kanban control policies of [16, 17]. However, the simultaneous and independent approaches are aimed specifically at managing the release of components in assembly lines, while this research is applicable to any system that involves the processing of multiple part types in at least one of its stages.
1.3 STRUCTURE OF THESIS
This thesis is organised into seven chapters. The present chapter gives a background of key breakthrough stages in the development of production and inventory control strategies. It briefly describes how research into this area has evolved over time from the pull, push to hybrid production control strategies.
4
Chapter 2 starts by briefly looking into the basis for the categorisation of production control strategies in general before going into further elaboration on the development of the specific production control strategies briefly described in Chapter 1. It reviews the techniques that have been applied in simulation modelling and optimisation of production control strategies. It discusses the techniques that have been applied in the comparison of strategies and how recent developments are shaping those techniques. It reviews the studies that have been the sources of those developments in relation to the bearing they might have on the conduct of this research.
Chapter 3 provides a brief overview of the sets of experiments involved in the thesis, followed by a detailed description of the setup of the first set of experiments on the two product system. It also covers the discussion of the results obtained from these experiments.
In chapter 4, the results obtained from the second set of experiments on the simplified two product system are presented. This chapter is then concluded with a general overview of the observations about the performance of the different strategies and their corresponding Kanban allocation policies. This overview also specifically highlights the key observations that would influence the conduct of the last set of experiments.
In Chapter 5, the outcomes of the comparisons of the performance of the HKAP against those of the pure DKAP and SKAP are presented. It shows the results of comparing the three policies’ service level robustness performances, their inventory control effectiveness and their ability to differentiate the performances of product groups.
Chapter 6 concludes the thesis by presenting an overview of the general outcomes of this research, its achievements and contributions to this area of research. It highlights the research gap that has been filled by this work and discusses possible future work.
5
2.1 INTRODUCTION
This chapter describes the two main categories of production control strategies. In particular, it focusses on the pull category, which is studied in this work, by looking at how it has evolved over time. It discusses the approaches that have been followed to develop new strategies from the original pull strategy in order to achieve improved performances and widen its applicability to new manufacturing environments.
Also, as part of looking into these approaches, it will review the techniques generally applied in pull controlled manufacturing systems’ simulation modelling and optimisation, and their experimentation and analysis, as well as those applied in comparing the performances of different strategies. The comparison has become a key aspect of production control strategies’ research because as new strategies are being proposed, their performances have to be compared against existing ones. Furthermore, it will look at how the desire to extend the pull strategy into more complicated multiproduct environments is shaping those techniques.
6
The review starts in the following section by briefly looking into the basis for categorising production control strategies before going into more details on the pull strategy.
2.2 PRODUCTION CONTROL STRATEGIES
Production control strategies are often categorised as pull or push systems, meaning that they either wait for actual occurrence of demands to pull parts through the manufacturing system or, on the other hand, push parts through in anticipation of demands. Other definitions that are used to classify strategies as pull or push are as follows [18]:
a.) A pull strategy initiates production in response to actual demands for finished products, while a push’s production is independent of demands,
b.) A pull strategy places explicit limit on the amount of system work in progress (WIP), while a push strategy does not have such explicit limit on the amount of system WIP.
However, a strategy that falls under pull category based on the first definition can as well be placed under the same category in the second definition, because, by only initiating production in response to actual demand, it would exhibit some level of control over its WIP, even if not very tight [19]. It means that every item released into the system in response to actual demands would only contribute to WIP for the duration of its cycle time, unless the system is unstable. Meanwhile, a strategy that falls under the pull category based on the second definition does not automatically fall under the same category based on the first definition, irrespective of its level of WIP control. The second definition is expected to be a natural outcome of strategies that fall under pull in the first two definitions. Therefore, a benefit of pull strategies is the ability to control inventory (WIP), while push systems can achieve higher throughput and consequently faster response to customer demands [8, 20].
2.2.1 Materials Requirements Planning – A Push Strategy
One of the earliest approaches to production and inventory control is Materials Requirements Planning (MRP) [3]. MRP controlled systems are run to achieve high
7
throughput in anticipation of meeting demand forecasts. It estimates components and raw materials requirements through time-phased explosion of the Master Production Schedule (MPS) combined with the Bill of Materials (BOM) and the inventory status file [21].
MRP gained wide acceptability as a computerized planning system for job shop and batch manufacturing systems [20]. However, the possibility of using the lean manufacturing control concept to achieve a more effective inventory control than the MRP made it less attractive to some practitioners and researchers in that regard [21, 22]. Nevertheless, it remained applicable for its high throughput benefits and computerised central coordination of functions. In fact, there have been subsequent significant improvements that transformed the original MRP into Manufacturing Resource Planning (MRP II) [4] and later Enterprise Resource Planning (ERP), and these have along the line incorporated more enterprise-wide functionalities that go beyond production or materials requirements planning.
2.2.2 Traditional Kanban Control Strategy – A Pull Strategy
A production and inventory control strategy that aims to control the WIP of a system while still maintaining a satisfactory response to customer demands is the traditional Kanban Control Strategy (KCS). KCS was first applied in Toyota’s assembly lines as an integral part of an overall management strategy called Lean or Just in Time (JIT) manufacturing [1, 2]. Other constituents of the JIT system are total quality control, set up time reduction, and worker involvement [8, 19]. These are identified as sources of variability to a system that will need to be reviewed before the strategy can be fully applied to a system.
KCS uses signal cards, known as Kanbans, to authorise the processing of parts at each stage of a manufacturing system in order to control the level of inventory in the system. The KCS, as a materials handling technique, allows perfect synchronization between what the downstream station requires and what the upstream station produces [23, 24], and it does not necessarily have to be a physical card but can be represented by electronic boards or by the WIP container itself.
8
Figure 2-1: The Kanban Control Strategy from [10]
As shown in Figure 2-1, when a customer demand, ܦ, arrives to the finished products demand buffer, ͵, a product is released from the finished products buffer, ʹ, and used to satisfy the demand. The Kanban, ܭଶ, attached to the released product is then detached, merged with the demand information, and sent to the next upstream stage. When the merged demand and Kanban pair, ܦ ܭଶ, arrive at the next upstream stage,
it seeks for a part from the buffer, ͳ, to release to the input buffer of Stage, ʹ. If there is no part available immediately, ܦ ܭଶ is queued in ʹ until a part becomes available. When a part is released downstream from buffer, ͳ, its Kanban is detached again, merged with the demand information and sent to the next upstream stage’s demand-Kanban buffer, ͳ . At this stage, the pair will seek for a raw part from the buffer, Ͳ. In studies that assume infinite availability of raw materials, as done in this
research, the ܦ ܭଵ arriving to ͳ will always find a part in Ͳ to release into the first stage, and as such ͳ will always be empty. The inventory level at the first stage will therefore always be equal to the set Kanban number for that stage.
Toyota’s success in meeting customer demands with a low level of inventory attracted so much attention that the strategy became highly studied, resulting in the development of variations of the original KCS through works such as those of Generalised Kanban Control Strategy (GKCS) [25, 26], CONWIP [8], Hybrid CONWIP/Kanban [27], Extended Kanban Control Strategy (EKCS) [28], Extended CONWIP/Kanban [29]. The Base Stock Control Strategy is another production control strategy which is often researched alongside these KCS variants, as it allows a direct comparison under the same pull concept as them [19, 30, 31].
The KCS is traditionally known to be suited to high process reliability, low setup times, and low variability systems [6, 32-36]. However, these variants, which still retain the
ࡼ ࡷ ࡼ ࡷ ࡼ ࡷ ࡰ ࡷ ࡰ ࡷ ࡰ ࡼ ࡼ ࡷ ࡼ ͳͳ ʹʹ ۲ۯ ۲ۯ ۲ ۾ۯ ۾ۯ ۾
9
original pull concept of the traditional KCS, are believed to offer greater applicability in more complex environments such as those described in previous studies [8, 37].
2.2.3 Constant Work in Progress (CONWIP)
The CONWIP strategy was developed to possess the benefits of a pull strategy and be applicable in a wide variety of manufacturing environments in which the KCS was not entirely suitable [8]. Its development can be attributed to the desire of manufacturing environments that are more prone to system variability to adopt pull strategies. It is able to combine the low inventory levels of pull strategies with the high throughput of push strategies [38], and it only responds to the actual occurrence of demands [27]. It controls the system WIP with a single set of Kanbans which are attached to parts upon their release into the system and retained throughput their processing at the stages [20].
Figure 2-2: The CONWIP strategy
As shown in Figure 2-2, a Kanban is finally detached from a part upon its release from buffer, , to satisfy a demand, ܦ, that arrived to the finished products demand buffer, ͵Ǥ The Kanban is then immediately sent upstream to the first stage’s Kanban buffer, ͳ, for use in authorising the release of a new raw part into the system. In this case, an
assumption of an infinite availability of raw materials will ensure that ͳ is always empty, and that the level of inventory (WIP) in the system is maintained at a constant level which is tied to the set number of Kanbans; hence the name CONWIP (Constant Work In Progress). The CONWIP’s use of a single set of cards to regulate the system WIP is similar to how the KCS uses a single set of Kanbans to regulate the stage WIP [11, 39]. Similarly, its stage level control has been likened to a push control because it does not regulate the stage WIP [37].
ࡼ ࡷ ࡰ ࡼ ࡼ ࡷ ࡼ ࡷ ࡷ ࡼ
10 2.2.4 Base Stock Control Strategy (BSCS)
The BSCS does not use Kanbans to authorize production but it has been referred to as a special case of the EKCS with infinite number of Kanbans at each of the stages [39]. Also, it remains a pull strategy because it only responds to actual customer demands. Although the BSCS offers the advantage of immediate response to demands with its demand transmission approach, it is often criticized for its loose coordination between stages which results in excessive WIP accumulation [28].
Figure 2-3:The Base Stock Control Strategy
In the BSCS, target levels of inventory called basestock are set at every stage. As shown in Figure 2-3, a customer demand, ܦ, arriving to the finished products demand buffer, ͵, is instantly replicated and transmitted to the demand buffers, ʹ and ͳ of the other stages [30, 31]. This thus ensures immediate response and replenishment of the basestock levels to their initial states [28]. The demand information transmitted to ͵
will release a finished product from the buffer, ʹ, to the customer, while that transmitted to ʹ will be used to release a part from the output buffer, ͳ, of Stage ͳ downstream into the input buffer of Stage ʹ. The demand information that arrives to
ͳ will release a new raw part from the buffer, Ͳ, into the input buffer of the first stage, ͳ. It should be noted that if any of the demand information does not
immediately find a part in the buffer, it would be queued until one becomes available. Also, in studies which assume infinite availability of raw materials, as done in this research, the demand arriving to ͳ will always find a part in Ͳ to release into the first stage, and as such ͳ will always be empty.
ࡼ ࡼ ࡼ ࡼ ࡰ ࡰ ࡰ ࡰ ࡼ ࡼ
11
2.2.5 Extended Kanban Control Strategy (EKCS)
The EKCS is a combination of the BSCS and the KCS, and it is described as combining the advantage of immediate response to demands offered by the BSCS with the tight WIP control of the KCS [28]. Its introduction of Kanbans into the BSCS to coordinate production between the manufacturing stages is seen as a means of overcoming the BSCS’s excessive WIP shortcoming.
Figure 2-4: The Extended Kanban Control Strategy from [10]
As shown in Figure 2-4, it retains the same demand information transmission approach as the BSCS; however, the demands have to be synchronised with Kanbans before they can they can authorise the release of a finished part downstream, except at the finished products buffer, ʹ. It is only if there is no finished part available in the finished parts buffer, ʹ, that the demand, ܦ, will have to be queued in ͵, until a part becomes available. When a part is being released from ʹ, the Kanban, ܭଶǡ of Stage, ʹ, that was attached to it upon its release into that stage is detached and sent back upstream into the Kanban buffer, ܣଶ. A new part will be released into the input buffer of ʹ, as
soon as there is a demand in ʹ, a Kanban in ʹ and a waiting part in ͳ. Similar requirement applies for a part to be released into the input buffer of ͳ. As a result, the assumption of an infinite availability of raw materials at the first stage will not necessarily make demand buffer, ͳ, empty always. This is because the release of a raw
part into the input buffer of Stage ͳ in response to a demand can be delayed by the unavailability of a Kanban in ͳ to synchronise it with. The stage’s Kanbans could be
presently attached to finished parts waiting in ͳ or parts waiting to be processed or being processed in ͳ.
It should be noted that under the EKCS, the Kanbans of a stage remain attached to the finished parts in its output buffer, until they are to be released downstream into the input
ࡰ ࡰ ࡰ ࡼ ࡷ ࡷ ࡼ ࡷ ࡼ ࡷ ࡼ ࡷ ࡼ ࡷ ࡼ ࡰ ۻ۾ ۻ۾ ۲ ۲ ۲ ۯ ۾ ۯ ۾ۯ ۾ۯ
12
buffer of the succeeding stage. In addition to the Kanbans attached to those finished parts, there are usually some free Kanbans in the stage’s Kanban buffer. As a result, the total number of Kanbans set for a stage in the EKCS cannot be less than the basestock level.
Since in the KCS, the number of Kanbans at a stage corresponds to the number initially attached to the finished parts in its output buffer, it can be inferred that an EKCS with K = S (i.e. with no extra unattached Kanbans) at all stages is equivalent to a KCS with the same Kanban setting [28], because such EKCS will authorise production in the same way as a KCS – which is after finished parts are moved downstream. Likewise, the EKCS is equivalent to the BSCS, if it has infinite numbers of Kanbans available per stage [39].
2.2.6 Generalized Kanban Control Strategy (GKCS)
The GKCS [25, 26] is a two parameter, localised information flow strategy which, like the EKCS, requires setting the basestock level and the Kanbans per stage [10]. However, its own approach to demand information transmission is not global and the timing of its Kanban detachment differs. When a demand information arrives, it duplicates and transmits it to the last and penultimate stages only. From the penultimate stage the demand information is transmitted locally upstream one stage at a time.
Also, it detaches Kanbans from parts as soon as they complete processing, before storing them in the stage’s output buffer. Therefore, parts in the output buffers are without their Kanbans attached to them, unlike in the KCS and the EKCS where Kanbans remain attached to parts until they are transported to the input buffer of the next stage [10].
Figure 2-5: The Generalized Kanban Control Strategy from [10]
ࡼ ࡷ ࡼ ࡷ ࡼ ࡷ ࡼ ࡷ ࡰ ࡰ ࡰ ࡼ ࡷ ࡷ ࡼ ۻ۾ ۻ۾ ۲ ۯ ۲ۯ ۾ ۲ ۯ ۲ۯ ۾ ۾ ۲
13
As shown in Figure 2-5, when a demand,ܦ, arrives, it only duplicates and transmits it to the finished products buffer demand buffer, ͵, and the demand buffer, ʹ, of the
penultimate stage. If a product is available in ʹ, it is immediately released to satisfy the demand, or else the demand will have to be queued in ͵ until a product becomes available. For the demand that was transmitted to ʹ, it will first seek a Kanban, ܭଶ,
from buffer, ʹ, to merge with in order to be able to authorise the release of a part downstream from the buffer, ͳ. If there is no part available in ͳ, the merged demand and Kanban pair, ܦ ܭଶ, is queued in the buffer, ʹ, until one becomes available. Meanwhile, the merger of ܦ and ܭଶ would be sufficient to continue the transmission of
the demand information upstream to the demand buffer, ͳ. This demand transmission would have otherwise needed to wait until the demand was able to merge with a Kanban.
Similarly to the EKCS, the assumption of infinite raw material availability does not imply that ͳ will always be empty, as the release of a part downstream can again be
delayed by the unavailability of a Kanban in buffer, ͳ. The Kanbans could be presently attached to parts waiting to be processed or being processed in ͳ. Also, similarly to the condition of equivalence of the EKCS to the KCS, it has been shown that the GKCS is equivalent to the KCS, and the EKCS too, when its ܭ ൌ ܵ (i.e. the number of Kanbans and basestock are equal) for all the stages [10, 39].
On the other hand, the level of coupling between the transmission of demand information and Kanban varies in the KCS, EKCS and the GKCS. The KCS has a tight coupling in the transmission of the two items, the GKCS is partially decoupled, while the EKCS is totally decoupled [10]. In the EKCS, the Kanban only plays the role of production authorisation; while in the GKCS, it is further needed for the transmission of demand information upstream, which is done globally in the EKCS. The EKCS’s total decoupling has been described in past studies as making it more simple and flexible than the GKCS [28, 40]. However, the GKCS too exhibits its own flexibility with respect to the ability to set the Kanban level independently of the basestock level [10].
14
2.3 OTHER CLASSES OF PRODUCTION CONTROL STRATEGIES
There have been other classes of production control strategies which cannot be directly classified into any of the groups above. Unlike the push or pull strategies that have set rules for transmitting demands and authorising the processing of parts, these strategies have been developed to work flexibly in synchronisation with the state of the system. Some of them are briefly described in the following sub-sections under wide classification that are based on their production control concepts.
2.3.1 Bottleneck and Workload Oriented Concepts
The main aim of the bottleneck oriented concept is to achieve the best utilisation of the bottleneck station without accumulating excess amount of inventory before it or starving the station after it of work to do. It regulates the release of materials into the system in synchronisation with the capacity of the bottleneck station. It was first proposed through the Theory of Constraints [41-43] before it found production scheduling application in the form of the Drum-Buffer-Rope [43, 44]. A technique called Starvation Avoidance similarly seeks to avoid starvation of the bottleneck station through a regulated release of new jobs into the system to ensure that the bottleneck station is kept running without an accumulation of inventory before it [45].
The workload oriented concepts on the other hand seek to regulate the amount of workload in a manufacturing system by always taking into account the current level of workload on the system – particularly at the bottleneck station, before releasing new jobs into it. They are similar to the CONWIP’s regulation of the number of items in the system, but they go further to consider the amount of load each item’s processing requirement translates to on the system’s capacity. There have been many variations of the workload oriented concepts in research in terms of how they measure the load resulting from the WIP items at the bottleneck station and in the system [46, 47]. Examples of such variations are the CONLOAD [48], the Workload Regulation or CONWORK [49, 50], the WIPLOAD [51], the Pull-From-Bottleneck (PFB) [46] and the CONFLOW [47]. The applications of the workload oriented concepts have been mostly in semiconductor fabrication environments.
15
There have been comparisons between the two concepts and the push or the pull control strategies [45, 47, 48, 52]. One of such comparisons is that which reports that the PFB concept is able to protect and keep the bottleneck station running even if a station downstream of it was broken down; unlike the KCS and CONWIP which would at some point under such situation cease to have Kanbans to release items into the upstream stage [43, 46, 47].
2.3.2 Product Grouping Concepts
An approach that has gained popularity in managing manufacturing resources between multiple products is Cellular manufacturing whereby similar products are grouped into families and assigned to cells of machines for the processing of one or more families of products [53-56]. In addition to machining requirements and part design features, which are mostly used to group products, other external factors such as demand attributes have also been used recently [57]. However, there are situations whereby products only have minor differences in design features which would only require slightly different processing requirements through the same production route. In such situations, a cellular design may not be a viable option because it would possibly require a duplication of all the machines. Therefore, a line manager who is consigned to a situation of having to share manufacturing resources will have to determine the best way to setup the system to ensure a balanced delegation of production capacity between the products. The allocation of Kanbans and the setting of basestock levels for products have been shown to influence the performance of individual products [13, 14, 58], most especially because they have impact on how much access a product will have to the manufacturing resources. As a result, focussing on the management of such aspects might be the only option for such managers. Moreover, within the shared or dedicated cells of the cellular manufacturing, there is still need to manage the access to the manufacturing resources within and between the product families.
The Paired-cell Overlapping Loops of Cards with Authorisation (POLCA) [59, 60] is another category of multiproduct control strategy which uses signal cards to control the flow of parts between cells in a shared configuration. However, it does not implement Kanban control to coordinate the flow between the workstations that are within a cell. POLCA is mostly used for signalling when capacity becomes available downstream
16
while Kanban is an inventory signal to control the replenishment of inventory for a specific product [60].
2.3.3 Flexible or Adaptive Control Strategies
Another category of production control strategies that can be found in literature are the Flexible or Adaptive KCS which operate like the traditional KCS, except that they propose a dynamic review of the initial Kanban settings in response to the state of the system [61-64]. They adjust the number of available Kanbans in accordance to a rise or fall in the demand arrival rate, inventory level or demand backlog level. Another study however suggests that adjusting the number of Kanbans may not be sufficient in some system variability situations, and that observing inventory level as a means of knowing when to adjust the number of Kanbans might not give prompt indication of when the system is undergoing instabilities [65]. The study thus proposes a robust Kanban design that would instead involve making adjustments to operational, tactical and strategic system settings to offset instabilities [65]. Such adjustments would be made to the average service time of machines, the number of machines and the materials supplier. However, this might be difficult and costly to achieve for production line designers whose desire is to be able to sustain a particular system design for a long time without the need for constant re-evaluation. Moreover, as a result of cost, time and some technical considerations, organisations cannot always afford to make such continuous changes for their manufacturing system to be adaptable to running a particular pull strategy. Therefore, instead of trying to continuously fine tune a single strategy, some studies have proposed the combination of desirable traits from different strategies into a single hybrid strategy.
2.4 HYBRID CONTROL STRATEGIES
Combining different production control strategies is an area that has been very active since the 1980s [66-68]. Particularly, it seems to have originated from the desire to incorporate the throughput benefits of push and the tight inventory control of pull into a single strategy [5-7], and since then there have been numerous works done to create hybrid strategies, including from multiple pull strategies.
17 2.4.1 Hybrid Push-Pull
Push and Pull strategies have individual advantages and disadvantages [6], and it has been shown that easier implementation and better results are achieved when the two strategies are integrated. Two integration approaches have been reported for hybrid push-pull strategies, namely vertically and horizontally integrated hybrid strategies [69, 70]. The vertically integrated hybrid strategies are those that consist of an upper level push-type production control and a lower level pull-type production control [71-74], while the horizontally integrated hybrid strategies consist of a series of push stations that are succeeded downstream by a series of pull stations, with semi-finished products stored at a junction point between them [70, 75-77].
It has been observed that the application of a hybrid strategy will often give better results compared to a pure application of either strategy [27, 70, 71, 76]. They are reported to be more easily implemented than either push or pull strategies, and that they have an edge over pure pull strategies in dealing with high demand variability [38, 71, 78, 79]. In fact, some studies conclude that the application of pure pull strategies should be restricted to situations where variability in demand, as measured by its standard deviation, is not very large [6, 7, 80].
The location of the integration point between strategies has been shown to be a major deciding factor in the performance of a hybrid strategy [66-68], and this integration point is often located in reference to the bottleneck resource, the product structure and the customer order point [75, 77, 78]. The customer order point has been defined as the point in the manufacturing process where a product is ultimately assigned to a specific customer order [78].
Other possible locations are batch production stages, value adding stages and assembly stages [79]. Another study recommends that the junction point be located immediately after the bottleneck station and that a single junction point should be used for all products in the system in order to save optimization resources [70].
18 2.4.2 Other Hybrid Strategies
Another generation of hybrid strategies that can be found in literature are those that combine different variants of pull strategies; for example the Hybrid CONWIP/Kanban [27], the Extended CONWIP/Kanban [29] and the Basestock Kanban-CONWIP [81]. The EKCS [28] can also be placed under this category, as earlier explained in Section 2.2.5. These strategies are also direct results of the desire to select and combine suitable traits from different variants of pull strategies [40]. These traits that influence the performance of strategies can be attributed to inherent features such as the demand information or Kanban transmission philosophy, which can be classified as local or global [27, 38, 40]. A study has devised a very dynamic approach that can be followed to combine these traits from different strategies to form completely new demand information and Kanban transmission philosophies [38]. The study suggests that the formation of hybrid strategies does not have to always be a combination of the three fundamental pull strategies, which another study had previously identified as the KCS, CONWIP and BSCS [82].
2.5 EXTENSION OF PULL PRODUCTION CONTROL STRATEGIES TO MULTIPRODUCT MANUFACTURING ENVIRONMENTS
Several studies have been conducted on pull control strategies in single product manufacturing environments [20, 39, 40, 83], while multiproduct manufacturing environments, on the other hand, are usually more complicated to study. Aspects such as the assumption made on the significance of machine changeover time between the processing of different product types have an impact on how multiproduct studies are conducted [84]. A significant changeover time would necessitate the determination of the best approach to minimize the setup cost, and this in itself constitutes a research question that has been advanced in studies [84].
For instance, a study describes a setup time minimization strategy, called continuous review policy, such that there are two thresholds r and R that are respectively used to monitor when to begin and discontinue the production of a particular product type [33]. Threshold, r, is the level below which, when the WIP of a product type falls, its production is signalled to be started at a workstation, while the other threshold, R, is that
19
which when reached implies that the production of a product type is to be stopped. These thresholds, according to the study, are determined by the scale of the setup time or other costs associated with setting up the machine to changeover to the production of a different product type. Another similar approach is that which assumes that products are batch processed in such a way that the processing of a product type will continue until its Kanbans are exhausted before a switch to another product type takes place [85]. On the other hand, studies that assume negligible setup times have pointed to recent advances in manufacturing equipment, which make rapid and low-cost changeovers between product types possible [86]. An example of such systems is the reconfigurable system described in Marek et al. (2001) [20], where parts are not batch processed but processed on a FIFO basis as they arrive, because there is only a negligible changeover time in switching between product types. Interestingly, in a consideration of both assumptions, a study observed that irrespective of whether changeover time is considered significant or not, the fixed capacity allocations to the different products in a system affected its performance in the same way [33].
2.5.1 Kanban Allocation Policies
Furthermore, applying some pull strategies in multiproduct environments poses the question of how the Kanbans are allocated between the different product types. The most natural extension of the single product Kanban control strategy to the multiproduct environment is to treat each product as if it constituted its own line, dedicating a specific number of Kanbans to each product. This number would be optimised for the expected demand profile to share the production capacity of the system between the products, effectively allowing each product equal opportunity to meet its demand. Such policies are considered Dedicated Kanban Allocation Policies (DKAP). The alternative is to set the Kanban level for the system and allow products to claim a Kanban based on whatever queue discipline (usually FIFO) is applied between stations. This ensures that the processing stations operate at their maximum level, but leads to the potential that one product may be delayed as the capacity is all claimed by another product. Such policies are termed Shared Kanban Allocation Policies (SKAP).
20
These two policies were first outlined in a study [9], however the first detailed analysis was presented in a more recent paper [10]. The two policies are discussed in the following sub-sections, followed by a description of the logic of their operation under the EKCS and the GKCS.
2.5.2 Dedicated Kanban Allocation Policy (DKAP)
In the DKAP, Kanbans are strictly allocated to a part type and can only be used by that part type. This implies that even if at a point in time a part type is short of Kanbans while another part type has a surplus of them, those surplus Kanbans are not usable for the part type that is short of Kanbans. Therefore, part types only share production capacity while other entities within the system such as the demands, part type and Kanbans are strictly attributed to a particular part type.
Dedicated Kanbans Demand B Part B Manufacturing Stage Dedicated Kanbans Demand A Part A
Figure 2-6: DKAP in a Multiproduct environment
As shown in Figure 2-6, the Kanbans are separated into different buffers as they arrive from downstream of the manufacturing system.
2.5.3 Shared Kanban Allocation Policy (SKAP)
In the SKAP, the products do not only have to share the production capacity but also the available Kanbans. The Kanbans are released based on a FIFO discipline to the part type for which demand first arrived, provided a part is available to release downstream.
21 Demand A Part A Demand B Part B Manufacturing Stage Shared Kanbans
Figure 2-7: SKAP in a Multiproduct environment
In Figure 2-7, it is shown how the Kanbans that are detached from parts downstream are kept in a common buffer, from where they can be used to authorise the downstream processing of any of the parts. It should be noted that apart from the FIFO discipline, other possible disciplines can also be applied in the release of Kanbans to the parts. Such disciplines could prioritise the release of Kanbans to parts based on their current numbers of unfulfilled demands at a particular stage, or even globally using the current levels of customer demand backlogs at the last stage. Such approaches have been applied in the scheduling of operations for multiple parts in order to minimise setup times, as earlier described in Section 2.5 [33, 85, 87].
It has been reported that some pull strategies are not able to operate a SKAP owing to the tight level of coupling that exists in these strategies in the movement of demands, Kanbans and parts [10]. Demands, which are always synonymous with the part from which they originally emanated, will consequently extend their affiliation to the Kanbans. This limitation applies to CONWIP and the KCS because there is a tightly coupled Kanban and demand information transmission, and to the BSCS because there is no Kanban transmission at all [88]. It should however be mentioned that a recent study made modifications to CONWIP to enable it operate a SKAP in a strategy referred to as Basestock Kanban-CONWIP (BK-CONWIP) [81]. The study decoupled the return of Kanbans to the first stage from the upstream transmission of demand information, in such a way that the Kanban does not always end up being used to authorise the processing of the same product type as that from which it was detached. Another factor that has made the application of SKAP to CONWIP achievable, specifically in assembly lines, is the possibility to follow either the simultaneous or independent Kanban release approaches [11] which were earlier noted in Section 1.2. The SEKCS approach uses a joint Kanban to authorise the release of components for
22
assembly, while the IEKCS uses separate Kanbans to independently authorise the release of individual components for assembly. The effect of this variation in approach is that the joint Kanban requires all the components to be available before simultaneously releasing them into the assembly stage and sending their respective Kanbans upstream to authorise the processing of replenishment parts. On the other hand, the use of separate Kanbans means that the components can be released into the assembly stage independently and have their respective Kanbans sent upstream immediately to authorise the processing of replenishment parts.
2.5.4 Logic of Operation of Kanban Allocation Policies under EKCS and GKCS
The logic of a policy differs slightly depending on the pull strategy under which it is being operated. For instance, it has been observed that the EKCS DKAP and the GKCS DKAP are equivalent to the KCS DKAP when the number of Kanbans, ܭ, is equal to the basestock level, ܵǢ whereas this does not apply to either the EKCS SKAP or the GKCS SKAP [10]. Therefore, the following sub-sections will provide further descriptions of how the policies operate under the EKCS and the GKCS, which are the two strategies that can operate either policy. The other strategies that are only able two operate the DKAP will not be further described, since their logic is a direct extension of the single product system, with each product having its own Kanbans independently of the other products.
EKCS DKAP and SKAP
A DKAP policy operates in a multiproduct system as a direct extension of the single product system. As shown in Figure 2-8, each part type has its own demand information and set of stage Kanbans which are synchronised and transmitted independently of the other products in the system, as earlier described in Section 2.2.5.
The only points of contact are at the manufacturing stages where parts that have been authorised for processing are queued in the input buffer and processed in a FIFO discipline based on their order of arrival to the input buffer. It should be noted that the FIFO discipline pays no attention to when the demand actually arrived for a part, instead it recognises when it was able to synchronise with a Kanban and a part for processing.
23
Figure 2-8: Operation of the DKAP under the EKCS from [10]
So, for instance in Figure 2-8, the order of processing of Parts, ܲଵ and ܲଶ, at Stage ʹ, will be based strictly on the order in which they arrived at its input buffer, without any consideration for when their respective demand information, ܦଵ and ܦଶ, arrived to their
demand buffers, ͳʹ and ʹʹ. Other disciplines as described in Section 2.5 might handle this differently.
The SKAP would use the same FIFO discipline as the DKAP to order parts for processing at the manufacturing stage. However, additionally in the SKAP, the parts have to be prioritised for accessing the shared pool of Kanban. As shown in Figure 2-9, there is a shared buffer to which the Kanbans detached from the parts are returned for use by any of them. A Kanban will be released to the parts based on the time of arrival of their demand to a stage, provided there is a part available to be released downstream.
Figure 2-9: Operation of the SKAP under the EKCS from [10]
For instance, at Stage ʹ in Figure 2-9, when a demand, ܦଵ, for part type ͳ arrives to
buffer, ͳʹ, a Kanban is assigned from the buffer, ʹ, to that part type to merge with it,
ࡰ ࡰ ࡰ ࡰ ࡼ ࡼ ࡰ ࡰ ࡷ ࡷ ࡷ ࡷ ࡰ ࡼ ࡼ ࡼ ࡷ ࡼ ࡷ ࡼ ࡷ ࡼ ࡷ ࡼ ࡷ ࡼ ࡷ ࡼ ࡷ ࡼ ࡷ ࡰ ۻ۾ ۻ۾ ͳͳͳͳ ʹʹͲͲ ͳͳʹʹ ͳͳ͵͵ ʹʹ͵͵ ʹʹʹʹ ʹʹͳͳ ͳͳͳͳ ͳͳʹʹ ͳͳʹʹ ʹʹʹʹ ʹʹͳͳ ʹʹʹʹ ͳͳʹʹ ͳͳͳͳ ͳͳͲͲ ࡰ ࡰ ࡰ ࡰ ࡰ ࡰ ࡰ ࡷ ࡷ ࡷ ࡷ ࡼ ࡷ ࡼ ࡷ ࡼ ࡷ ࡼ ࡷ ࡼ ࡷ ࡼ ࡷ ࡼ ࡷ ࡼ ࡷ ࡼ ࡼ ࡼ ࡼ ࡰ ۻ۾ ۻ۾ ͳͳͳͳ ʹʹͳͳ ͳͳ͵͵ ͳͳͲͲ ͳͳͳͳ ͳͳʹʹ ʹʹͲͲ ʹʹͳͳ ͳͳ ʹʹ ͳͳʹʹ ʹʹʹʹ ʹʹ͵͵ ʹʹʹʹ
![Figure 2-8: Operation of the DKAP under the EKCS from [10]](https://thumb-us.123doks.com/thumbv2/123dok_us/10933895.2982115/39.892.175.799.123.377/figure-operation-dkap-ekcs.webp)
![Figure 2-10: Operation of the DKAP under the GKCS from [10]](https://thumb-us.123doks.com/thumbv2/123dok_us/10933895.2982115/40.892.175.802.620.852/figure-operation-dkap-gkcs.webp)
![Figure 2-11: Operation of the SKAP under the GKCS from [10]](https://thumb-us.123doks.com/thumbv2/123dok_us/10933895.2982115/41.892.180.811.261.498/figure-operation-skap-gkcs.webp)
![Figure 2-12: First Order Dominance [172]](https://thumb-us.123doks.com/thumbv2/123dok_us/10933895.2982115/56.892.250.731.747.973/figure-first-order-dominance.webp)