Journal of Physics: Conference Series
PAPER • OPEN ACCESS
Using Big Data to Determine Potential Dropouts in Higher Education
To cite this article: Amelec Viloria et al 2020 J. Phys.: Conf. Ser. 1432 012077View the article online for updates and enhancements.
Content from this work may be used under the terms of theCreative Commons Attribution 3.0 licence. Any further distribution
ICE4CT 2019
Journal of Physics: Conference Series 1432 (2020) 012077
IOP Publishing doi:10.1088/1742-6596/1432/1/012077
Using Big Data to Determine Potential Dropouts in Higher
Education
Amelec Viloria1, Alexa Senior Naveda2, Hugo Hernández Palma3, William Niebles Núñez4, Leonardo Niebles Núñez5
1,2 Universidad de la Costa, Barranquilla, Atlántico, Colombia 3, 5 Universidad del Atlántico, Puerto Colombia, Atlántico, Colombia. 4Universidad del Sucre, Sincelejo, Sucre, Colombia.
1Email: [email protected]
Abstract. In higher education, student dropout is a relevant problem, not just in Latin America but also in developed countries. Although there is no consensus to measure the education quality, one of the important indicators of university success is the time to graduation (TTG), which is directly related to student dropout [1]. Global estimates put this dropout rate at 42% [2]. In the United States, this rate is around 30% and represents a loss of 9 billion dollars in the education of these students [3]. However, desertion not only affects the quality of education and the economy of a country, but also has effects on the development of society, since society demands the contributions derived from the population with higher education such as: innovation, knowledge production and scientific discovery [4]. Using basic statistical learning techniques, this paper presents a simple way to predict possible dropouts based on their demographic and academic characteristics.
1.Introduction
There are several investigations that determine dropout in Latin America. Most of them are about determining the factors that lead to desertion, measuring the number of dropout students and mechanisms to reduce it [5]. There are two proposals for the quantification of dropout: the first one is established as the proportion of students graduating in a given time corresponding to the time to get the degree; and the second one is just the number of students who drop out of their studies. In order to reduce desertion, these researches propose to improve mechanisms for early detection of potential dropout students.
The application of statistical learning methods to address the problem of desertion has already been proposed by several studies, analyzing either desertion or completion of a course [6] or a career [3,7,8,9]. Some of the methods used in these studies are: logistic regression, k-nearest neighbors, decision trees including random forests, Bayesian networks, neural networks, among others. The present study chooses a balance between ease of interpretation and precision [10], with special emphasis on the detection of dropout students rather than on the reduction of bad classifications. Two methods were selected to generate comprehensible models: decision trees and logistic regression; and two methods that offer great precision capacity: naive bayes and k-nearest neighbors. These 4 methods together will produce a compromise solution between comprehensibility and precision, the latter being evaluated mainly by the percentage of detected dropouts [11].
This paper presents a framework of early detection systems for potential dropouts, by using together the four already mentioned techniques. To measure the effectiveness of the framework, these techniques
ICE4CT 2019
Journal of Physics: Conference Series 1432 (2020) 012077
IOP Publishing doi:10.1088/1742-6596/1432/1/012077
2
are applied to the dataset from the academic system of a higher education institution, name Universidad de Estudios Superiores (UES)
2. Method
2.1 Preliminary analysis
In essence, this project intends to compare the characteristics of students who drop out versus the characteristics of those who keep studying, in order to define a rule or model that differentiates them. In this study, a student is considered a dropout if he or she has stopped studying for the last 3 years (2016, 2017, and 2018) and has not graduated.
Figure 1 shows the trend in dropout rate of students who entered the UES for the period 2016-2018, classified by gender. This dropout rate has been decreasing to 13.75% for women and 24.36% for men; however, they are still high percentages, especially if translated into absolute amounts.
Figure. 1. Dropout behavior by year and sex.
Figure 1 also reflects that there is a considerable difference in desertion between the two groups. This difference shows not only that there has been a higher percentage of male than female dropouts, but that the gap between these two groups has narrowed, but has always existed. Table 1 shows the percentage comparison of dropouts by gender. Pearson's 𝜒2 statistics [12] for the independence test of this contingency table is 85.96 with a value of p<0.0001, indicating that dropout and gender are not independent. However, the latter does not imply that gender is able to discriminate between dropouts and non-dropouts.
Table 1. Desertion of students who entered from 2016 to 2018
Feminine Masculine All
Quantity % Quantity % Quantity % Dropout 391 13.75 1,010 24.36 1,407 20.15 Non-Dropout 2,449 86.25 3,135 75.64 5,578 79.85 Total 2,840 100.00 4,145 100.00 6,985 100.00
2.2 Selecting the target dataset
For the selection of the target dataset, the second half of the year 2016 will be taken as the "time instant". Specifically, the target dataset is made up of students who joined the UES in 2016 and studied in semester 2016-2s with the characteristics they had at that instant of time. This data set consists of 6,985 students of which 1,407 are dropouts.
Men Women 2013 2012 2011 2010 2009 35.00% 30.00% 25.00% 20.00% 15.00% 10.00% 5.00% 0.00%
ICE4CT 2019
Journal of Physics: Conference Series 1432 (2020) 012077
IOP Publishing doi:10.1088/1742-6596/1432/1/012077
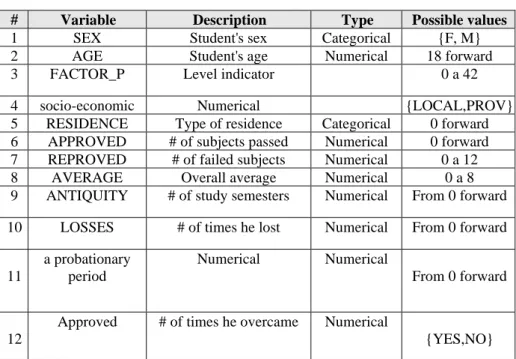
The set of selected variables is divided into 2 groups: the variables related to the personal characteristics of the student and the variables related to his/her academic behavior. Table 2 shows the description of each of these variables. The probationary period mentioned in the variables "Passed" and "Missed" refers to the semester in which a student has the last opportunity to pass (approve) a course after failing twice in previous semesters; failing such course in the probationary period restricts the student from continuing studying in the same career.
Table 2. Description of the selected variables.
# Variable Description Type Possible values
1 SEX Student's sex Categorical {F, M}
2 AGE Student's age Numerical 18 forward
3 FACTOR_P Level indicator 0 a 42
4 socio-economic Numerical {LOCAL,PROV}
5 RESIDENCE Type of residence Categorical 0 forward 6 APPROVED # of subjects passed Numerical 0 forward 7 REPROVED # of failed subjects Numerical 0 a 12 8 AVERAGE Overall average Numerical 0 a 8 9 ANTIQUITY # of study semesters Numerical From 0 forward 10 LOSSES # of times he lost Numerical From 0 forward
11 a probationary period Numerical Numerical From 0 forward 12
Approved # of times he overcame Numerical
{YES,NO}
2.3 Training of classification models
For the application of techniques, 75% of the data is taken for training and the remaining 30% for tests. Several random samples are taken with the 72-34 scheme. After the generation of the models with the training samples, the precision of the models is evaluated.
The applied methods that present easy-to-interpret models are: decision tree and logistic regression. Both methods allow to determine the variables that present the greatest influence on university desertion. Decision trees may have incidental rules that lack generality, taking them into account would lead to the effect known as over-adjustment [13, 14, 15]. After the training with different samples, the following general rule is obtained:
If (APPROVED < 14.5 and REPROVED > 5.5) Then, it is a dropout.
otherwise IT IS NON-DROPOUT
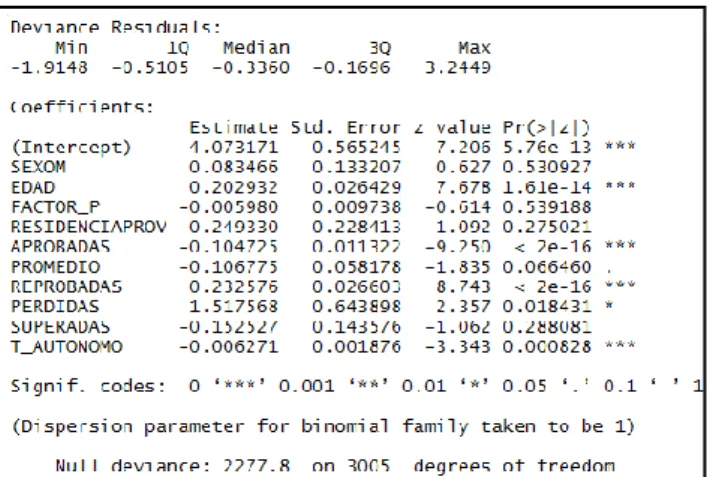
Logistic regression is a classification method that allows predicting the probability of student dropout. The results of the application of this method to one of the training samples are shown in Figure 2. As observed, the pro-desertion variables are age and number of failed subjects with coefficients of 0.2 and 0.24 respectively; while the variables that could avoid desertion are the number of approved subjects and the student's autonomous work with coefficients of -0.1 and -0.007 respectively; all these influence variables with a p value less than 0.00011. The other 2 methods that apply to the dataset are: K-Nearest Neighbors and Naive Bayes. These methods, known as delayed methods, do not always generate an explicit model in the way of the decision tree or logistic regression and use the most processing time when consulted about the classification of a new element [16].
ICE4CT 2019
Journal of Physics: Conference Series 1432 (2020) 012077
IOP Publishing doi:10.1088/1742-6596/1432/1/012077
4
Figure 2. Logistic regression report of a sample, generated with the R statistical program.
2.4 Validation of classification models
The main interest is to predict with reasonable precision the dropout rate of a group of students, which is why the percentage of correct classifications is not widely used as a measure of evaluation. Applying 10-fold cross validation for the naive bayes and logistic regression methods, average detection percentages of 22.47% and 29.26% respectively are obtained.
The cross-validation technique is especially useful for the determination of the ideal k-value in the K-nearest neighbor method. In this case, Leave-One-Out cross validation is used, which consists of taking all the elements except one to train the model, being the surplus element used for the test [17].
3. Results y discussion
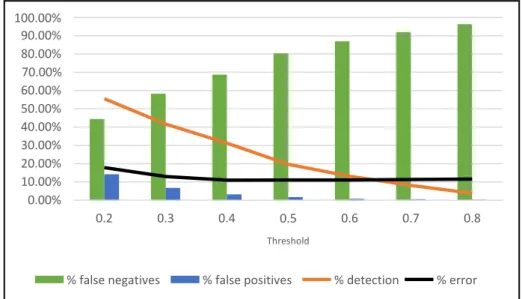
This section shows the results of evaluating each method with 5 test sets. In evaluating each method, the following rates can be obtained: bad classifications, false positives, false negatives and detection. In the case of logistic regression, it is common to label a new student as a dropout if the probability of desertion obtained is greater than 0.6. However, lower values for this threshold decrease false negatives, but on the other hand, increase false positives. In this respect, Figure 3 shows the behavior of the different rates as the threshold varies. The selection of the threshold is not entirely objective, since it depends, to a large extent, on the resources available to the institution to deal with false positives. According to the figure, a value for the threshold could be 0.3 or 0.4, since a detection percentage greater than 30% is obtained with a false positive percentage less than 12%. It is interesting to note that the percentage of poor ratings (% error) varies very little for threshold values between 0.2 and 0.5.
ICE4CT 2019
Journal of Physics: Conference Series 1432 (2020) 012077
IOP Publishing doi:10.1088/1742-6596/1432/1/012077
Figure3. Trends in the main logistic regression indicators, average.
Table 3 shows a summary of the test for each of the methods. In this table, the best and worst results are observed for each method, being logistic regression the method with the best percentage of average detection, with threshold of 0.5.
Table 3. Detection percentages by method and by sample.
Methods Tree Knn1 Naive Bayes Logit (0.4)
sample 1 27.13% 31.24% 40.01% 39.14% sample 2 21.10% 32.23% 35.66% 31.63% sample 3 15.71% 31.24% 23.55% 28.26% sample 4 18.39% 33.37% 24.51% 28.85% sample 5 18.35% 26.78% 25.22% 29.83% Average 20.73% 31.25% 31.98% 32.34%
In order to find the percentage of global detection of dropouts, it is necessary to apply each method sequentially and count the new dropouts that arise. Table 4 shows the final summary of the successive application of the 4 methods of the project. As can be seen, the estimation of the project's capacity to predict university dropout is greater than 54% and its precision to correctly classify is greater than 84%.
Table 4. Cumulative detection percentage and precision per sample.
Methods Tree Knn1 Naive Bayes Logit (0.4) Precision
sample 1 27.14% 42.78% 54.12% 56.33% 83.47% sample 2 21.14% 42.23% 53.24% 54.47% 82.25% sample 3 15.83% 33.67% 48.36% 47.25% 81.75% sample 4 12.39% 33.40% 42.98% 48.47% 82.65% sample 5 17.34% 38.63% 47.47% 52.98% 83.47% Average 20.73% 37.88% 46.35% 54.24% 82.58% % error % detection % false positives % false negatives 0.8 0.7 0.6 0.5 Threshold 0.4 0.3 0.2 100.00% 90.00% 80.00% 70.00% 60.00% 50.00% 40.00% 30.00% 20.00% 10.00% 0.00%
ICE4CT 2019
Journal of Physics: Conference Series 1432 (2020) 012077
IOP Publishing doi:10.1088/1742-6596/1432/1/012077
6
4. Conclusions
Generally speaking, the results obtained show that the more students progress in their studies, the less likely they are to drop out; and with the exception of age, the personal characteristics of the students have little influence on their dropout from university.
According to the decision tree method, failing more than 4 subjects in the early stages of the career significantly contributes to desertion. In the case of logistic regression, the variables that most contribute to student dropout are: age and the number of failed subjects. On average, it was found that older students have 24% more chances (odds) of dropping out than those who are a year younger; and, for each failed subject, the chances of dropout versus non-dropout are increased by 30%. On the other hand, each approved subject reduces the ratio between the probability of dropping out versus not dropping out by 18% and the consultation of bibliographic material reduces this same ratio by 2% for each day of consultation.
Since the variables "lost" and "passed" do not influence dropout, it is concluded that failing a subject while on probation is not a guarantee of university dropout; just as overcoming a probationary period does not imply greater resilience in studies.
After the experiments, it is estimated that the average capacity of the project to detect a possible dropout is greater than 54%; and, the average capacity to classify a student in the correct group is greater than 84%.
In the case of the prediction on the current data, when applying the 4 methods of discrimination to the 6,985 students registered in the second semester of 2017, it was obtained that around 24% of the students were detected as possible dropouts by at least one of the methods; while 330 students were detected by more than 2 methods thus increasing their risk of dropout.
The preliminary results obtained in this research indicate that the teaching-learning process could benefit from focusing on students detected as possible dropouts, allowing them to have greater access not just to specialized bibliographic material but also to better opportunities to increase their autonomous work, thus favoring their active learning. Some of the next steps to enhance these results would be to estimate the time that managers have before the student drops out, as calculated in [18]; and, the incorporation of non-cognitive aspects into the analysis, as suggested in [19]. Also a longitudinal semester-by-semester analysis to obtain the average precision to detect potential dropouts, the incorporation of other methods like SVM to increase the detection capacity and the increase in the collection of data related to the autonomous work of the student that goes beyond bibliographical consultations, are some of the proposals for future investigations.
References
[1] Pineda Lezama, O., & Gómez Dorta, R. (2017). Techniques of multivariate statistical analysis: An application for the Honduran banking sector. Innovare: Journal of Science and Technology, 5 (2), 61-75
[2] Viloria A., Lis-Gutiérrez JP., Gaitán-Angulo M., Godoy A.R.M., Moreno G.C., Kamatkar S.J. (2018) Methodology for the Design of a Student Pattern Recognition Tool to Facilitate the Teaching - Learning Process Through Knowledge Data Discovery (Big Data). In: Tan Y., Shi Y., Tang Q. (eds) Data Mining and Big Data. DMBD 2018. Lecture Notes in Computer Science, vol 10943. Springer, Cham
[3] Badr, G.; Algobail, A.; Almutairi, H.; Almutery, M.: Predicting Students’ Performance in University Courses: A Case Study and Tool in KSU Mathematics Department. Procedia Computer Science, Vol. 82, pp. 80-89 (2016)
[4] Hutt, S.; Gardener, M.; Kamentz, D.; Duckworth, A.; D'Mello, S.: Prospectively Predicting 4-year College Graduation from Student Applications. Proceedings of the 8th International Conference on Learning Analytics and Knowledge, pp. 280-289 (2018)
[5] Ahuja, R.; Kankane, Y.: Predicting the probability of student's degree completion by using different data mining techniques. Fourth International Conference on Image Information Processing (ICIIP), pp. 1-4 (2017)
ICE4CT 2019
Journal of Physics: Conference Series 1432 (2020) 012077
IOP Publishing doi:10.1088/1742-6596/1432/1/012077
[6] Martins, L.; Carvalho, R.; Victorino, C.; Holanda, M.: Early Prediction of College Attrition Using Data Mining. 16th IEEE International Conference on Machine Learning and Applications (ICMLA), pp. 1075-1078 (2017)
[7] James, G.; Witten, D.; Hastie, T.; Tibshirani, R.: An Introduction to Statistical Learning. Springer 7th Ed, pp. 25 (2014)
[8] Russell, S.; Norvig, P.: Artificial Intelligence A Modern Approach. Pearson Education 3rd Ed, pp. 705 (2010)
[9] Makhabel, B.: Learning Data Mining with R. Packt Publishing 1st Ed, pp. 143 (2015)
[10] Witten, I.; Frank, E.; Hall, M.; Pal, C.: Data Mining Practical Machine Learning Tools and Techniques. Elsevier 4th Ed, pp. 167-169 (2016).
[11] Bucci, N., Luna, M., Viloria, A., García, J. H., Parody, A., Varela, N., & López, L. A. B. (2018, June). Factor analysis of the psychosocial risk assessment instrument. In International Conference on Data Mining and Big Data (pp. 149-158). Springer, Cham.
[12] Gaitán-Angulo, M., Viloria, A., & Abril, J. E. S. (2018, June). Hierarchical Ascending Classification: An Application to Contraband Apprehensions in Colombia (2015–2016). In Data Mining and Big Data: Third International Conference, DMBD 2018, Shanghai, China, June 17– 22, 2018, Proceedings (Vol. 10943, p. 168). Springer.
[13] Viloria, A., & Lezama, O. B. P. (2019). An intelligent approach for the design and development of a personalized system of knowledge representation. Procedia Computer Science , 151 , 1225-1230.
[14] Viloria A., Lis-Gutiérrez JP., Gaitán-Angulo M., Godoy A.R.M., Moreno G.C., Kamatkar S.J. (2018) Methodology for the Design of a Student Pattern Recognition Tool to Facilitate the Teaching - Learning Process Through Knowledge Data Discovery (Big Data). In: Tan Y., Shi Y., Tang Q. (eds) Data Mining and Big Data. DMBD 2018. Lecture Notes in Computer Science, vol 10943. Springer, Cham
[15] Viloria, A., Bucci, N., Luna, M., Lis-Gutiérrez, J. P., Parody, A., Bent, D. E. S., & López, L. A. B. (2018, June). Determination of dimensionality of the psychosocial risk assessment of internal, individual, double presence and external factors in work environments. In International Conference on Data Mining and Big Data (pp. 304-313). Springer, Cham.
[16] Demsar, J., Curk, T., Erjavec, A., Gorup C, Hocevar, T., Milutinovic, M., Mozina, M., Polajnar, M., Toplak, M., Staric, A., Stajdohar, M., Umek, L., Zagar, L., Zbontar, J., Zitnik, M., Zupan, B.: Orange: Data Mining Toolbox in Python. Journal of Machine Learning Research 14(Aug):2349−2353 (2013).
[17] Pretnar, A. The Mystery of Test & Score. Ljubljana: University of Ljubljana. Retrieved from: https://orange.biolab.si/blog/2019/1/28/the-mystery-of-test-and-score/ (2019).
[18] Demšar, J., & Zupan, B. Orange: Data mining fruitful and fun-a historical perspective. Informatica, 37(1), 55-60. (2013).
[19] Yasser, A. M., Clawson, K., & Bowerman, C.: Saving cultural heritage with digital make-believe: machine learning and digital techniques to the rescue. In Proceedings of the 31st British Computer Society Human Computer Interaction Conference (p. 97). BCS Learning & Development Ltd. (2017).