Optimization of Software Project
Risk Assessment
Using Neuro-Fuzzy Techniques
Mukesh Vijay Goyal
Department of Computer Science and Engineering
National Institute of Technology Rourkela
Optimization of Software Project
Risk Assessment
Using Neuro-Fuzzy Techniques
Thesis submitted in partial fulfillment of the requirements for the degree of
Master of Technology
inComputer Science and Engineering
(Specialization: Computer Science)
by
Mukesh Vijay Goyal
(Roll Number - 213CS1142)
Under the supervision of
Prof. S. K. Rath
Department of Computer Science and Engineering
National Institute of Technology Rourkela
Rourkela, Odisha, 769 008, India
Department of Computer Science and Engineering
National Institute of Technology Rourkela
Rourkela-769 008, Odisha, India.
Date: May 31, 2015
Certificate
This is to certify that the work in the thesis entitledOptimization of Software Project Risk Assessment Using Neuro-Fuzzy TechniquebyMukesh Vi-jay Goyal is a record of an original research work carried out by him under my supervision and guidance in partial fulfillment of the requirements for the award of the degree of Master of Technology with the specialization of Computer Science in the department of Computer Science and Engineering, National Institute of Technology Rourkela. Neither this thesis nor any part of it has been submitted for any degree or academic award elsewhere.
Acknowledgment
I am grateful to numerous local and global peers who have contributed towards shaping this thesis. At the outset, I would like to express my sincere thanks to Prof. Santanu Ku. Rath for his advice during my thesis work. As my supervisor, he has constantly encouraged me to remain focused on achieving my goal. His observations and comments helped me to establish the overall direction to the research and to move forward with investigation in depth. He has helped me greatly and been a source of knowledge.
I am also thankful to all the Professors at the department for their support. I would like to thank Mr. Shashank Mouli Satapathy, Research Scholar for his encouragement and support. His help can never be penned with words.
I would like to thank all my friends and lab-mates for their encouragement and understanding. Their help can never be penned with words.
I must acknowledge the academic resources that I have got from NIT Rourkela. I would like to thank administrative and technical staff members of the Department who have been kind enough to advise and help in their respective roles.
Last, but not the least, I would like to dedicate this thesis to my family, for their love, patience, and understanding.
Mukesh Vijay Goyal Roll-213CS1142
Abstract
Hazard evaluation assumes a pivotal part in the product venture administra-tion. The discriminating examination of distinctive danger evaluation techniques help specialists and professionals to assess the effect of different venture related dangers. The existing Fuzzy Expert Cost Constructive Model(Fuzzy ExCOM) model is a combination of fuzzy technique and Expert COCOMO. It takes help of mastery and data from prior exercises conveyed for expense and exertion es-timation. However, it has limitations that it can’t make space for backing from other noteworthy rules related to risks. The proposed work examinations the ef-fect of the ANN technique for software project risk assessment. It serves to create danger standards utilizing Artificial Neural Network techniques to enhance the exactness of danger evaluation process. The combination of various optimization algorithm like Genetic Algorithms and Particle Swarm Optimization are applied collaboratively with Neural network to get best initial starting solution for Neural Network. The results show that this strategy with accessible task information and Neuro-Fuzzy Risk assessment technique provides enhanced outputs than existing Fuzzy Ex-com technique.
Contents
Certificate ii
Acknowledgement iii
Abstract iv
List of Figures vii
List of Tables viii
Abbreviations ix
1 Introduction 1
1.1 COCOMO . . . 2
1.2 Risk Assessment . . . 2
1.2.1 Expert COCOMO . . . 2
1.2.2 Fuzzy Expert Cost Constructive Model (Fuzzy Ex-COM) . . 3
1.3 Problem Definition . . . 4
1.4 Motivation . . . 4
1.5 Dataset used for Model Validation . . . 4
1.6 Evaluation Parameters . . . 5
1.7 Thesis Organization . . . 5
2 Literature Survey 6 2.1 Basic Risk Assessment . . . 6
2.2 Risk Assessment using COCOMO and ANN Technique . . . 7
3 RA using GA Based Neuro-Fuzzy Model 8
3.1 Artificial Neural Network . . . 8
3.1.1 Back-Propagation Algorithm . . . 9
3.1.2 Radial Basis Function Network (RBFN) Algorithm . . . 10
3.1.3 Why using COCOMO Cost Drivers for Risk Assessment? . . 11
3.1.4 Application of Genetic Algorithm . . . 13
3.2 Approach and Implementation . . . 13
3.3 Analysis of Results . . . 15
3.4 Conclusion . . . 17
4 RA using PSO based Neuro-fuzzy Model 18 4.1 Particle Swarm Optimization (PSO) . . . 18
4.2 Approach and Implementation . . . 18
4.3 Implementation . . . 20
4.4 Conclusion . . . 21
5 Comparison of Results 22
6 Conclusions and Future Work 24
List of Figures
1.1 Risk Level Assignment Matrix . . . 3
1.2 Fuzzy Ex-COM (Fuzzy Expert COCOMO) . . . 4
3.1 Artificial Neural Network. . . 9
3.2 Basic Structure of RBF Network . . . 10
3.3 . . . 13
3.4 Proposed Steps Used for GA based Risk Assessment using Neuro-Fuzzy Technique . . . 14
3.5 Project risk values generated using ANN-Fuzzy on NASA93 dataset. 15 3.6 Project risk values generated using RBFN-Fuzzy on NASA93 dataset. 16 4.1 Proposed Steps Used for PSO based Risk Assessment using Neuro-Fuzzy Technique . . . 19
List of Tables
3.1 Correlation coefficient value all risk rules . . . 12
3.2 Results of neuro-fuzzy techniques . . . 16
4.1 Results of PSO-based neuro-fuzzy techniques . . . 20
5.1 Project Risk values using Fuzzy ExCOM Model . . . 22
List Of Abbreviations
ANN Artificial Neural Network
BP Back-Propagation
RBFN Radial Basis Function Network
PSO Particle Swarm Optimization
KLOC Kilo Lines Of CODE
NASA National Aeronautics and Space Administration
RA Risk Assessment
GA Genetic Algorithm
COCOMO Cost Constructive Model
Ex-COM Expert COCOMO
MSE Mean Square Error
MMRE Mean Magnitude of Relative Error
Chapter 1
Introduction
Risk assessment is the fundamental activity in project management process. Since future of project is uncertain, its success depends on assessing risks in advance. Hazard administration is for the most part assembled with exertion estimation in the product task arranging procedure. It includes the procedure of distinguishing, drawing closer and moderating risks before any real blame comes up [1].
In the risk identification process potential risk to the software project is iden-tified. When various risks have been recognized, they should then be evaluated as to their potential seriousness of impact. In risk mitigation activity effective risk reduction plans are set to reduce the impact when risk is encountered. When the planning for risk management is done, the next step is to monitor risk. Monitoring include reviewing planned activities and updating it. The action incorporated in this stride is to distinguish new threats as quickly as time permits and choose where and how to take action in order to mitigate various risks. prior in the cur-rent model [2], risk rules are demonstrated by experts framework which presents irregularity in the estimations of risk rules for diverse projects. As a result it enhances the peculiarity, if the risk rule setter is to be change. This paper pro-poses optimization of risk assessment using Neuro-fuzzy model that integrates the nonlinear training characteristic of ANNs with fuzzy system having capacity to oversee oversensitive and linguistic information. It creates risk principles utilizing ANN methods to enhance the precision of risk assessment model.
1.1 COCOMO Introduction
1.1
COCOMO
The COCOMO is acronym for Cost Constructive Model. It is used for cost esti-mation of the software projects. This effort estiesti-mation technique was developed by Prof. Barry Boehm in 1981 and accordingly known as COCOMO 81. This tradi-tional version is not very much suitable for estimation of today’s complex software development project. For this reason, new COCOMO-II method has been pro-posed. The estimation process of COCOMO II makes use of fifteen cost drivers. These cost drivers are scaled in the range of very low to very high. Each scal-ing is associated with numerical value found empirically. The fifteen cost drivers are classified in four groups and these groups are named as product attribute, computer attribute, personnel attribute and project attribute.
1.2
Risk Assessment
There are various risk assessment models are available in literature. Each model possesses different properties and assessment technique. One of the technique for risk assessment is using COCOMO cost drivers. This study is based on risk assessment using COCOMO cost drivers and application of few machine learning techniques. The existing Expert COCOMO and Fuzzy Ex-COM techniques are explained in the following section.
1.2.1
Expert COCOMO
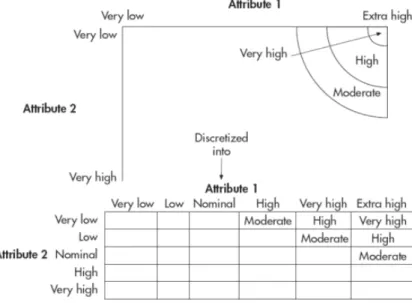
In the the Expert COCOMO risk evaluation model, project risk is calculated by considering combination of two cost factors used in COCOMO II. In the fig. 1.1, the matrix represents the level of risk associated with that two combination of cost factors only. At the end, the equation for getting complete risk is as follows:
P rojectRisk= M X j=1 N X i=1 RiskLevelij ×EM Pij (1.1) 2
1.2 Risk Assessment Introduction
Figure 1.1: Risk Level Assignment Matrix
where
EMP is the Effort Multiplier Product. M= Number of Category.
N= Number of Risk Category.
The proposed model intends to apply ANNs for project risk assessment-based on the program that is already available at the USC forum [3] as background studies.
1.2.2
Fuzzy Expert Cost Constructive Model (Fuzzy
Ex-COM)
A fuzzy framework is a scientific model that dissects semantic terms which tackle nonstop values somewhere around zero and one. To improve the responsiveness of the system, the existing system [2] are utilized for calculating the software project risk. In the Fig. 1.2 fuzzy ex-com system is having three layers namely, input layer, processing layer output layer.
In the input layer, all cost driver values and software size measured in terms of kilo lines of code (KLOC) and are presented as input.
1.3 Problem Definition Introduction
Figure 1.2: Fuzzy Ex-COM (Fuzzy Expert COCOMO)
1.3
Problem Definition
This study intends to develop and validate a risk assessment model that classifies the project into three different risk category such as low risk, moderate risk, high risk.
1.4
Motivation
Various studies have been finished and reported in writing that investigate the fail-ure or success rates of development projects. The most recent CHAOS Summary 2009 reports that 32% of the activities were passed on time with obliged functions and performance [4]. These study show that significant issues exist in surveying future dangers over an expansive cross-segment of commercial enterprises. One of the exploration studies made by Microsoft [5] expressed that wandering of just 5% of the general spending plan into risk administration serves to discover estimation of likelihood to finish extend on time with around 50-70% change.Risk assessment in todays development projects is once in a while honed and hard to actualize [6].
1.5
Dataset used for Model Validation
NASA93 [7] dataset has been collected from PROMISE repository. This Dataset consist of 93 software project values. Each project having fifteen cost drivers
1.6 Evaluation Parameters Introduction
values, software size in KLOC and actual development effort. The cost driver values are given in linguistic form. Out of 93 project values, 75% project values are used for training neural network model and rest 25% are used for testing model accuracy.
1.6
Evaluation Parameters
The different evaluation criteria taken in this study for performance analysis of the various neuro-fuzzy techniques can be referred from the paper [18].
1.7
Thesis Organization
Chapter-1: This chapter presents the introduction to the study on opti-mization of software project risk assessment using neuro-fuzzy technique.
Chapter-2: This chapter summarizes the existed work done in software project risk assessment area along with different dataset, tools and tech-niques used for assessing in different literatures.
Chapter-3: In this chapter, first neural network processing is explained and how this technique is applied in risk assessment process is stated. Next application of genetic algorithm is presented. Implementation and approach is explained in the last.
Chapter-4: This chapter illustrates the same implementation and approach as explained in previous chapter but with the different optimization algo-rithm called particle swarm optimization.
Chapter-5: This chapter illustrates the same implementation and approach as explained in previous chapter but with the different optimization algo-rithm called particle swarm optimization.
Chapter-6: In this chapter, the observation of the results and conclusion to the study is done.
Chapter 2
Literature Survey
2.1
Basic Risk Assessment
Barry Boehm [8] described emerging discipline of software risk management. He has identified various risk assessment models with support of implementation de-tails to validate a model.
A. V. Deursen et al. [9] assessed the project risk based on facts available for project. The facts include software project size, development effort. He has also taken account of people working on the project and documentation available for project. He described how this facts are interpreted properly to assess the project risk.
Daya Gupta et al. [10] worked on the project risk due to failure of project or over budget. They has proposed risk assessment and estimation model. This model is efficiently accurate in predicting risks involved in software project. The Mission Critical Requirements Stability Risk Metrics are used in this paper for estimating risk. This model assesses risk for every phase of software development life cycle.
Li-Yun Chang et al. in 2013 [11] performed a case study on Information Secu-rity Risk Assessment.
2.2 Risk Assessment using COCOMO and ANN Technique Literature Survey
2.2
Risk Assessment using COCOMO and ANN
Technique
Hua Jiang in 2009 [12] proposed a novel approach for project risk assessment-based on the various ANN techniques.
Wen-Ming Han [13] proposed a three-layered neural network (NN) architecture with a back propagation algorithm using OMRON dataset. From the analysis, it was found that NN approach is useful for predicting whether a project is risky or not. His approach helps to improve accuracy and sensitivity by more than 12.5% and 33.3%.
Yong Hu et al. [14] proposed a model using Bayesian Networks with causality constraints (BNCC). The accuracy found of this model is not fulfilling the failure rate of todays software project. They showed that the proposed model can not just find mortality as per the master information additionally perform preferable in expectation over different calculations, such as logistic regression, Naive Bayes, and general Bayesian Networks.
Chapter 3
Risk Assessment using Genetic
Algorithm Based Neuro-Fuzzy
Model
3.1
Artificial Neural Network
Artificial Neural Network (ANN) [15] has an strong nonlinear mapping capacity, with high learning capacity, high order and expectation precision. ANNs are ex-pected to mimic like a human brain, and its working is same as the biological neuron structure present in the human brain, but the working of ANN is based on mathematical proofs. The neurons are interconnected in such a way that helps in making computation. Each neuron process the input taken from one or more neurons and generate its output. Much of the time an ANN is considered to be a versatile framework where its structure makes progress taking into account of outside or inside data that moves through the system amid the learning stage. In more commonsense terms that neural systems are non-direct factual informa-tion demonstrating devices. There are numerous system models, however in the paper two basic systems are considered: Back-propagation(BP) and Radial Basis Function Network [16–18] are discussed.
3.1 Artificial Neural Network RA using GA Based Neuro-Fuzzy Model
3.1.1
Back-Propagation Algorithm
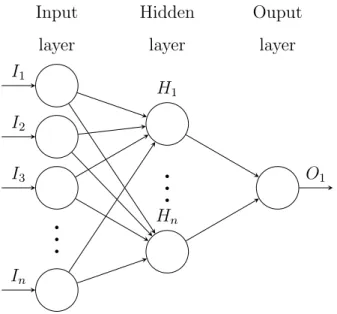
A Back-propagation algorithm is also known as feed-forward ANN algorithm. In a feed-forward ANN, only neurons of adjacent layers are interconnected with synap-tic weights. It connects directly to the external environment and captures the input patterns presented to the network. The last layer is the output layer which produces the output pattern to the external environment. All other layers are considered as hidden and they may or may not be present.
..
.
..
.
I1 I2 I3 In H1 Hn O1 Input layer Hidden layer Ouput layerFigure 3.1: Artificial Neural Network.
The processing of a feed-forward neural network begins when an external pat-tern made is copied to the input layer. The input presented to the input layer are processed before passing to the next layer. This process is known as activation function. The function used for input layer is as follows:
Oh =
1
1 +e−Ih (3.1)
where Ih is the input to the hidden layer.
The neurons of the input layer communicate the pattern to the following layers through synapses. The pattern is then received by neurons of non-input layers and modulated by the weight of their connections. Output of the output layer
3.1 Artificial Neural Network RA using GA Based Neuro-Fuzzy Model
“Oo” is represented as follows:
Oo =
1
1 +e−Oi (3.2)
Where Oi is the input to the output layer. A neural network thus can be
represented as follows:
EO0 =f(W, EI) (3.3)
Once the inputs are modulated, as well as integrated and an activation value is determined.
3.1.2
Radial Basis Function Network (RBFN) Algorithm
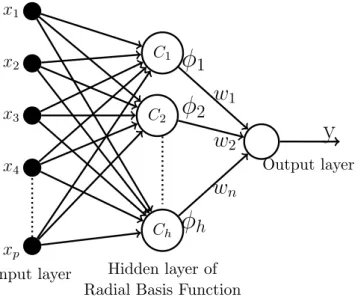
In the layered architecture of RBFN, three layers are there. This layers are called Input layer, Output layer and Hidden layer. The nodes in the hidden layer define center for each individual classification category. These nodes are called as radial centers. The input passes through this center that gives greater value for those input having closer value to the center value. Change from information space to shrouded unit space is nonlinear while change from concealed unit space to yield space is direct. C1
φ
1w
1 C2φ
2w
2 Chφ
hw
n Output layery
Input layer Hidden layer of Radial Basis Function
x1
x2
x3
x4
xp
Figure 3.2: Basic Structure of RBF Network
3.1 Artificial Neural Network RA using GA Based Neuro-Fuzzy Model
Learning in RBFN algorithm is carried out using any of three different tech-niques. In this thesis, Pseudo-Inverse Technique learning algorithm has been ap-plied. The width of the radial function is determined by an improvised way by considering the following technique:
Pseudo-Inverse Technique,
Gradient Descent Learning,
Hybrid Learning
The target output is computed as follows:
y0 =
n X
i=1
φiWi (3.4)
where Wi is the weight of the ith center, φ is the radial function, andy0 is the
target output. In this paper, the basis function used is the Gaussian function, and the distance vector is calculated as follows:
z =||xj −cj|| (3.5)
where xj is input vector that lies in the receptive field for center cj. The
activation function is defined as:
φi = e−z2
i
2σ2 (3.6)
3.1.3
Why using COCOMO Cost Drivers for Risk
Assess-ment?
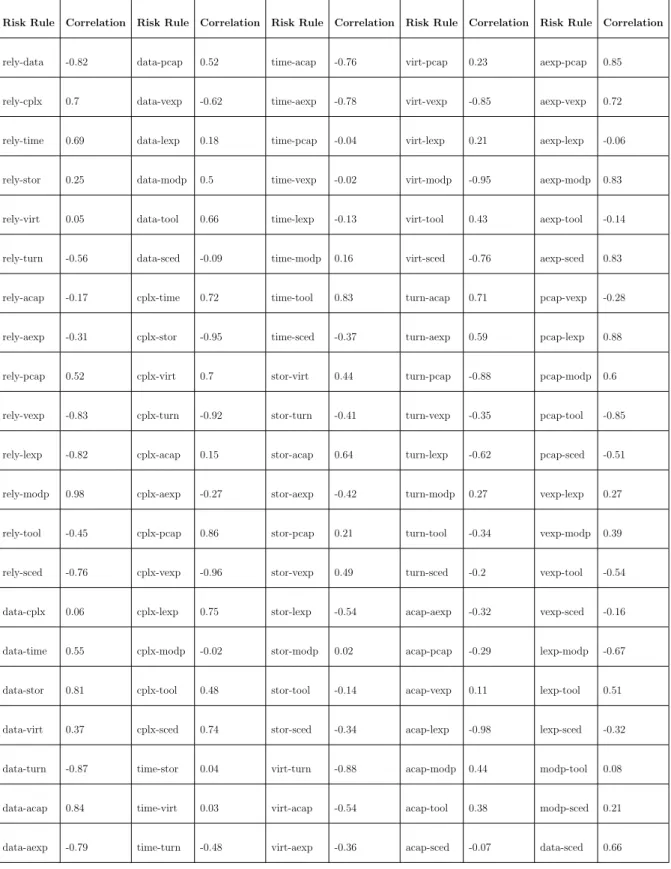
The correlation between the project risk rules and Software size(KLOC) is taken into consideration in thesis. Out of all trained 105 risk rules, few are eliminated with less correlation value. The correlation coefficient values for all 105 risk rules are shown in the Table 3.1.
3.1 Artificial Neural Network RA using GA Based Neuro-Fuzzy Model
Table 3.1: Correlation coefficient value all risk rules
Risk Rule Correlation Risk Rule Correlation Risk Rule Correlation Risk Rule Correlation Risk Rule Correlation
rely-data -0.82 data-pcap 0.52 time-acap -0.76 virt-pcap 0.23 aexp-pcap 0.85
rely-cplx 0.7 data-vexp -0.62 time-aexp -0.78 virt-vexp -0.85 aexp-vexp 0.72
rely-time 0.69 data-lexp 0.18 time-pcap -0.04 virt-lexp 0.21 aexp-lexp -0.06
rely-stor 0.25 data-modp 0.5 time-vexp -0.02 virt-modp -0.95 aexp-modp 0.83
rely-virt 0.05 data-tool 0.66 time-lexp -0.13 virt-tool 0.43 aexp-tool -0.14
rely-turn -0.56 data-sced -0.09 time-modp 0.16 virt-sced -0.76 aexp-sced 0.83
rely-acap -0.17 cplx-time 0.72 time-tool 0.83 turn-acap 0.71 pcap-vexp -0.28
rely-aexp -0.31 cplx-stor -0.95 time-sced -0.37 turn-aexp 0.59 pcap-lexp 0.88
rely-pcap 0.52 cplx-virt 0.7 stor-virt 0.44 turn-pcap -0.88 pcap-modp 0.6
rely-vexp -0.83 cplx-turn -0.92 stor-turn -0.41 turn-vexp -0.35 pcap-tool -0.85
rely-lexp -0.82 cplx-acap 0.15 stor-acap 0.64 turn-lexp -0.62 pcap-sced -0.51
rely-modp 0.98 cplx-aexp -0.27 stor-aexp -0.42 turn-modp 0.27 vexp-lexp 0.27
rely-tool -0.45 cplx-pcap 0.86 stor-pcap 0.21 turn-tool -0.34 vexp-modp 0.39
rely-sced -0.76 cplx-vexp -0.96 stor-vexp 0.49 turn-sced -0.2 vexp-tool -0.54
data-cplx 0.06 cplx-lexp 0.75 stor-lexp -0.54 acap-aexp -0.32 vexp-sced -0.16
data-time 0.55 cplx-modp -0.02 stor-modp 0.02 acap-pcap -0.29 lexp-modp -0.67
data-stor 0.81 cplx-tool 0.48 stor-tool -0.14 acap-vexp 0.11 lexp-tool 0.51
data-virt 0.37 cplx-sced 0.74 stor-sced -0.34 acap-lexp -0.98 lexp-sced -0.32
data-turn -0.87 time-stor 0.04 virt-turn -0.88 acap-modp 0.44 modp-tool 0.08
data-acap 0.84 time-virt 0.03 virt-acap -0.54 acap-tool 0.38 modp-sced 0.21
data-aexp -0.79 time-turn -0.48 virt-aexp -0.36 acap-sced -0.07 data-sced 0.66
3.2 Approach and Implementation RA using GA Based Neuro-Fuzzy Model
Figure 3.3
3.1.4
Application of Genetic Algorithm
Genetic Algorithm (GA) is used for various optimization problems. In this study, GA is applied to help in finding correct initial weight vectors for ANN technique used in this model. The complete process for how to use GA to assist neural network is explained in [19]. Mixing of GA to neural network can be synergistic where they are utilized simultaneously, or strong where they are utilized consecu-tively. Collective mixing regularly include utilizing genetic calculations to establish structure for ANN.
3.2
Approach and Implementation
The proposed model is validated using NASA93 dataset, which is publicly available on the PROMISE repository [7]. The Fig. 3.4 depicts the various steps applied for software project risk assessment using Neuro-fuzzy technique.
1. Data Preparation: In this data preparation process, 75% of the dataset is used for training purpose and rest 25% is used for testing. The dataset of NASA93 is in COCOMO 81 model format. Hence it is required to con-vert it into COCOMO-II format because COCOMO-II is applied in our risk
3.2 Approach and Implementation RA using GA Based Neuro-Fuzzy Model
assessment model.
2. Data Normalization: The values of cost factors of project in NASA93 dataset is in linguistic terms. To make this values to feed as input for our model taheir is need to convert it into numerical form. MIN MAX normalization [20] formula is used to do so.
Data Preperation
Data Normalization
Train Risk Rules
Risk Level Calculation
Defuzzification
Performance Evaluation
Figure 3.4: Proposed Steps Used for GA based Risk Assessment using Neuro-Fuzzy Technique
3. Risk Rule Training: The training of both BP [15] and RBFN [21] neural networks is done as per procedure explained in the previous section. These neural networks are first trained without application of GA and it is then trained using application GA. GA is applied to optimally select the initial vectors for neural network. These rules are then considered as input to fuzzy inference engine.
4. Risk Level Calculation: Using the input from fuzzification process and knowledge base (Risk Rules) generated by neural network, the level of project risk is computed. This process is done under fuzzy inference engine block. The output of this block is given as input to the defuzzification block.
3.3 Analysis of Results RA using GA Based Neuro-Fuzzy Model
5. Defuzzification: The output from deffuzifier is taken and The defuzzifica-tion process performs the classificadefuzzifica-tion of risk level value from numeric fuzzy value into crisp value.
6. Performance Analysis: The analysis on the results of proposed model are carried in this process. This analysis can be done using various techniques explained in [22]. The formula for performance parameters used in this work are explained in section 1.5. All the values for MSE, MMRE and PRED values are calculated using the actual output and desired output.
3.3
Analysis of Results
The Performance parameter values of combination of both two ANN techniques and optimization algorithm are compared in this section. The results of overall project risks of NASA93 dataset are displayed in the next chapter. The following table shows the comparison between them.
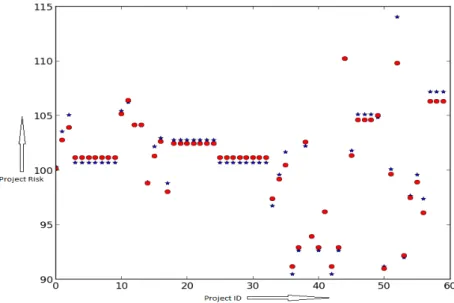
Figure 3.5: Project risk values generated using ANN-Fuzzy on NASA93 dataset.
Fig. 3.5 shows the risk value of projects from 1 to 60 using ANN-Fuzzy model on NASA93 dataset. From the above figure, it can be observed that the project
3.3 Analysis of Results RA using GA Based Neuro-Fuzzy Model
risk values are less scattered and majority of risk values are coming under moderate category.The various risks are further categorized into different sections by taking combination of risk rules as shown in table 5.1 and 5.2.
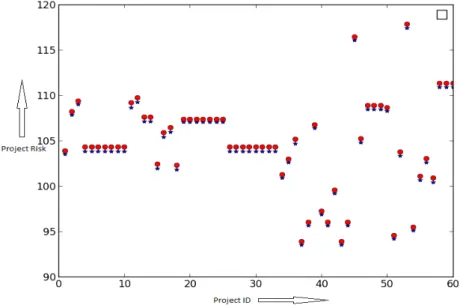
Figure 3.6: Project risk values generated using RBFN-Fuzzy on NASA93 dataset.
Fig. 3.6 shows the risk value of projects from 1 to 60 using RBFN-Fuzzy model on NASA93 dataset. From the above figure, it can be observed that the project risk values are little bit more scattered than ANN-Fuzzy risk values.
Table 3.2: Results of neuro-fuzzy techniques
Neural Network Technique MSE MMRE PRED Back-propagation without GA 0.0038 0.4523 94.07
Back-propagation with GA 0.0055 0.60 95.00 RBFN without GA 0.0045 0.5203 94.07 RBFN with GA 0.0034 0.39 96.00
From the table 3.2 it is observed that among all five implementation of RBFN with GA is giving best results.
3.4 Conclusion RA using GA Based Neuro-Fuzzy Model
3.4
Conclusion
In this study, Neuro-GA approach has been proposed for software project risk assessment. In addition to that, correlation between software size and risk rules is found in order to support significance of project size in evaluating project risk value.
Chapter 4
Risk Assessment using Particle
Swarm Optimization based
Neuro-fuzzy Model
4.1
Particle Swarm Optimization (PSO)
PSO is an enhancing technique. The algorithm is kindred to societal conduct of bird rallying. PSO resemblance a features of genetic algorithm. PSO is a computational insight based system that is not to a great extent influenced by the size and nonlinearity of the issue, what’s more, can unite to the ideal arrangement in numerous issues, where most expository strategies neglect to meet.
4.2
Approach and Implementation
To effectively train all the risk rules using PSO technique based Neuro-fuzzy Model the NASA93 dataset, which is publicly available on the PROMISE repository [7] is used. The risk rules are trained using both application of PSO and without its application. The Fig. 4.1 shows the steps involved in process of software project risk assessment.
The following section explains the process for software risk assessment:
4.2 Approach and Implementation RA using PSO based Neuro-fuzzy Model
Data Preperation
Data Normalization
Train Risk Rules
Risk Level Calculation
Defuzzification
Performance Evaluation
Figure 4.1: Proposed Steps Used for PSO based Risk Assessment using Neuro-Fuzzy Technique
1. Data Preparation: In this data preparation process, 75% of the dataset is used for training purpose and rest 25% is used for testing. The dataset of NASA93 is in COCOMO 81 model format. Hence it is required to con-vert it into COCOMO-II format because COCOMO-II is applied in our risk assessment model.
2. Data Normalization: The values of cost factors of project in NASA93 dataset is in linguistic terms. To make this values to feed as input for our model taheir is need to convert it into numerical form. MIN MAX normalization [20] formula is used to do so.
3. Risk Rule Training: The risk rules are evaluated using different neural network techniques namely back-propagation [15], RBFN [21]. The training of both neural networks is done as per procedure explained in the previous section. These neural networks are first trained without application of PSO and it is then trained using application PSO. PSO is applied to optimally select the initial vectors for neural network. But, while training the neu-ral network it is found that it takes more time to train neuneu-ral network as
4.3 Implementation RA using PSO based Neuro-fuzzy Model
compared to train it without application of PSO.
4. Risk Level Calculation: Using the input from fuzzification process and knowledge base (Risk Rules) generated by neural network, the level of project risk is computed. This process is done under fuzzy inference engine block. The output of this block is given as input to the defuzzification block. 5. Defuzzification: The output from deffuzifier is taken and The
defuzzifica-tion process performs the classificadefuzzifica-tion of risk level value from numeric fuzzy value into crisp value.
6. Performance Analysis: The analysis on the results of proposed model are carried in this process. This analysis can be done using various techniques explained in [22]. The formula for performance parameters used in this work are explained in section 1.5. All the values for MSE, MMRE and PRED values are calculated using the actual output and desired output.
4.3
Implementation
The Performance parameter values of combination of both the ANN techniques and optimization algorithm is compared in this section. The results of overall project risks of NASA93 dataset are compared in the next chapter. The following table shows the comparison between them.
Table 4.1: Results of PSO-based neuro-fuzzy techniques
ANN Techniques MSE MMRE PRED
BP without PSO 0.0038 0.4523 94.07
BP with PSO 0.0070 0.86 91.32
From the table 4.1, it is obtained that among all four implementation Back-Propagation without PSO is giving better results.
4.4 Conclusion RA using PSO based Neuro-fuzzy Model
4.4
Conclusion
As Particle Swarm Optimization technique works better for continuous optimiza-tion problems, but our dataset is discrete. Hence, It can be concluded that the reason behind the poor results of PSO implementation for risk assessment is due to mentioned issue of discrete nature of dataset.
Chapter 5
Comparison of Results
The table 5.1 and 5.2 displays the project risk values obtained using Fuzzy Ex-COM technique. The values for prediction accuracy has been obtained for RBFN based Neuro-Fuzzy model are comparatively better. Hence, only RBFN results are compared with existing model in the Table 5.2.
Table 5.1: Project Risk values using Fuzzy ExCOM Model
Risk Category Project Risk Schedule Risk Process Risk
High 17.07 26.73 47.74 High 18.9 27.4 54.03 High 18.63 27.12 52.74 Moderate 9.76 14.04 13.2 Moderate 9.77 14.04 13.26 High 18.52 21.33 29.18 Moderate 12.37 19.05 23.67 Moderate 14.48 22.79 21.86 Moderate 14.34 22.65 21.28 Moderate 14.27 18.13 28.15 Moderate 14.32 18.17 28.38 Moderate 14.43 18.25 28.86 High 16.27 18.69 30.99 High 23.74 25.93 38.33 Moderate 14.26 18.12 28.09 High 17.24 21.5 28.75 High 17.12 21.41 28.21 High 17.03 21.34 27.82
Table 5.1 shows the risk calculation results-based on Fuzzy ExCOM model col-22
Comparison of Results
lected from the article [2] and table 5.2 shows the risk calculation results obtained using proposed neuro-fuzzy technique based risk assessment model.
Table 5.2: Project Risk values using Neuro-Fuzzy Model
Risk Category Project Risk Schedule Risk Process Risk
Moderate 105.3 13.09 48.5 Moderate 107.7 13.19 51.38 Moderate 106.8 13.3 50.32 Low 104.1 12.68 49.54 Low 104.1 12.68 58.21 High 133.3 13.59 49.91 Moderate 112.6 12.28 49.73 Moderate 107.2 11.9 49.73 Moderate 107.2 11.9 57.967 High 120.3 12.82 57.97 High 120.3 12.82 57.29 Moderate 118.2 12.69 63.21 High 124.7 13.13 55.53 High 121.5 13.4 57.97 High 120.3 12.8 57.59 High 121.8 13.41 53.74 High 121.8 13.41 53.74 High 121.8 13.41 53.74
From the results, it is found that Neuro-Fuzzy technique exhibits better corre-lation values than other existing techniques, which in-turn helps in assessing the project risk more effectively.
Chapter 6
Conclusions and Future Work
Various risks are associated with any kind of product development. This the-sis work makes an effort to assess software project risk using a small subset of machine learning algorithms. In the proposed model, significant seventy rules are chosen for evaluation of project risk, while in earlier model only thirty-one rules were derived from expert system. Hence by analyzing, it is observed that the Neuro-Fuzzy technique-based risk assessment model outperforms simply fuzzy Logic based models. Future work may include adding security factors for the risk assessment of a software project. J Sedlackova [25] has proposed a model for the estimation of effort with the inclusion of security factors as an attribute in the COCOMO model. The same security attributes can be extended in the Expert COCOMO model for evaluating the risk values in a software project.
Bibliography
[1] Barry W Boehm and Tom DeMarco. Software risk management. IEEE soft-ware, 14(3):17–19, 1997.
[2] E Manalif, LF Capretz, and D Ho. Fuzzy-excom software risk assess-ment. In11th International Conference on Machine Learning and Application ICMLA12, Boca Raton Florida, US, pages 12–15, 2012.
[3] CSE Center for Software Engineering - Expert COCOMO, 2011 (accessed November, 2011).
[4] Standish Group et al. Chaos summary 2009, 2010.
[5] Steve McConnell. Software project survival guide. Microsoft press, 1997. [6] Raymond J Madachy. Heuristic risk assessment using cost factors. IEEE
software, 14(3):51–59, 1997.
[7] NASA93 COCOMO data set.
[8] Barry W Boehm. Software risk management: principles and practices. Soft-ware, IEEE, 8(1):32–41, 1991.
[9] Arie Van Deursen and Tobias Kuipers. Source-based software risk assessment. InSoftware Maintenance, 2003. ICSM 2003. Proceedings. International Con-ference on, pages 385–388. IEEE, 2003.
[10] Daya Gupta and Mohd Sadiq. Software risk assessment and estimation model. In Computer Science and Information Technology, 2008. ICCSIT’08. Inter-national Conference on, pages 963–967. IEEE, 2008.
Bibliography
[11] Li-Yun Chang and Zne-Jung Lee. Applying fuzzy expert system to informa-tion security risk assessment-a case study on an attendance system. In Fuzzy Theory and Its Applications (iFUZZY), 2013 International Conference on, pages 346–351. IEEE, 2013.
[12] Hua Jiang. The application of artificial neural networks in risk assessment on high-tech project investment. In Business Intelligence and Financial En-gineering, 2009. BIFE’09. International Conference on, pages 17–20. IEEE, 2009.
[13] Wen-Ming Han. Discriminating risky software project using neural networks. Computer Standards & Interfaces, 40:15–22, 2015.
[14] Yong Hu, Xiangzhou Zhang, EWT Ngai, Ruichu Cai, and Mei Liu. Soft-ware project risk analysis using bayesian networks with causality constraints. Decision Support Systems, 56:439–449, 2013.
[15] Sundaramoorthy Rajasekaran and GA Vijayalakshmi Pai. NEURAL NET-WORKS, FUZZY LOGIC AND GENETIC ALGORITHM: SYNTHESIS
AND APPLICATIONS (WITH CD). PHI Learning Pvt. Ltd., 2003.
[16] Shashank Mouli Satapathy, Aditi Panda, and Santanu Kumar Rath. Story point approach based agile software effort estimation using various svr kernel methods. In The Twenty-Sixth International Conference on Software Engi-neering & Knowledge EngiEngi-neering, pages 304–307. SEKE, 2014.
[17] Shashank Mouli Satapathy, Mukesh Kumar, and Santanu Kumar Rath. Class point approach for software effort estimation using soft computing techniques.
In Advances in Computing, Communications and Informatics (ICACCI),
2013 International Conference on, pages 178–183. IEEE, 2013.
[18] Shashank Mouli Satapathy, Mukesh Kumar, and Santanu Kumar Rath. Fuzzy-class point approach for software effort estimation using various adap-tive regression methods. CSI transactions on ICT, 1(4):367–380, 2013.
Bibliography
[19] Yung-Keun Kwon and Byung-Ro Moon. Nonlinear feature extraction using a neuro genetic hybrid. InProceedings of the 7th annual conference on Genetic and evolutionary computation, pages 2089–2096. ACM, 2005.
[20] Han Jiawei and Micheline Kamber. Data mining: concepts and techniques. San Francisco, CA, itd: Morgan Kaufmann, 5, 2001.
[21] Sheng Chen, Colin FN Cowan, and Peter M Grant. Orthogonal least squares learning algorithm for radial basis function networks. Neural Networks, IEEE Transactions on, 2(2):302–309, 1991.
[22] Dongning Guo, Yihong Wu, Shlomo Shamai, and Sergio Verd´u. Estimation in gaussian noise: Properties of the minimum mean-square error. Information Theory, IEEE Transactions on, 57(4):2371–2385, 2011.
[23] Jacob Benesty, Jingdong Chen, Yiteng Huang, and Israel Cohen. Noise re-duction in speech processing, volume 2. Springer, 2009.
[24] Yong Hu, Xiangzhou Zhang, Xin Sun, Mei Liu, and Jianfeng Du. An intelli-gent model for software project risk prediction. InInformation Management, Innovation Management and Industrial Engineering, 2009 International Con-ference on, volume 1, pages 629–632. IEEE, 2009.
[25] Jana Sedl´ackov´a. Security factors in effort estimation of software projects. ACM Slovakia, 3(2):12–17, 2011.
Dissemination of Work
Mukesh Vijay Goyal, Shashank Mouli Satapathy and Santanu Kumar Rath, “Software Project Risk Assessment based on Cost Drivers and Neuro-Fuzzy Technique” IEEE Internatoinal Conference on Computing, Communication and Automation (ICCCA), IEEE, pp. 723 - 727, May 2015.