Professional Studies Faculty Publications
Department of Professional Studies
4-2014
Differences in Student Evaluations of
Limited-Term Lecturers and Full-Time Faculty
Jeong il Cho
Indiana University - Purdue University Fort Wayne, [email protected]
Koichiro Otani
University of Georgia, [email protected]
B. Joon Kim
Kookmin University, [email protected]
Follow this and additional works at:
http://opus.ipfw.edu/profstudies_facpubs
Part of the
Education Commons
This Article is brought to you for free and open access by the Department of Professional Studies at Opus: Research & Creativity at IPFW. It has been accepted for inclusion in Professional Studies Faculty Publications by an authorized administrator of Opus: Research & Creativity at IPFW. For more
information, please [email protected].
Opus Citation
Jeong il Cho, Koichiro Otani, and B. Joon Kim (2014). Differences in Student Evaluations of Limited-Term Lecturers and Full-Time Faculty.Journal on Excellence in College Teaching.25 (2), 5-24.
5
Differences in Student Evaluations
of Limited-Term Lecturers
and Full-Time Faculty
Jeong-Il Cho
Indiana University - Purdue University Fort Wayne
Koichiro Otani
University of Georgia
B. Joon Kim
Kookmin University
This study compared student evaluations of teaching (SET) for limited-term lecturers (LTLs) and full-time faculty (FTF) using a Likert-scaled survey administered to students (N = 1,410) at the end of university courses. Data were analyzed using a general linear regression model to investigate the influence of multi-dimensional evaluation items on the overall rating item (Overall, I would rate the instructor of this course as out-standing) on the SET. Results showed that students provided higher ratings for LTLs than FTF, but they value different items when rating the overall evaluation of LTLs and FTF. Some survey items (for instance, those about instructor planning and enthusiasm) influence more on the rating of the overall item for LTLs than for FTF, whereas other, multi-dimensional items (for instance, those about assessment strategies and instructor’s availability) influence more on the overall rating for FTF than for LTLs. Data and discussions of results identify the differences and suggest strategies for improving teaching effectiveness based on the ratings provided by students.
limit-ed-term lecturers (LTLs) and full-time faculty (FTF) on the end-of-course evaluation form differently? What aspects (that is, the multi-dimensional evaluation items) influence students’ overall rating of teaching effective-ness (that is, the global item on the student evaluation form) of LTLs and FTF? Despite the fact that the increasing use of LTLs is a national trend in providing instruction to students across disciplines in higher education institutions (American Association of University Professors [AAUP], 2006; Sonner, 2000), only a few empirical studies have focused on the teaching effectiveness of LTLs (Klein, Weisman, & Smith, 1996; Landrum, 2009; Langen, 2011; Sonner, 2000). Consequently, how students evaluate the teaching of LTLs in comparison with that of FTF is still in debate in higher education, especially at four-year universities. LTLs or adjunct professors typically are practitioners who work full-time and have considerable real-world experiences in community-based workplaces and specialized technical skills in their fields (Wallin, 2004). LTLs are employed at higher education institutions in increasing numbers for various reasons, which include their real-world experiences, their specialized knowledge, and the scheduling flexibility and cost effectiveness they offer to institutions (Wallin, 2007).
The Teaching Effectiveness
of Limited-Term Lecturers and Full-Time Faculty
Inconsistent results have been reported on the teaching effectiveness of LTLs using student evaluations of teaching (SET), exam results, grades, graduation rates, and the like (Hellman, 1998; Jackson, 1986; Landrum, 2009; Rifkin, 1998; Sonner, 2000). Among studies on the comparison of teaching effectiveness of LTLs and FTF, only a limited number of stud-ies attempted a systematic analysis of SET data (Hellman, 1998). Other studies have focused mostly on differences between LTLs and FTF using a simple mean comparison of the SET ratings, uncontrollable variables (for example, student or instructor demographic characteristics), and disparity in the distribution of grades or graduation rates, measures that may not represent the teaching effectiveness of instructors accurately. Another pattern that emerged in previous studies with LTLs showed that many of these studies focused on the teaching ratings of LTLs at two-year colleges, including community and/or technical colleges, and that little is known about LTLs at four-year institutions.
When comparing SETs for LTLs versus FTF, an older study by Jackson (1986) showed that FTF were rated higher than LTLs on knowledge of the subject and class preparation. Yet another study by Hellman (1998)
showed no such differences in community colleges, even though this study used rather a systematic statistical analysis of the SET data (for in-stance, factor structures) than simple mean comparisons. In a more recent
study, Jacoby (2006) shifted the focus on graduation rates to investigate
the difference between LTLs and FTF and concluded that the decrease in graduation rates was related to the increase in the number of LTLs. Yet Landrum (2009) found no difference in LTLs and FTF when using multiple measures in addition to SETs.
With a marked increase in the number of LTLs in higher education institutions in recent years, previous research justifies the need for the continued use of LTLs in educating university students. However, these studies suggest a tendency to concentrate on uncontrollable variables (for example, class size, curricular area, prior interest in the course topic, expected grades, workload, difficulty, whether a course is required or elective, challenge level of course, instructor characteristics, and course
format—whether online or traditional) rather than controllable variables
(for example, teaching strategies, assessment strategies, course learning objectives, and classroom environment). This tendency does not seem to support a recent proposal from the United Kingdom (UK) National Conference on Student Evaluation that universities need to make effective use of routinely collected SET data to improve the quality of teaching at program, department, and college levels, disseminate the outcomes, and make a timely response to student needs and requests (Griffin & Cook, 2009). Also, this trend does not contribute to the identification of urgent, practical recommendations for teaching that LTLs and FTF can practice and implement in their classes in an effort to improve their teaching effectiveness.
The Use of Student Evaluations of Teaching
Documented issues with SETs include their weak validity and un-certain connection between teaching effectiveness and student learning
(Galbraith, Merrill, & Kline, 2012; Theall, Abrami, & Mets, 2001). Yet the
professional literature has acknowledged that SETs have the potential to produce valuable data for a better understanding of LTLs’ teaching effectiveness compared to FTF; to inform LTLs, FTF, and other interested parties (such as students and university administrators) about similarities and differences in teaching; and, ultimately, to provide a snapshot of the unique value of LTLs in higher education. Wolfer and Johnson (2003) emphasized the importance of making effective use of SET data for indi-vidual teaching improvement. Without prioritizing influential items on
SETs through a systemic analysis, LTLs and FTF might feel compelled arbitrarily to choose some aspects over others in the hope that future students’ overall satisfaction with their teaching would improve.
The SET is the most common method of evaluating the teaching ef-fectiveness of university instructors. For FTF, universities use multiple teaching effectiveness measures, including evidence of improvements in teaching, recommendation letters from external and internal reviewers, course portfolios, peer observations, and student evaluations and com-ments. However, such comprehensive multiple measures of teaching are not typically applied to LTLs. In general, universities rely on stu-dent evaluation data as a major measure (often the sole measure) of the
teaching performance of LTLs. Langen (2011) investigated the teaching
performance of LTLs with SET data from both two- and four-year higher education institutions and reported that the SET results were, after all, the most trusted source for overall evaluation purposes, both formative and summative.
Universities have attempted to make an effective, innovative use of SETs and to consider SET results for instructors, particularly FTF, as part of a program improvement plan (Campbell & Bozeman, 2008; Griffin & Cook, 2009; Wolfer & Johnson, 2003). However, there is a key component missing in this plan: LTLs. The results of SET for FTF are shared, system-atically analyzed, and compared across semesters/years, and thoroughly reviewed by colleagues. FTF routinely receive annual reviews, recommen-dations for merit raises, reappointment determinations, and peer reviews/ observation of teaching that are used to advance their individual teaching performance (d’Apollonia & Abrami, 1997; McKeachie, 1997). This is not a typical practice with the results of SETs for LTLs, however. SET results for LTLs are often underutilized, not systematically analyzed, and not seriously communicated to LTLs with the same rigor as they are to FTF.
The lack of empirical research on SETs related to the type of instructors (LTLs versus FTF), including what evaluation items on the SET are re-ported by students in assessing the overall teaching effectiveness of LTLs and FTF, led us to conduct this study. Using SET data, weaker aspects of instructor teaching can easily be identified. However, a simple prioritiz-ing approach such as this fails to identify which aspect(s) of instructors’ performance need to be improved first and most urgently. A recent study attempted to identify and rank-order which aspects of teaching were more influential than others to students’ overall satisfaction with instructor teaching (Otani, Kim, & Cho, 2012). However, this study considered LTLs and FTF as one group, did not focus on unique patterns of each group, and did not address possible differences between LTLs and FTF.
On the SET, students are asked to reflect on each of the evaluation items to determine their overall evaluation of an instructor’s teaching
effective-ness. Some aspects are more influential than others in determining their
overall evaluation level of an instructor’s teaching effectiveness (Otani et al., 2012). Therefore, it is logical to predict that students are more likely to evaluate their instructor’s teaching effectiveness highly when they have
positive experiences with those more influential aspects. It is also probable
that students tend to indicate dissatisfaction with a course and instructor
when they have a negative experience with those influential aspects. This
dissatisfaction can occur even when students have a favorable view of
other aspects that they consider less influential or non-influential. The
Fishbein model (Fishbein & Ajzen, 1975), which identifies which aspects are more or less influential than others in arriving at an overall evaluation of an instructor’s teaching performance, suits the purpose of this study. This seminal model was originally developed to explain individuals’ general attitudes. It has often been used in marketing to predict custom-ers’ choices of products by identifying the multiple attributes influencing their choices. Many studies have used this model in customer satisfaction research, including patient satisfaction (Otani, Kurz, & Harris, 2005) and student evaluations of teaching in education (Otani, Kim, & Cho, 2012). The Fishbein model can be applicable and helpful to studies of the SET. This model suggests that to improve students’ overall evaluation of
in-structors, a strategic improvement on the most influential aspects is more
critical than improving less influential aspects.
Methodology
Participants and Setting
This study utilized SET data from the department of public policy at
one university in the Midwestern U.S. The SET data include 1,410 student
responses collected over three academic semesters: Fall, 2009 (677 cases; 48.0%), Spring, 2010 (680 cases; 48.2%), and Summer, 2010 (53 cases; 3.8%). Among them, LTLs taught 545 cases (38.7%), and FTF taught 859 cases (60.9%). The SET survey used in this study is routinely administered at the end of each semester. Instructors distributed the SET survey in each class, but the instructors were not allowed to remain in the classroom while students completed the survey. One student in each class was asked to collect the completed surveys and brought them directly to the office responsible for collecting the surveys.
on students’ demographic backgrounds. Thus, we provide general demo-graphic information for all students in the department at the time of this study. In fall 2009, 498 students were enrolled: 229 males (46%) and 269 females (54%). The average ages for male and female students were 23.8 and 26.9, respectively. Among 453 undergraduate students, 76.2% were full-time, and 23.8% were part-time. Among the 45 graduate students, 35.6% were full-time, and 64.4% were part-time. Among all students in the study, 403 (80.9%) were Caucasian, 57 (11.4%) were Black, 11 (2.2%) were Hispanic, 7 (1.4%) were Asian, 2 (0.4%) were American Indian, and 12 (2.4%) identified as “Other.” Six international students (1.2%) were also enrolled. The public policy department offers five majors: criminal justice, environmental policy, health services administration, legal studies, and public management. The numbers of students in these classes ranged from 6 to 45, with a typical class size of 30. The department has nine full-time faculty members (six male and three female). Fifteen LTLs were hired and normally taught one course each semester.
Instrument
The public policy department employs a unified 14 evaluation-item SET, including 13 multi-dimensional items, across all classes. Consistent with the recommendation by Cashin and Downey (1992), the SET also contains one global rating item that indicates the overall evaluation of an instructor’s teaching effectiveness: Question 14. “Overall, I would rate the
instructor of this course as outstanding.” The global item was used as the
dependent variable in the study. The current set of SET evaluation items has been in use for more than 10 years. It uses a 5-point Likert-type scale from 1 (strongly disagree) to 5 (strongly agree). All evaluation items are listed in Table 1 in their original order in the SET survey.
Data Analysis
This study examined differences in student perceptions of teaching effectiveness between LTLs and FTF by distinguishing and prioritizing influential aspects on the SETs for LTLs and FTF separately. The study used a general linear regression model, often called ordinary least squares. The study analyzed the relative importance of the 13 multi-dimensional
items in arriving at an overall rating that is reflected on the rating of the
global item for LTLs and FTF. In other words, the study evaluated the
13 items and attempted to find which items have more influence on stu-dents’ overall rating for LTLs and FTF separately. The general regression
teaching, a is the intercept, bi is a coefficient, xi is an experience of the ith
aspect, and e is an error term. The significance of bi and the value of R2
were examined to test the model’s fit using the following formula:
Results
We analyzed correlational coefficient and found that all correlation co-efficients are smaller than 0.8 among independent variables. A high value
Table 1 SET Items Multi-Dimensional Items
Q1: My instructor is well prepared for class meetings. Q2: My instructor explains the subject clearly.
Q3: My instructor is enthusiastic about teaching this course. Q4: Course materials were thought-provoking and stimulating. Q5: My instructor is available for consultation.
Q6: I know what is expected of me in this course.
Q7: The exams cover the most important attributes of the course. Q8: My instructor evaluated student work in fair and appropriate
ways.
Q9: This course fulfilled the objectives described in the syllabus. Q10: My instructor created an environment in which students felt comfortable asking questions and expressing their views.
Q11: My instructor encouraged students to participate in their learning. Q12: My instructor made effective use of class time.
Q13: I acquired new knowledge in this course. Overall Evaluation Item
Q14: Overall, I would rate the instructor of this course as outstanding.
∑
=+
+
=
n i i ie
x
b
a
Y
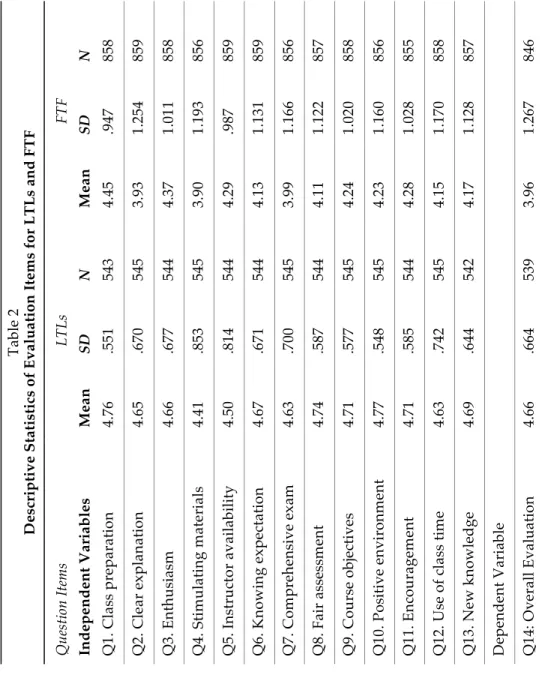
1(about 0.8 or 0.9 in absolute value) indicates higher correlation (Kennedy, 1998). Lewis-Beck (1980) claims to look for coefficients of about 0.8 or larger for possible colinearity. The scores of the variance inflation factors (VIF) are used as a colinearity test, and any value larger than 10 needs to be reviewed (Kleinbaum, Kupper, & Muller, 1988; Kennedy, 1998). This criterion was used throughout this report, and there was no VIP value larger than 10. Students’ average responses for independent variables (13 multi-dimensional evaluation items) for LTLs (ranging from 4.41 to 4.76) generally are higher than those for FTF (ranging from 3.90 to 4.45) (see Table 2). The average overall evaluation (dependent variable) for LTLs is higher than that for FTF (4.66 and 3.96, respectively). The descriptive statistics and the descriptions of all 13 items for LTLs and FTF are shown in Table 2, respectively.
A multiple linear regression analysis was conducted for LTLs and FTF
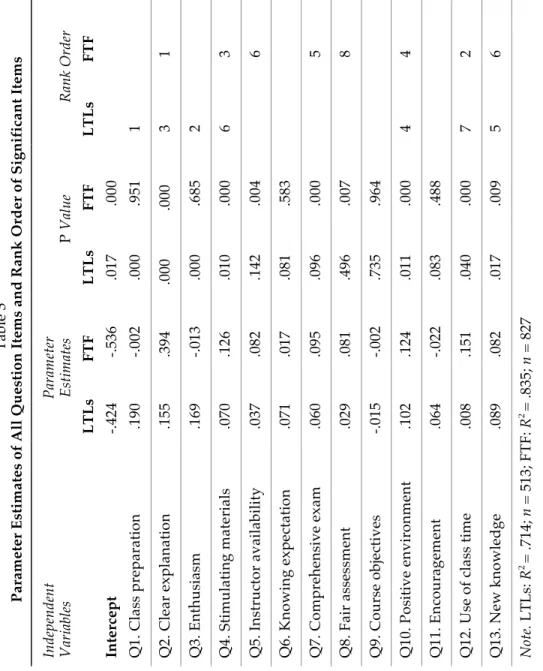
independently, and the results are shown in Table 3. For LTLs, the R2 is
0.714. The model explains 71.4% of the variance in Y. The analysis revealed that certain variables are more influential than others when students rate their overall evaluation of the teaching effectiveness of LTLs. The magnitude of influence is determined by the value of the coefficient. The larger the value of the coefficient, the more influence. For LTLs, the most influential variable is Q1 (The coefficient is 0.190), followed by Q3, Q2, Q10, Q13, Q4, and Q12 (coefficients ranging from 0.008 to 0.169), in this
order. All variables are statistically significant at the α = 0.05 level and
positively related. Other variables (Q5, Q6, Q7, Q8, Q9, and Q11) are not
statistically significant at the α = 0.05 level.
The R2 is 0.835 for FTF. The model explains 83.5% of the variance in Y. The analysis also revealed that certain variables are more influential
than others when students rate their overall evaluation of the teaching effectiveness of FTF. The most influential variable is Q2 (the coefficient is 0.394), followed by Q12, Q4, Q10, Q7, Q5, Q13, and Q8 (coefficients ranging from 0.081 to 0.151). All variables are statistically significant at the α = 0.05 level and positively related. Other variables (Q1, Q3, Q6, Q9, and Q11) are not statistically significant at the α = 0.05 level. Compared to FTF, LTLs have more statistically significant evaluation items: 9 versus 12 aspects.
Discussion
The main aim of this study was to investigate differences in influential
aspects (multi-dimensional items) on the overall evaluation (global
eval-uation item) of the teaching performance of LTLs versus FTF. The study
Tab le 2 D es cr ip tiv e S ta tis tic s o f E va lu atio n Ite m s f or L TL s a nd F TF Q uest io n I te m s LT Ls FT F Inde pe nde nt V ar ia bl es M ean SD N M ean SD N Q 1. C las s p rep ar at io n 4. 76 .551 543 4. 45 .947 858 Q 2. C lear ex pl an at io n 4. 65 .670 545 3. 93 1. 254 859 Q 3. Ent hus ia sm 4. 66 .677 544 4. 37 1. 011 858 Q 4. St im ul at in g m at er ial s 4. 41 .853 545 3. 90 1. 193 856 Q 5. In st ru ct or a va ila bilit y 4. 50 .814 544 4. 29 .987 859 Q 6. K now in g e xp ec ta tion 4. 67 .671 544 4. 13 1. 131 859 Q 7. C om pr eh en si ve ex am 4. 63 .700 545 3. 99 1. 166 856 Q 8. F ai r a sse ssm en t 4. 74 .587 544 4. 11 1. 122 857 Q 9. C ou rs e o bj ec tiv es 4. 71 .577 545 4. 24 1. 020 858 Q 10. P os iti ve en vi ro nm en t 4. 77 .548 545 4. 23 1. 160 856 Q 11. E nc ou rag em en t 4. 71 .585 544 4. 28 1. 028 855 Q 12 . U se o f cl ass t im e 4. 63 .742 545 4. 15 1. 170 858 Q 13. N ew k no w led ge 4. 69 .644 542 4. 17 1. 128 857 D epe nde nt V ar ia bl e Q 14: O ver al l E val uat io n 4. 66 .664 539 3. 96 1. 267 846
Tab le 3 Pa ra m ete r E stim ate s o f A ll Q ue stio n Ite m s a nd R an k O rd er o f S ig nif ic an t Ite m s In dep en den t V ari ab les Param et er Est im at es P V alu e R an k O rd er LT Ls FT F LT Ls FT F LT Ls FT F In te rce pt -.424 -.536 .017 .000 Q 1. C la ss pr epa ra tio n .190 -.002 .000 .951 1 Q 2. C lear ex pl an at io n .155 .394 .000 .000 3 1 Q 3. Ent hus ia sm .169 -.013 .000 .685 2 Q 4. St im ul at in g m at er ial s .070 .126 .010 .000 6 3 Q 5. In st ru ct or a va ila bilit y .037 .082 .142 .004 6 Q 6. K no w in g ex pec tat io n .071 .017 .081 .583 Q 7. C om pr eh en si ve ex am .060 .095 .096 .000 5 Q 8. F ai r a sse ssm en t .029 .081 .496 .007 8 Q 9. C ou rs e ob je ct iv es -.015 -.002 .735 .964 Q 10. P os iti ve en vi ro nm en t .102 .124 .011 .000 4 4 Q 11. E nc ou rag em en t .064 -.022 .083 .488 Q 12 . U se o f cl ass t im e .008 .151 .040 .000 7 2 Q 13. N ew k no w led ge .089 .082 .017 .009 5 6 N ot e. LTLs : R 2 = .714; n = 513 ; FT F: R 2 = . 835; n = 827
on the overall satisfaction of teaching performance on SET by rank-or-dering influential aspects and comparing them between LTLs and FTF. In contrast to studies raising various concerns about the effectiveness and quality of instruction provided by LTLs (Jackson, 1986; Rifkin, 1998), the results of this study are consistent with previous studies, in that LTLs are highly evaluated by university students (Gappa & Leslie, 1993; Klein et al., 1996) (see Table 2). More importantly, the results showed that the processes students used to combine 13 aspects to arrive at their overall evaluation of teaching effectiveness for LTLs and FTF were different.
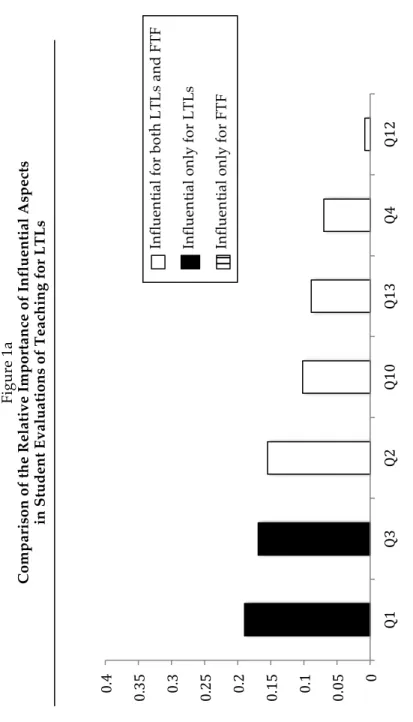
The results of the study indicated that not all aspects that were seen as influential to the overall evaluation for LTLs had the same effect for FTF, and vice versa (see Table 3 and Figure 1). The most influential aspect on the global evaluation item when rating the teaching performance of LTLs was Q1 (My instructor is well prepared for class meetings). Other sig-nificantly influential aspects for LTLs were in the following descending order: Q3. My instructor is enthusiastic about teaching this course; Q2. My
instructor explains the subject clearly; Q10. My instructor created an environ-ment in which students felt comfortable asking questions and expressing their views; Q13. I acquired new knowledge in this course; Q4. Course materials were thought-provoking and stimulating; and Q12. My instructor made effective use of class time. For FTF, we noted that Q2 was far more influential than
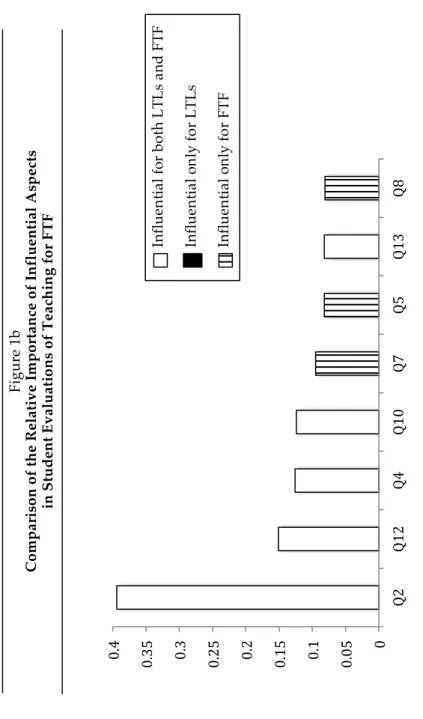
other influential aspects on the overall evaluation of FTF. Seven other influential aspects for FTF include Q12. My instructor made effective use of
class time; Q4. Course materials were thought-provoking and stimulating; Q10. My instructor created an environment in which students felt comfortable asking questions and expressing their views; Q7. The exams cover the most important attributes of the course; Q5. My instructor is available for consultation; Q13. I acquired new knowledge in this course; Q8. My instructor evaluated student work in fair and appropriate ways, respectively. (Only influential items are
listed to aid readers’ understanding.)
Five common influential aspects between the seven influential aspects for LTLs and the eight influential aspects for FTF were found: Q2. My
instructor explains the subject clearly; Q4. Course materials were thought-pro-voking and stimulating; Q10. My instructor created an environment in which students felt comfortable asking questions and expressing their views; Q12. My instructor made effective use of class time; and Q13. I acquired new knowledge in this course (see Figures 1a and 1b). These common aspects are about
quality learning experiences, a positive learning environment, and effec-tiveness and efficiency in lecture and time management. This finding is consistent with the previous literature that students, regardless of the type of instructor (LTLs or FTF), were eager to gain new knowledge, expected
Fi gu re 1 a C om pa ri so n o f th e R ela tiv e Im po rta nc e o f In flu en tia l A sp ec ts in S tu de nt E va lu at io ns o f T ea chi ng fo r LT Ls
0 0.05 0.1 0.15 0.2 0.25 0.3 0.35 0.4 Q1 Q3 Q2 Q1 0 Q1 3 Q4 Q1 2 Par amet er E stim ate In flu en tia l A sp ec ts fo r L TL s
In flu en tia l f or b ot h LT Ls a nd F TF In flu en tia l o nl y fo r L TL s In flu en tia l o nl y fo r F TF
Fi gu re 1 b C om pa ri so n o f th e R ela tiv e Im po rta nc e o f In flu en tia l A sp ec ts in S tu de nt E va lu at io ns o f T ea ch in g fo r FT F
0 0.05 0.1 0.15 0.2 0.25 0.3 0.35 0.4 Q2 Q1 2 Q4 Q1 0 Q7 Q5 Q1 3 Q8 In flu en tia l A sp ec ts fo r F TF Par amet er E stim ate
In flu en tia l f or b ot h LT Ls a nd F TF In flu en tia l o nl y fo r L TL s In flu en tia l o nl y fo r F TF
thought-provoking and stimulating learning experiences (Feldman, 1988: Merrill, 2002), and valued instructors’ clear presentation of materials (Goldstein & Benassi, 2006).
The influence levels of the highest- to lowest-ranked influential aspects
were gradually decreasing for LTLs. Such a gradual decline, however, was
not found in the evaluation of SETs for FTF. This difference is especially
evident with two aspects: Q2. My instructor explains the subject clearly and Q12. My instructor made effective use of class time. For FTF, Q2 was far more
influential than the second most influential aspect, Q12. Other aspects
following Q12 were gradually decreasing in terms of the degree of
in-fluence. It appears clear that students considered Q2 (clear explanation)
as a more important qualification of FTF than LTLs.While Q12 (use of class time) was the second-highest-ranked aspect for FTF, it was ranked as the seventh-most influential aspect for LTLs. These results indicated that students expected clear explanations and effective use of class time more from FTF than from LTLs.
Influential aspects that were statistically significant only for one type of instructor (LTLs or FTF) were also observed in the study. The first- and second-highest-ranked influential aspects for LTLs (Q1. My instructor is
well prepared for class meetings and Q3. My instructor is enthusiastic about teaching this course) were not statistically significant for the overall
evalua-tion of FTF. Three aspects (Q7. The exams cover the most important attributes
of the course; Q5. My instructor is available for consultation; and Q8. My
instructor evaluated student work in fair and appropriate ways, respectively)
were influential only for FTF. These results indicated that students per-ceived a high level of class preparation and enthusiasm to be an important qualification when evaluating LTLs. Based on a previous study, this result about instructors’ availability perhaps is reflective of the fact that students typically know that LTLs mostly work full time in the community and are less likely to have an office or hold office hours on campus (Landrum, 2009). Regarding assessment aspects that were influential for FTF, students were generally more conscientious of their grade when they were in classes taught by FTF. Sonner (2000) reported grading inflation with classes taught by LTLs: Students in the classes taught by LTLs received higher grades than those in classes taught by FTF. In this era of accountability, FTF are conscientious of objective assessment strategies, student grades, and are directly responsible for designing, implementing, improving the program assessment system, and reporting to an accrediting agency. In contrast, LTLs are less likely to play a significant role in these assessment-related activities and in curriculum development (Rifkin, 1988).
statistically influential for both LTLs and FTF: Q6. I know what is expected
of me in this course and Q9. This course fulfilled the objectives described in the syllabus. This finding is consistent with the existing literature, which
reports that students place less importance on self-initiated, independent learning than on other items (Feldman, 1988). Even though students’ understanding of course expectations and the importance of course objec-tives is not directly under instructors’ control, it still can be influenced by instructors’ conscientious efforts to emphasize the importance of course learning objectives and explicitly to make logical connections between the objectives, various course activities, and assessment (Combs, Gibson, Hays, Saly, & Wendt, 2008).
Limitations and Suggestions
Identifying patterns among areas in need of improvement as reflected in the SET is a challenge (Wolfer & Johnson, 2003). Without a systematic analysis and prioritization of the teaching evaluation information about instructors provided by students on the SET, instructors may arbitrarily choose some aspects over others in the hope that future students’ satis-faction with their teaching effectiveness will be reflected positively on the SET. This study identified students’ perceived differences between LTLs and FTF instruction to assist instructors in making improvements. There are, however, several limitations. First, because this was not an experimental but a cross-sectional study, establishing a cause-and-effect relationship was a challenging task. However, the well-established Fish-bein model (FishFish-bein & Ajzen, 1975) was used in order to support such a relationship. This relationship could be more strongly established in an intervention study that examines the improvement of teaching, especially of influential aspects.
A second limitation is that the SET employed for the study used a Likert-type scale that produces ordinal data. Some researchers question the appropriateness of using a general regression model for analyzing ordinal data. However, previous research demonstrated that regression models are frequently used for analyzing ordinal data because of their appropri-ateness and usefulness, and the results of such data analyses are robust in general (Labovits, 1970; O’Sullivan & Rassel, 1989). Third, it should be acknowledged that the SET survey used in this study may not represent all aspects that are influential to the teaching effectiveness of instructors. This could result in biased estimates. Even though the instrument was developed with careful consideration of its validity and reliability, further modification and investigation of the survey items may be necessary to
determine its comprehensiveness.Finally, the data were collected in one department of a four-year institution. While the size of the data set (N = 1, 410) is large enough for a sound statistical analysis, generalization of these findings to all public policy departments or to other university departments and programs requires caution. Other variables, such as students’ academic fields of study and level of the courses, may differ-ently influence students’ evaluation of instructors (Cashin, 1990; Vahala
& Winston, 1994; Yunker & Yunker, 2003). In addition, this study did not
use a random sample of students but was based on a single department’s
course evaluation at one university. Future studies comparing student
evaluations of LTLs and FTF might need to involve a larger, multi-insti-tutional data set from different disciplines and from universities that hire a larger number of LTLs.
Conclusions
The contribution of this study is in its focus on the influential yet con-trollable aspects of SETs toward understanding how LTLs and FTF were evaluated by students at a four-year university. This study reported stu-dents’ differing focuses in their evaluations of the teaching performance of LTLs and FTF. When evaluating their instructors, students assigned different levels of importance to evaluation aspects for LTLs versus FTF. While instructors’ planning efforts and enthusiasm were a strong focus
in the evaluation of LTLs, assessment strategies and an instructor’s
avail-ability were important evaluation considerations exclusively for FTF. For both types of instructors, at varying levels of influence, students valued clarity in presentation of materials, a positive learning environment, the acquisition of new knowledge, the effective use of class time, and stim-ulating course materials.
The results of this study emphasize the importance of involving both
LTLs and FTF in recognizing what students expect in teaching as expressed in SETs and responding to these expectations in an effective, collective
manner. Administrators can play a role here. In general, FTF are more
likely to acquire both new knowledge in the field and effective teaching strategies through continuous professional development activities offered by universities or professional conferences (Rifkin, 1998). Administrators need to ensure that all instructors, including LTLs, are knowledgeable about departmental or program-level expectations, such as assessment systems, standards, and curriculums, and that they have access to uni-versity services, including library services, professional development activities, on-campus office spaces, telephones, and e-mail accounts. Both
LTLs and FTF need to be well informed of the institution’s needs as well as the needs of their students, and administrators can help instructors rec-ognize the vital role they play in student learning (Fagan-Wilen, Springer,
Ambrosino, & White, 2006; Wallin, 2007; Ziegler & Reiff, 2006). Through
various efforts to respond systematically to students’ input, including the SET, university instructors can have more positive teaching experiences and achieve better learning experiences for their students.
References
American Association of University Professors. (2006). AAUP contingent
faculty index. Retrieved from http://www.aaup.org/AAUP/pubsres/
research/conind2006.htm
Campbell, J., & Bozeman, W. C. (2008). The value of student ratings: Per-ceptions of students, teachers, and administrators. Community College
Journal of Research & Practice, 32(1), 13-24.
Cashin, W. E. (1990). Students do rate different fields differently. New
Directions for Teaching and Learning, 43, 113-121.
Cashin, W. E., & Downey, R. G. (1992). Using global student rating items for summative evaluation. Journal of Educational Psychology, 84(4), 563-572. Combs, K. L., Gibson, S. K., Hays, J. M., Saly, J., & Wendt, J. T. (2008).
Enhancing curriculum and delivery: Linking assessment to learning objectives. Assessment & Evaluation in Higher Education, 33(1), 87-102. doi: 10.1080/02602930601122985
d’Apollonia, S., & Abrami, P. C. (1997). Navigating student ratings of instruction. American Psychologist, 52(1), 1198-1208.
Fagan-Wilen, R., Springer, D., Ambrosino, B., & White, B. (2006). The sup-port of adjunct faculty: An academic imperative. Social Work Education,
25(1), 39-51. doi: 10.1080/02615470500477870
Feldman, K. A. (1988). Effective college teaching from the students’ and faculty’s view: Matched or mismatched priorities? Research in Higher
Education, 28, 291-344.
Fishbein, M., & Ajzen, I. (1975). Belief, attitude, intention and behavior: An
introduction to theory and research. Reading, MA: Addison-Wesley.
Galbraith, C., Merrill, G., & Kline, D. (2012). Are student evaluations of teaching effectiveness valid for measuring student learning outcomes in business related classes? A neural network and bayesian analyses.
Re-search in Higher Education, 53(3), 353-374. doi: 10.1007/s11162-011-9229-0
Gappa, J. M., & Leslie, D. W. (1993). The invisible faculty: Improving the
status of part-timers in higher education. San Francisco, CA: Jossey-Bass.
about excellent lecturers and discussion leaders. Research in Higher
Education, 47(6), 685-707.
Griffin A., & Cook, V. (2009). Acting on evaluation: Twelve tips from a national conference on student evaluations. Medical Teacher, 31, 101-104. Hellman, C. M. (1998). Faculty evaluation by students: A comparison
between full-time and adjunct faculty. Journal of Applied Research in the
Community Colleges, 6(1), 45-50.
Jackson, E. J. (1986). A comparative study to determine the effectiveness of
adjunct faculty in the Business Division at Fayetteville Technical Institute.
(ERIC Document Reproduction Service No. ED 294 622). Fayetteville, AR: Nova University.
Jacoby, D. (2006). Effects of part-time faculty employment on community college graduation rates. Journal of Higher Education, 77(6), 1081-1103. Kennedy, P. (1998). A guide to econometrics (4th ed.). Cambridge, MA: The
MIT Press.
Klein, W. C., Weisman, D., & Smith, T. (1996). The use of adjunct faculty: An exploratory study of eight social work program. Journal of Social
Work Education, 32(2), 253-264.
Kleinbaum, D. G., Kupper, L. L. & Muller, K. E. (1988). Applied regression
analysis and other multivariable methods (2nd ed.). Belmont, CA:
Wad-sworth.
Landrum, R. (2009). Are there instructional differences between full-time and part-time faculty? College Teaching, 57(1), 23-26.
Langen, J. M. (2011). Evaluation of adjunct faculty in higher education institutions. Assessment & Evaluation in Higher Education, 36(2), 185-196. Lewis-Beck, M. S. (1980). Applied regression: An introduction. Beverly Hills,
CA: Sage.
Labovitz, S. (1970). The assignment of numbers to rank order categories.
American Sociological Review, 35(3), 515-524.
McKeachie, W. J. (1997). Student ratings: The validity of use. American
Psy-chologist, 52, 1218-1225.
Merrill, M. D. (2002). First principles of instruction. Education Technology
Research & Development, 50(3), 43-59.
O’Sullivan, E., & Rassel, G. R. (1989). Research methods for public
adminis-trators. White Plains, NY: Longman.
Otani, K., Kim, B. J., & Cho, J. (2012). Student evaluation of teaching (SET) in higher education: How to use SET more effectively and efficiently in Public Affairs Education. Journal of Public Affairs Education, 18(3), 531-544.
Otani, K., Kurz, R. S., & Harris, L. E. (2005). Managing primary care using patient satisfaction measures. Journal of Healthcare Management, 50(5), 311-325.
Rifkin, T. (1998). Differences between the professional attitudes of full- and
part-time faculty. Los Angeles, CA: ERIC Clearinghouse for Community
Colleges.
Sonner, B. S. (2000). A is for “adjunct”: Examining grade inflation in higher education. Journal of Education for Business, 76(1), 5-8.
Theall, M., Abrami, P. C., & Mets, L. A. (Eds.). (2001). The student ratings
debate: Are they valid? How can we best use them? New Directions for
Institutional Research No. 109. San Francisco, CA: Jossey-Bass.
Vahala, M. E., & Winston, R. B. (1994). College classroom environments: Disciplinary and institutional-type differences and effects on academic achievement in introductory courses. Innovative Higher Education, 19(2), 99-122.
Wallin, D. L. (2004). Valuing professional colleagues: adjunct faculty in community and technical colleagues. Community College Journal of
Re-search & Practice, 28(4), 373-391. doi: 10.1080/10668920490424087
Wallin, D. L. (2007). Part-time faculty and professional development: Notes from the field. New Directions for Community Colleges, 140, 67-73. Wolfer, T., & Johnson, M. M. (2003). Re-evaluating student evaluation of
teaching: The teaching evaluation form. Journal of Social Work Education,
39(1), 111-121.
Yunker, P. J., & Yunker, J. A. (2003). Are student evaluations of teaching valid? Evidence from an analytical business core course. Journal of
Education for Business, 78(6), 313-317.
Ziegler, C. A., & Reiff, M. (2006). Adjunct mentoring, a vital responsibil-ity in a changing educational climate: The Lesley Universresponsibil-ity Adjunct Mentoring Program. Mentoring & Tutoring: Partnership in Learning,
Author Note
This research was supported in part by the Collaborative Research and Community Grant from the College of Education and Public Policy at Indiana University-Purdue University Fort Wayne. This study has been approved by Institutional Review Board at Purdue University, Ref. No. 1006009404. Correspondence concerning this article should be addressed to Jeong-IL Cho, Department of Professional Studies, Indiana University - Purdue University Fort Wayne, Fort Wayne, IN 46805 ([email protected]).
Jeong-IL Cho, Ph.D., is an assistant professor in the department of professional studies
at Indiana University - Purdue University Fort Wayne. Her research focuses on creating an effective, positive learning environment: friendship and bullying interactions among students with and without disabilities, pre-service and in-service teacher training on as-sistive technology for students with disabilities, and the use of student course evaluation in higher education. Her research has been published in professional journals, including
Education and Treatment of Children, Childhood Education, International Journal of the Scholarship of Teaching and Learning, and International Education Studies.
Koichiro Otani, Ph.D., is an associate professor in the department of health policy and
management at the University of Georgia. His research interests include student course evaluation studies, a wide range of patient satisfaction, and healthcare systems. He was a founding director of the Japanese Saturday School and a faculty member at the College of Education and Public Policy, Indiana University - Purdue University Fort Wayne. He has published teaching articles in the Journal of Public Affairs Education and the
International Journal of Public Administration as well as patient satisfaction articles
in various healthcare management journals. B. Joon Kim, Ph.D., is an assistant professor in the department of public administration and public policy at Kookmin University. His current research focuses on the role of community groups in e-governance/e-democracy, the social impact of information and communication technology on citizen interaction and collaborative governance, and multilevel analysis of civic engagement. His research has appeared in The Internet and Higher Education, Journal of Public Affairs Education,
Health Marketing Quarterly, Administration & Society, Information, Commu-nication & Society, and Computer Supported Cooperative Work, among others.