Kutztown University Kutztown University
Research Commons at Kutztown University
Research Commons at Kutztown University
Computer Science and Information TechnologyFaculty Computer Science and Information Technology Department
Spring 4-4-2020
Assessing a Scholarship Program for Underrepresented Students
Assessing a Scholarship Program for Underrepresented Students
in Computer Science & Information Technology
in Computer Science & Information Technology
Dale E. ParsonKutztown University, [email protected]
Lisa Frye Ph.D.
Kutztown University of Pennsylvania, [email protected]
Patrick Earl
Kutztown University of Pennsylvania, [email protected]
Follow this and additional works at: https://research.library.kutztown.edu/cisfaculty
Part of the Computer Sciences Commons, and the Science and Mathematics Education Commons Recommended Citation
Recommended Citation
Proceedings of the 35th Annual Spring Conference of the Pennsylvania Computer and Information Science Educators (PACISE), West Chester University of PA, West Chester, PA, April 3-4, 2020.
This Conference presentation is brought to you for free and open access by the Computer Science and Information Technology Department at Research Commons at Kutztown University. It has been accepted for inclusion in Computer Science and Information Technology Faculty by an authorized administrator of Research Commons at Kutztown University. For more information, please contact [email protected],.
ASSESSING A SCHOLARSHIP PROGRAM FOR UNDERREPRESENTED
STUDENTS IN COMPUTER SCIENCE & INFORMATION TECHNOLOGY
Patrick Earl, Lisa Frye, Dale Parson Kutztown University of PA {earl,frye,parson}@kutztown.edu
ABSTRACT
There continue to be underrepresented student populations in undergraduate computer science and information technology programs in the United States and Pennsylvania. Despite some enrollment growth, female students in particular continue to be underrepresented. The authors are in the final year of managing a five-year, $614,375 program to support underrepresented student populations in our majors via scholarships and supporting activities, funded by the National Science Foundation. The program has been particularly successful in recruiting and retaining female students. We have discovered several patterns of behavior that provide early warnings for at-risk students. Lack of first-semester contribution to simple activities such as suggested blogging are about 93% accurate in predicting students who will not remain in the program due to lack of motivation and/or reliable work habits. Scholars leave the program because of low grade point averages, changes to non-STEM majors, or dropping out of college. Low incoming standardized exam scores also provide warnings. Detecting at-risk students early, and making continued scholarship support contingent on attendance at classes and tutoring sessions, are promising means for improving retention. Additional, more positive types of intervention are considered. Some of our findings may apply to our department’s overall undergraduate population.
KEY WORDS
Gender balance, scholarships, underrepresented students.
1. Introduction
In spring 2015, with our third submission, our Department of Computer Science and Information Technology at Kutztown University received a National Science Foundation (NSF) [1] grant of $614,375 to support underrepresented student populations in our majors via scholarships and supporting activities. Acceptance of scholars was based on prior academic accomplishments at high school or community college, letters of recommendation, an essay describing why the applicants were interested in our programs, standardized test scores where available, and financial need. Retention was based on maintaining a minimum grade point average and
staying in a STEM major (Science, Technology, Engineering, Mathematics) at Kutztown University, allowing for a possible major change. The university does not solicit ethnic information as part of the admission process, so we did not screen applicants regarding gender or ethnicity. We did encourage underrepresented student populations to apply in brochures and recruitment. The program began with a Principle Investigator (PI) and two co-PIs. One co-PI retired just as the NSF approved the grant proposal. One of the authors became the second co-PI that spring 2015. The PI took a medical leave of absence in fall 2016 and spring 2017, throughout the second year of the five-year program, and retired at the start of spring 2018, midway through the third year. The remaining co-PI became the PI in that semester, leaving the program with two investigators instead of the planned three. Recruitment within the department failed to attract a second co-PI. The grant also funded one graduate assistant (GA) performing interviews and other data collection activities concerning scholars, along with two undergraduate student workers as supplemental instructors, and another as a tutor. It also provided limited funding for student mentors as a support group. There were volunteer faculty and industry mentors. The GA for the 2018-2019 academic year is now a full-time, temporary instructor in the department, and a coauthor of this paper. The PI organized a significant amount of the data of this report, serving as a coauthor. The 2019-2020 academic year is the fifth and final year for awarding scholarships, and the present paper is a summary of results going into the final grant report.
2. Enrollment Demographics
2.1 U.S. computer science enrollment demographics
Table 1 is an abbreviated version of Table B8 of the 2018 annual Taulbee Survey [2], abbreviated by removing computer engineering majors and consolidating small groups not appearing among our scholarship’s scholars. The Taulbee percentages by gender for programs reporting gender in undergraduate computer science enrollment in the Taulbee Survey are 80.5% male and 19.5% female.
Table 2 gives a similarly abbreviated report by gender from 2010-11 through 2014-15 from the Association for Computing Machinery’s (ACM) 2015 in-depth study of underrepresentation [3], extracted from ACM’s Table 1. These are the years leading up to our program, and there is a slight uptick in the last two reported years, suggesting agreement with the Taulbee’s 19.5% for women in 2018.
White Black Hispanic Asian Other total 44.8% 5.1% 11.1% 23.1% 15.9% 100%
Table 1: B.S. in C.S. 2018 enrollment, 156 U.S. depts.
Year # Programs Overall female %
2010-11 59 13.42%
2011-12 61 13.08%
2012-13 64 12.81%
2013-14 57 14.52%
2014-15 67 15.95%
Table 2: Female B.S. in U.S. C.S., 2010-11 to 2014-15 2.2 Kutztown University enrollment demographics
Table 3 gives overall enrollment in computer science and information technology at Kutztown University, alongside the percentage of students reporting as females, black / African-Americans, and Hispanic in the major population. There is no consistent growth trend in enrolled women after 2012, although there is some restoration towards the 2012 number after 2015, the start of the scholarship program. There is a growth trend among African-American students over that time, with 2018 and 2019 percentages more than doubling the nationwide 5.1% of Table 1. Enrollment of students identifying as Hispanic fluctuates, and is on par with the 2018 value in Table 1. The percentage of females in Table 3 is noticeably lower than the 19.5% of the Taulbee Survey for 2018 [2] and the indicated trend of Figure 2.
Year BS CSIT Female Black Hispanic 2010-2011 170 9.41% 4.12% 8.24% 2011-2012 185 11.35% 5.41% 9.73% 2012-2013 193 13.99% 6.22% 7.77% 2013-2014 205 11.22% 4.88% 8.78% 2014-2015 216 10.65% 6.48% 11.57% 2015-2016 279 10.75% 12.19% 8.96% 2016-2017 289 11.76% 10.73% 10.38% 2017-2018 336 13.39% 11.61% 8.33% 2018-2019 337 13.65% 11.28% 7.42% 2019-2020 300 13.00% 10.67% 9.33%
Table 3: Female & ethnic enrollment at Kutztown 2.3 Our scholarship program’s demographics
Table 4 gives demographics for our STEM scholars. All but one successful scholar remained in computer science
or information technology; one switched to biology and maintained the scholarship. Table 4 is for all scholars participating for at least one semester in the program, including those who later left as reported in the next section. Six students did not participate because of lack of financial need; their gender balance was 50-50; they do not appear in Table 4. Percentages are for the number of scholars in the righthand column. With an average of 14.8 scholars per year for the five years, set against an average of 308.2 CSIT majors for the same five years, scholars comprise on average 4.8% of our majors. With 50% to 65% of that 4.8% being women, the scholarship program made a measurable increase to overall enrollment. Yearly fluctuations in departmental enrollment of black / African-American students loosely coincide with enrollment of black / African-American scholarship students. Hispanic students in the scholarship program are clearly underrepresented in comparison to the overall major in Table 3 by percentage.
Fall Female Black Hispanic Asian # scholars
2015 50.00% 62.50% 0.00% 0.00% 8 2016 64.29% 35.71% 7.14% 0.00% 14 2017 68.42% 26.32% 5.26% 0.00% 19 2018 65.00% 30.00% 5.00% 5.00% 20 2019 61.54% 46.15% 7.69% 7.69% 13
Table 4: Percentage of # scholars by category
Recruitment of incoming students to the program used several approaches. In 2015, before the first year of the scholarships, we contacted 82 regional high schools via letters, flyers, and postcards. We received no qualifying applicants from that effort. Though solicited by the investigators, the university’s admission organization made no contribution of effort to the program. Thereafter, we recruited incoming freshman from underrepresented populations during summer events starting in 2015, and during fall and spring STEM recruitment open houses. We also recruited increasing numbers of transfer students in the second and third year. We advertised the program at the three Girls in Computer Science Symposium events for high school girls in fall 2016, fall 2017, and fall 2018, discussed in Section 4.2. We do not know of any students in the program or department that enrolled as a result of
Girls in Computer Science Symposiums; some may have enrolled here or elsewhere.
The degree to which scholars in Table 4 correlate with departmental major enrollment in Table 3 is only one important dimension of this program. If a scholarship that includes only 4.8% of the majors in an average year for five years is to serve as a catalyst for stimulating diversity in enrollment of underrepresented populations, it must provide information about what worked within the program, and what did not, in order to be useful for planning. The next section takes up that analysis.
3. Retention in the program
3.1 Student data relating to the scholarship program
There were 31 scholars in the program, with 11 of these still enrolled in spring 2020, at the time of this writing. There were 9 additional students who applied and qualified academically, but did not enter the program due to lack of financial need (6 students) or the decision to enter a non-STEM major or a different institution (3). The latter 9 are not part of this retention analysis. While 31 students X 23 attributes listed below do not comprise a large dataset, there are some major correlations with retention that we believe to be significant.
For data analysis we arranged the following attributes of active scholars in the file format used by the Weka data analysis tool [4,5], along with manual analysis in Microsoft Excel[6]. We collected data from the university’s grading database, scholar interviews conducted by our graduate assistants, and from direct observation of the scholars’ on-line activities and meeting attendance. All data collection took place with the permission of the scholars, subject to standard Institutional Review Board guidelines.
gender – self reported as female / male / other.
ethnicity – self reported as White / Black / Hispanic / Asian / did-not-want-to-report.
Interviewed Y or N – scheduled and attended interview with the graduate assistant collecting data. Some scholars never scheduled or attended requested interviews.
Fit1to4 is a number in the range [1,4] expressing how well a scholar felt they fit into the department, collected in the Interview.
Confident1to4 is a number in the range [1,4] expressing how confident a scholar felt, collected in the Interview.
BlogPosts is the number of blog posts requested by the PI / co-PI that were actually made by each scholar.
BlogUseful Y or N – indicates whether the scholar felt the blogs to be useful, collected in the Interview.
UseTutors Y or N – indicates whether the scholar reported using tutors, collected in the Interview.
UseMentors Y or N – indicates whether the scholar reported using mentors, collected in the Interview. A mentor could be a fellow CSIT student, a faculty mentor, or an industry mentor.
EventsAttend – is the number of CSIT events attended by the scholar, collected in the Interview.
InternYears – indicates number of years scholar was employed in CSIT internship(s) , collected in the Interview.
CARErating – gives the scholar’s rating of the this program on a scale 1-10, collected in the Interview.
AvgAwardYear – is the average monetary award to scholar per year.
MathSAT – is the scholar's incoming math SAT score.
HSGPA – is the scholar's incoming high school grade point average in the normalized range [0.0, 4.0].
ALEKS – is the scholars score on the math placement exam.
StartGPA – is the scholar's first-semester overall grade point average.
EndGPA – is the scholar's most recent cumulative grade point average.
Gpadelta – is the EndGPA minus StartGPA.
entry – tags the student as new undergraduate, a transfer
student, or a returning student.
newstudent – is Y for an entry of new, else N.
status – is the scholar's current status: Dropped (out of college) / Current (in the program) / DropSTEM (lost scholarship due to change to a non-STEM major) /
LowGPA (dropped from program due to multi-semester low grades) / Graduated (from the program).
InSTEM – is Y if scholar Graduated OR Current, else N. Objective measures are those not collected in the Interview: gender, ethnicity, Interviewed, BlogPosts,
AvgAwardYear, MathSAT, HSGPA, ALEKS,
StartGPA, EndGPA, Gpadelta, entry, newstudent,
status, and InSTEM. The acts of scheduling and showing up for a data collection interview by a graduate assistant is an objective measure given by the value Y for attribute
Interviewed, but answers to Interview questions themselves are subjective measures.
3.2 Predicting retention from early motivation
One of the most revealing analysis results reported in this section relates motivation and willingness to follow instructions to retention. Weka gives the following OneR rule, which relates InSTEM retention (scholar is Current in or Graduated from the program) back to the attribute of our list most closely correlated with InSTEM retention. OneR is a machine learning algorithm that determines the data attribute that correlates most closely with the class
attribute being predicted, and then builds an if-then-else structure mapping value ranges for the predicting attribute to the class attribute [7]. The following rule has only one level of if-else structure.
BlogPosts:
not ? -> Y ? -> N
(27/31 instances correct)
This OneR rule predicts that scholars who made blog posts (“not ?” means the number is not unknown in the dataset) tend towards retention, while scholars that did not post blogs (“?” is unknown because there is no number of posts) tend towards non-retention.
The confusion matrix for this rule and dataset follows. Y N <-- classified as InSTEM 19 1 | Y actually still InSTEM 3 8 | N no longer InSTEM
This confusion matrix for the results shows that OneR correctly predicts that 19 students who wrote blog entries were retained in the program, and it correctly predicts that 8 students who did not make blog entries were not retained. This rule incorrectly predicts that 3 of 31 students who wrote blog entries were retained in the program (they were not), and it incorrectly predicts that 1 student who did not make blog entries was not retained. OneR’s rule gives 27/31, or 87% accuracy for this rule with this dataset. Two of the misclassified students suffered from health problems beyond the control of the grant administrators or themselves. Those problems affected their measures. Discounting their numbers, 27/29 gives 93% accuracy for this rule.
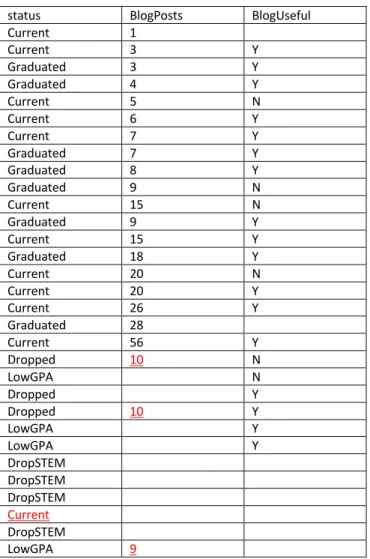
Table 5 illustrates this data relationship in more detail. Blank cells indicate students who did not create a BlogPost, or who did not schedule and attend an interview in order to answer the BlogUseful question, among others. The red, underlined Current entry near the bottom left of the table shows the one scholar who did not create a blog, and the three red, underlined BlogPost counts show the three students who created blogs but were not retained. Two left the university, one with a low GPA and one with a high GPA and medical problems, and the other left the program due to a low GPA.
Using OneR to map Interview attendance to retention in the program gives a positive but less predictive correlation, with 22/31 = 71% accuracy.
Interviewed: Y -> Y N -> N
Y N <-- classified as InSTEM 17 3 | Y actually still InSTEM 6 5 | N no longer InSTEM
Scholars in Table 5 with blank BlogUseful entries did not schedule and attend interviews. Three non-interviewees are retained, and six interviewees were not.
In addition, OneR maps answers to the interview question of whether blog posting was useful or not, exactly as it maps the Interviewed question, with 22/31 = 71% accuracy. Removing the two students with interfering medical problems brings this figure to 22/29 = 76% BlogUseful:
Y -> Y N -> Y ? -> N
Y N <-- classified as InSTEM 17 3 | Y actually still InSTEM 6 5 | N no longer InSTEM
Students who interviewed and answered either Yes or No to the question “Is the blog useful” correlate with retention, while students who did not interview (? -> N) correlate with non-retention.
status BlogPosts BlogUseful
Current 1 Current 3 Y Graduated 3 Y Graduated 4 Y Current 5 N Current 6 Y Current 7 Y Graduated 7 Y Graduated 8 Y Graduated 9 N Current 15 N Graduated 9 Y Current 15 Y Graduated 18 Y Current 20 N Current 20 Y Current 26 Y Graduated 28 Current 56 Y Dropped 10 N LowGPA N Dropped Y Dropped 10 Y LowGPA Y LowGPA Y DropSTEM DropSTEM DropSTEM Current DropSTEM LowGPA 9
The useful facts about the blog posting correlation BlogPosts:
not ? -> Y ? -> N
are the following.
a. This measure is objective, not an opinion. They either posted, or they did not.
b. In addition to being a very accurate predictor at 87 to 93%, it is a very early predictor. Scholars were instructed at the start of the program and at the start of each semester:
“Welcome back to another semester! For a few of you, your last semester!! This is a reminder that as a CARE scholarship recipient you have certain responsibilities. Some of these are maintaining a journal (blog), updating your resume annually, and working with mentors. Also, make sure you have signed the consent form. If you haven’t, or aren’t sure if you did, please stop by my office asap.”
c. Blog posting is not enforced by grades or other levers.
We conclude that assigning but not forcing blog posts to all incoming majors would provide early indications of students who will have problems with the major. Posting versus not posting appears to be a combination of motivation and willingness to follow a simple requirement with no punitive repercussions for not following. Forcing blog posts would have lost this early indicator.
Scheduling and attending interviews, while objective, has several limitations. At 71 to 76% it is less accurate than the blog post measure. Second, it is not early in the program. Interviews occurred near the end of each spring semester, while scholars received the blog instruction when they entered the program and at the start of each semester. Third, while not coerced, there is some pressure to respond to the graduate assistant / interviewer’s request to set up and attend an interview that is not present with the blog. That pressure may have lowered the predictive accuracy. Finally, as seen by the third OneR rule above, the answer to the question of whether the blog is useful has no correlation to retention. Only the fact of giving a Yes or No answer, by virtue of attending an interview, has any correlation. While blogging may not be perceived as useful to some of the retained scholars, it is useful to the project managers by providing an early warning measure for motivation and willingness to follow instructions in the absence of an absolute mandate.
3.3 Correlating retention with gender and ethnicity
Table 6 shows retention by student-reported gender and ethnicity. The “% of 31” is the percentage of all program
scholars for that row. The “%accepted” column is the “Retained” column divided by the “Accepted” column; it is the retention rate for that row’s students. Keep in mind that retention correlates strongly with posting at least once in the blog, indicating motivation and / or willingness to follow an assignment with no grade or means of enforcement, early in the program.
Accepted % of 31 Retained %accepted
Female 19 61.29% 13 68.42% Black 10 32.26% 4 40.00% Hispanic 2 6.45% 1 50.00% Asian 1 3.23% 1 100.00% White 17 54.84% 13 76.47% DNR 1 3.23% 1 100.00%
Table 6: Program acceptance, retention by category
With such small numbers, the rows with measures for Hispanic, Asian, and DNR (did not report ethnicity) students are not indicators of patterns, beyond the fact that few Hispanic and Asian students entered the program. Table 3 shows an average of 9% of the university’s CSIT majors self-describe as Hispanic, undoubtedly with many qualifying for the program. That row in Table 6 indicates a need for doing more effective recruitment among incoming Hispanic students.
The measure of 61.29% female students in the program, and 68.42% retention rate among females, indicates that the program has been effective in recruiting successful females, when compared to the numbers of Tables 2 and 3.
Retention rate among white females was 8/12 = 66.6%. Retention rate among black / African-American females
was 3/4 = 75%. Other female-ethnicity subcategories of Table 6 contained only 1 or 2 students and are too small for statistical analysis. Several additional measures help to determine why female scholars had a high success rate.
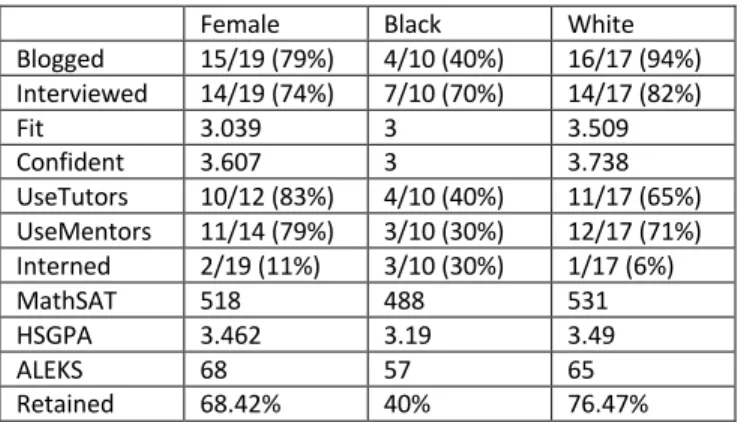
Female Black White
Blogged 15/19 (79%) 4/10 (40%) 16/17 (94%) Interviewed 14/19 (74%) 7/10 (70%) 14/17 (82%) Fit 3.039 3 3.509 Confident 3.607 3 3.738 UseTutors 10/12 (83%) 4/10 (40%) 11/17 (65%) UseMentors 11/14 (79%) 3/10 (30%) 12/17 (71%) Interned 2/19 (11%) 3/10 (30%) 1/17 (6%) MathSAT 518 488 531 HSGPA 3.462 3.19 3.49 ALEKS 68 57 65 Retained 68.42% 40% 76.47%
Table 7: Measures for 3 largest categories
Table 7 gives significant measures for the three largest demographic categories, with the bottom row being a copy of the rightmost column entries of Table 6. Blogged
and Interviewed are objective measures, with percentages based on population size for each row. Fit through Interned are subjective measures based on interview questions. Fit is a response within the range [0.0, 4.0] for the question, “On a scale of 1-4, how do you feel you fit into the Comp. Sci. population at Kutztown U?” Confident is a response within the range [0.0, 4.0] for the question, “Again, on a scale of 1-4 are you confident in your abilities to succeed in this program?” UseTutors measures number of scholars reporting using tutors and/or supplemental instructors, including those funded by the grant. UseMentors measures number of scholars reporting using student mentors funded by the grant and/or volunteer mentors from departmental faculty and industry. The math SAT, high school GPA (range [0.0, 4.0]), and ALEKS math placement exam score are objective measures received upon entry to the university. ALEKS may take place any time before the first mathematics course; some transfer students with transfer math courses do not take the ALEKS exam. All three of these measures are mean values in Table 7.
Participatory measures Blogged, Interviewed, UseTutors, and UseMentors are lowest among the Table 7 population with the lowest retention rate, black / African-American scholars. The Fit measure (how do you feel you fit in?) is about the same for female and black / African-American scholars, in a major discipline dominated by white males in recent years. In contrast, females feel about 20% more confident in their ability to succeed, on average, than do black / African-American scholars; the female population is on par with the white population in the confidence measure. Participation in internships does not contribute to retention in the Table 7 correlations, although it probably contributes to success after graduation.
Black / African-American scholars entered the program with lower Math SAT, HSGPA, and ALEKS scores than the other two categories of Table 7. Subjective confidence was lower. Participatory measures as noted are lowest among black / African-American scholars. In contrast, the subjective feeling of fitting in are not significantly lower than they are for female scholars.
40% of black / African-American scholars did complete the program, so lack of retention is not universal in this population. Again, using lack of forced blogging as a measure can catch students from any category who are prone to non-retention. Once detected, the authors hypothesize that more active encouragement of all scholars at risk to participate in using tutors and mentors is the most promising approach for helping these students, even to the limit of mandating attendance at tutoring sessions for non-blogging students and students with low GPAs. The alternative is to allow these at-risk students to continue in the program until they fail to meet its GPA requirements. The rules for this scholarship program state that students are required to maintain an overall GPA of 2.5; students who fell below that measure were given a
semester to achieve a single-semester GPA of 3.0 before being dismissed from the scholarship. We will consider an added requirement for future scholarship programs, that students detected as at-risk via the unforced blogging requirement, those with low incoming standardized exam scores, or those with GPAs near or below 2.5, must attend class and tutoring sessions as part of the continuation of inclusion in the program. All students were encouraged to use tutors, and all students with GPAs below 2.5 were encouraged again to use tutors in their warning letters before the probationary semester. Given the overall non-participatory behavioral pattern of most non-retained students, it may be necessary to replace encouragement with mandates for attendance. There may be some helpful, non-mandated interventions for at-risk students discussed in Section 5.
After removing the status attribute of the attribute list because it is redundant with the InSTEM attribute, and removing the university GPA measures because they happen after the fact of classes, we achieved the most accurately predictive model by using Weka’s Naïve Bayes statistical model, based on conditional probabilities [8]. This model gives detailed correlations of scholar measures to InSTEM retention. The Bayes table gives the following measure of accuracy.
Correctly Classified Instances 90.3226 % Kappa statistic 0.7748 Y N <-- classified as InStem 20 0 | Y actually still InSTEM 3 8 | N no longer InSTEM
Interpreting the Kappa statistic is beyond the scope of this paper, although a value of 0.7748 is good. Naïve Bayes mis-classifies only 3 students out of 31, going one better than OneR on Blogged. Moreover, perusing the Naïve Bayes correlation table is instructive and interesting, so it appears in full below. The left column of values is for InSTEM = Y (retained), and the right column for InSTEM = N (not retained). Weighted, normalized attributes do not typically sum to the number of scholars in Naïve Bayes tables. Naïve Bayes assumes a normal distribution of numeric attributes. Reported [total]s for discrete attributes and weight sums for numeric attributes relate an attribute’s correlation to the Y/N InSTEM class; reported precision is the percentage of positive predictions to total predictions conditioned by a numeric attribute. Inspecting the relative values in InSTEM’s Y column to its N column show the relative correlation of each attribute-value to InSTEM. Naïve Bayes skips over unknown attribute values such as interview questions unanswered by students.
Naive Bayes Classifier Class Attribute (InSTEM) Y N (0.64) (0.36) ======================================= gender F 14.0 7.0 M 8.0 6.0 [total] 22.0 13.0 ethnicity White 14.0 5.0 Black 5.0 7.0 Hispanic/Black 2.0 1.0 Asian 2.0 1.0 Hispanic 1.0 2.0 DNWTR 2.0 1.0 [total] 26.0 17.0 Interviewed Y 18.0 7.0 N 4.0 6.0 [total] 22.0 13.0 Fit1to4 mean 3.4412 2.9375 std. dev. 0.5927 0.6644 weight sum 17 6 precision 0.375 0.375 Confident1to4 mean 3.7353 2.6667 std. dev. 0.348 0.7454 weight sum 17 6 precision 0.5 0.5 BlogPosts mean 13.8534 10.4762 std. dev. 12.5124 1.8519 weight sum 19 3 precision 3.9286 3.9286 BlogUseful Y 14.0 5.0 N 5.0 3.0 [total] 19.0 8.0 UseTutors Y 14.0 4.0 N 3.0 3.0 [total] 17.0 7.0 UseMentors Y 14.0 4.0 N 4.0 4.0 [total] 18.0 8.0 CSIT Events Attended
mean 5.0196 2.6667 std. dev. 2.8387 1.3333 weight sum 17 6 precision 1.3333 1.3333 Internship Years mean 0.4118 0 std. dev. 0.8443 0.1667 weight sum 17 6 precision 1 1 CARErating mean 9.2813 8.4 std. dev. 0.918 0.8602 weight sum 16 5 precision 0.5 0.5 AvgAwardYear mean 7307.5324 7370.3289 std. dev. 1720.2903 1905.5156 weight sum 20 11 precision 363.5588 363.5588 MathSAT mean 556.8182 500 std. dev. 92.793 30.1511 weight sum 12 6 precision 27.2727 27.2727 HSGPA mean 26.9346 19.629 std. dev. 39.2477 32.3997 weight sum 19 10 precision 3.5052 3.5052 ALEKS mean 74.4 36.3 std. dev. 13.5233 9.9 weight sum 11 2 precision 6.6 6.6 entry new 16.0 9.0 transfer 6.0 3.0 returning 1.0 2.0 [total] 23.0 14.0 New student Y 16.0 9.0 N 6.0 4.0 [total] 22.0 13.0
Correctly Classified Instances 28 90.3226 % Kappa statistic 0.7748 === Confusion Matrix === a b <-- classified as 20 0 | a = Y = retained InSTEM 3 8 | b = N = not retained InSTEM
3.3 Retention by year
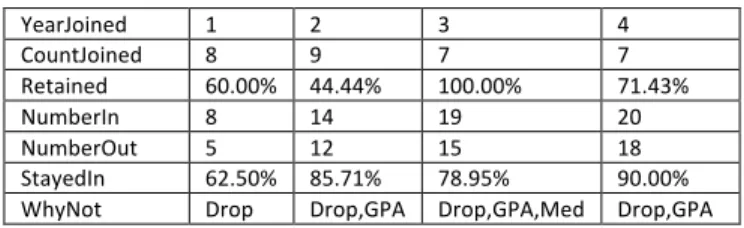
Table 8 gives two measures of retention by year for the program. The Retained percentage is the percentage of scholars who joined the program that year and who graduated or who are completing the program now. The
StayedIn percentage is the percentage of scholars who remained in the program into the next year or who graduated. There are 13 scholars in the program during its fifth and final year. The first row of percentages fluctuates by year, while the second increases almost monotonically. Reasons for leaving include Dropping STEM as a major
or dropping out of college, a consistently low GPA across two or more semesters, and one Medical problem.
YearJoined 1 2 3 4 CountJoined 8 9 7 7 Retained 60.00% 44.44% 100.00% 71.43% NumberIn 8 14 19 20 NumberOut 5 12 15 18 StayedIn 62.50% 85.71% 78.95% 90.00% WhyNot Drop Drop,GPA Drop,GPA,Med Drop,GPA
Table 8: Retention by year of the program
We conjecture that increase in year-to-next (StayedIn) retention in year 2, and increase in joined-to-completed (Retained) retention in year 3, may have been caused by increases in recruiting transfer students starting in year 2. That conjecture turned out to be incorrect. In looking for common attributes among cohorts, the two attributes most closely correlated with the year each scholar joined are incoming math SAT and ALEKS math placement tests, seen in the Naïve Bayes tables below, but these measures do not match the retention trends in Table 8 very closely.
Naive Bayes Classifier
Class (YearJoined) Attribute 1 2 3 4 (0.26) (0.29) (0.23) (0.23) ========================================= MathSAT mean 500 545.45 481.82 610.91 ALEKS (math placement exam)
mean 0 46.2 74.8 66 Correctly Classified Instances 20 64.5% Kappa statistic 0.5277
The lower-valued entries for ALEKS derive from the fact that this math placement exam was not required by the university during the first year and a half of this program; zeroes substitute for missing values. The peak math SAT year 4 corresponds with the second highest incoming retained percentage of 71.43% , and the peak ALEKS year 3 corresponds with the highest incoming retained percentage of 100%, but otherwise, yearly attribute correlations are weak. Of course, StayedIn is cumulative across advancing years, since each year accumulates the retained scholars from the previous and current years. Given the importance of these exam-based incoming indicators, the following Naïve Bayes table relates status in the program to mean exam scores, where InSTEM is the combination of graduates from the program and current successful scholars. Clearly, both exam scores are reliable early indicators for at-risk scholars. Again, 0 is an indicator of absence of ALEKS scores due to lack of mandatory testing early in the program. Also, some students do not take the ALEKS exam until they are preparing to take a mathematics course.
Naive Bayes Classifier
Class (current scholars+graduated are InSTEM) Attribute DropKU InSTEM DropSTEM LowGPA (0.11) (0.6) (0.14) (0.14) ============================================ MathSAT mean 518.18 556.82 463.64 518.18 ALEKS mean 46.2 74.4 26.4 0
4. Related departmental activities
4.1 Digital arts and creative coding courses
Beginning in the fall 2015 semester, one of the authors began offering Introduction to Creative Graphical Coding, an entry level programming course for general education credit designed to attract a diverse student population. The course was an outgrowth of this author’s previous course teaching Adobe Photoshop and Illustrator image editing to general education students, but with a focus on graphical programming. Furthermore, in spring 2016 this author began teaching a more advanced Object-Oriented Multimedia Programming course, serving both students who had completed the Introductory course, and CSIT majors who wanted to learn graphics and multimedia programming. The Introductory course soon became a required course in an interdisciplinary minor in Web Development with the Graphic Design Department, with the Advanced course serving as an elective. Kutztown University’s Art Department added a major in Applied Digital Arts (APD) in spring 2018, with the Introductory course required of all of these students, and the Advanced course required in two of the four major tracks.
Table 9 shows the gender distribution for the two courses, with semesters including APD students underlined. The Introductory course immediately achieved a gender balance almost never seen in CSIT courses. The two APD tracks that include the Advanced course also include courses involving programming computer games or embedded multimedia systems. At the current female enrollment number of 19.57%, the advanced course exceeds the U.S. and Kutztown female enrollment of Tables 2 and 3, and reaches the 19.5% reported for the Taulbee Survey [2] in Section 2.1 of this document.
course semester female students %female
Intro fall2015 1 16 6.25% Intro fall2016 10 21 47.62% Intro fall2017 12 43 27.91% Intro spring2018 26 53 49.06% Intro spring2019 26 68 38.24% Intro spring2020 40 78 51.28% Advanced spring2016 2 26 7.69% Advanced spring2017 6 40 15.00% Advanced fall2018 9 47 19.15% Advanced fall2019 9 46 19.57%
This author’s intention of attracting more female students to programming has been successful. Grades and enthusiasm show no aptitude differential by gender. A few of these women have switched to become CSIT majors. A long-term goal is to attract more of them to our master’s programs in computer science, information technology, professional master’s program, or data science certificate program, after they have had successful experience with programming as undergrads.
4.2 Girls in Computer Science Symposium
Our department chair and another female department member introduced the annual Girls in Computer Science Symposium in 2017 that includes a Cyber Café, campus tour, hands-on activities, and meeting with faculty and industry members for regional high school girls in 8th
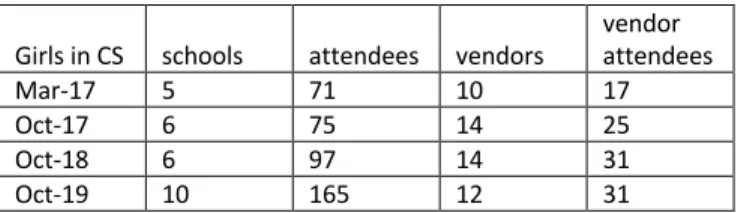
through 12th grades. Table 10 gives attendance statistics.
The goal is not one of recruitment to Kutztown University, but rather recruitment to computer science and information technology. The events are well received by the attendees and regional industry members and, as seen from Table 10, the event is growing.
Girls in CS schools attendees vendors vendor attendees
Mar-17 5 71 10 17
Oct-17 6 75 14 25
Oct-18 6 97 14 31
Oct-19 10 165 12 31
Table 10: Girls in Computer Science Symposium
The focus of the event is the Cyber Café, where regional vendors present demonstrations and discuss how computer science and information technology are utilized at their company. This provides the student attendees an opportunity to learn more about potential careers in computer science and information technology. Each year, more than 95% of the student attendees rated the Cyber Café as excellent or very good. Comments indicated the students learned about possible careers in computer science and information technology they had not considered before, which is one of the primary goals of the symposium.
5. Conclusions and Interventions
The enrollment and retention of female students in the program has been a success, with overall statistics at 61.29% accepted and 68.42% retained as shown in Table 6. Table 7 shows that female scholars had high aptitude, were motivated to participate in program activities, and were successful. Combined with larger and growing numbers of females learning multimedia programming as conveyed by Table 9, and the increased participation in the Girls in Computer Science Symposium of Table 10, the commitment of this scholarship program and related
programs at Kutztown University are supporting female CSIT students well.
Table 7 shows that recruitment of Hispanic scholars and retention of African-American scholars are below adequate levels when compared to our majors as a whole in Table 3. Recruitment has largely been “in house” in terms of soliciting students who were already enrolled in Kutztown University’s CSIT majors, and so recruiting a higher percentage of Hispanic students to similar scholarship programs should start with focusing on students already at hand.
Retention of African-American scholars, or any scholar demographic with lower than average retention rates, depends on using knowledge gained from additional retention indicators. The analyses reported in this paper suggest the following steps.
1. Initiate a program of encouraging all incoming majors to blog during the first semester without actively enforcing this encouragement. Enforcement would defeat the predictive nature of voluntary participation.
2. Require all incoming majors to take the ALEKS math placement exam at the start of the incoming semester, instead of allowing a student to wait until planning the first math course. Correlate incoming math SAT and ALEKS math placement results to success in the major for all students.
3. Use contribution to the first-semester blog and the incoming math SAT and math placement exam scores to identify at-risk students who have met minimum requirements for acceptance.
4. For at-risk scholars benefitting from a scholarship program, include mandatory attendance in classes and tutoring sessions among the terms of the scholarship. Similarly, for scholars falling below the minimum GPA required for retention in the scholarship program, make attendance in classes and tutoring sessions mandatory. These requirements may not be applicable to the majors at large, because they are two-tiered attendance requirements. Majors not at risk do not have these requirements. However, for scholarship recipients, they are justifiable in terms of continuing scholarship awards that must be earned. A GPA that falls below a minimum was already in the terms of the award of this study. Reducing risk by mandated class and tutoring attendance is preferable to loss of a scholarship in a later semester.
Voluntary attendance at interviews, tutoring sessions, mentoring sessions, and CSIT events provides additional concrete evidence of likelihood of success, at later dates than incoming exam scores and blogging, but they do supply additional measures that correlate with retention.
Step 4 above relies exclusively on mandates. “A Cross-section of Promising Interventions” on pages 28-35 of the ACM 2015 in-depth study of underrepresentation [3] suggests a variety of interventions already present in the efforts discussed above. These include peer mentors, early orientation sessions, developing curricular structures such as the multimedia programming courses to encourage exposure to the discipline so non-traditional students can “discover an interest they didn’t know they had.” The study explicitly mentions building courses around “compelling contexts” such as image processing, robotics, art, and music. “These types of experiences may resonate with students in the arts or other populations and help engage students outside STEM fields in CS.” This is exactly the approach of our collaborations with faculty and curricula in the College of Visual and Performing Arts at Kutztown University.
A checklist of additional interventions to “Meet Students’ Varied Backgrounds” [3] follows, tagged YES if our program currently employs these techniques, NO if not, and MIXED if partially employed.
• Offer summer bridge programs for students from groups with historically higher attrition rates (NO). The difficulty for our scholars is that recruitment has been largely in house from already-matriculating students. A summer bridge program preceding the first semester would require assessing at-risk students before that summer via voluntary blogs and math SAT and placement tests. It is doable.
• Provide tutoring for introductory topics (YES).
• Provide various paths through the introductory sequence (YES).
• Offer electives to address gaps (YES).
• Encourage student groups to offer workshops (YES). • Increase helpful collaboration, such as pair and team
programming, active learning, avoiding competitive course policies, and encouragement by demographic peers (MIXED).
Increasing helpful collaboration depends largely on the alignment of all faculty in the department, and unfortunately lack of such alignment leads to mixed results. This is a sad fact of priorities in academic culture to which we must apply consistent pressure for change over time. The ACM study [3] states that, “A common fallacy is that there is one silver bullet that can transform an institution into an inclusive and equitable learning environment for all students. The frustrating fact is that there is no silver bullet. Even a single bad actor within a department can thwart efforts to improve the culture and community of the department. Rather than a set of
predefined steps to follow in diversity and inclusion work, making improvements requires understanding the culture and community at an individual institution and the narratives and actors that work against an inclusive environment.” We are in full agreement that the work is incremental and ongoing, informed by analyses such as the current one.
6. Acknowledgements
The authors would like to thank the National Science Foundation for funding this project, and the Kutztown University Office of Grants and Sponsored Projects for supporting it.
References:
[1] National Science Foundation, https://www.nsf.gov/. [2] S. Zweben and B. Bizot, Computing Research Association, 2018 Taulbee survey: Undergrad enrollment continues upward; doctoral degree production declines but doctoral enrollment rises (Washington, DC, 2018),
https://cra.org/wp-content/uploads/2019/05/2018_Taulbee_Survey.pdf.
[3] Association for Computing Machinery, Retention in computer science undergraduate programs in the U.S., data challenges and promising interventions (New York,
NY, 2018),
https://www.acm.org/binaries/content/assets/education/ret ention-in-cs-undergrad-programs-in-the-us.pdf.
[4]. WEKA: The workbench for machine learning,
https://www.cs.waikato.ac.nz/ml/weka/, link tested
January 2020.
[5] Witten, Frank, Hall, and PAL, Data mining: practical machine learning tools and techniques, Fourth Edition (San Francisco, CA: Morgan Kaufmann Publishers, 2016).
[6] W. Wayne, Microsoft Excel 2019 Data Analysis and Business Modeling, 6th Edition (New York, NY: Pearson Education, 2019).
[7] R. Holte, Very simple classification rules perform well on most commonly used datasets, Machine Learning (11), 1993, 63-91.
[8] G. John, P. Langley: Estimating Continuous Distributions in Bayesian Classifiers. Eleventh Conference on Uncertainty in Artificial Intelligence, San Mateo, 1995, 338-345.
![Table 2 gives a similarly abbreviated report by gender from 2010-11 through 2014-15 from the Association for Computing Machinery’s (ACM) 2015 in-depth study of underrepresentation [3], extracted from ACM’s Table 1](https://thumb-us.123doks.com/thumbv2/123dok_us/10332462.2943406/3.918.72.443.309.423/table-similarly-abbreviated-association-computing-machinery-underrepresentation-extracted.webp)