Novel Method of Improving Quality of Service for
Voice over Internet Protocol Traffic in Mobile Ad
Hoc Networks
Abdullah Shakir
1, Raed Alsaqour
2, Maha Abdelhaq
*3, Amal Alhussan
3, Mohd Othman
1, Ahmed Mahdi
11Department of Telecommunication Engineering, Faculty of Electronic Engineering and Computer Engineering, University Technical
Malaysia Melaka (UTeM), 76100 Melaka, Malaysia.
2Department of Information Technology, College of Computing and Informatics, Saudi Electronic University, 93499 Riyadh, Saudi Arabia. 3Department of Information Technology, College of Computer and Information Sciences, Princess Nourah bint Abdulrahman University,
84428 Riyadh, Saudi Arabia.
Abstract:The application of mobile ad hoc network (MANET) with voice over Internet protocol (VoIP) has been increasing recently. However, given the lack of infrastructure, the quality of service (QoS) for VoIP traffic in MANET is reduced when a large number of calls are handled. In this type of dynamic environment, the development of a new infrastructure becomes increasingly costly and time consuming. In this paper, we propose an efficient method called QoS–nearest neighbor (QoS–NN), which improves the QoS level for VoIP in order to manage huge numbers of calls over MANET networks. We utilized the ad hoc on-demand distance vector (AODV) protocol as the underlying routing protocol to implement our proposed method. We then evaluated the proposed QoS–NN method using Network Simulator version 2 (NS2). The performance of the proposed QoS–NN method was compared with that of the lexicographic order method. The comparison was evaluated in terms of R-factor, end-to-end delay, packet loss ratio, and packet delivery ratio performance metrics. In addition, the proposed method was evaluated in terms of different network parameters, namely, VoIP CODECs, node mobility speed, number of calls, and number of nodes. The comparison results indicated that the proposed QoS–NN outperformed the lexicographic ordermethod.
Keywords: mobile ad hoc network, AODV, voice over Internet protocol, nearest neighbor algorithm, VoIP.
1.
Introduction
Voice over Internet protocol (VoIP), also called IP telephony, is a methodology and group of technologies for the delivery of voice communications and multimedia sessions over the Internet. VoIP offers the opportunity to design a global multimedia communications system that may eventually replace the existing telephony infrastructure without being encumbered by the legacy of a century-old technology [1]. VoIP uses codecs to encapsulate and compress audio into data packets, transmit these packets across an IP network, and unencapsulate and decompress these packets back into audio at the other end of the connection [2]. By eliminating the use of circuit-switched networks for voice, VoIP reduces network infrastructure costs, enables providers to deliver voice services over their broadband and private networks, and allows enterprises to operate a single voice and data network.
The QoS is widely used to describe how a network can perform in an improved manner with regard to network-generated traffic involving one or multiple technologies, such
* Corresponding Author
as Ethernet, asynchronous transfer mode (ATM), 802.1, and frame relay [3]. The QoS aims to improve the characteristics of latency, which is vital for interactive and real-time traffic, loss impact, controlled jitter, and bandwidth. QoS in MANET is a universally growing area. MANET is a collection of mobile devices that form a communication network with no pre-existing infrastructure [4]. Given the rapid expansion of multimedia technology, MANET applications need to strictly support QoS features, such as throughput, delay, energy consumption, and packet loss [5].
Numerous efforts have been made to improve the QoS of the Internet. Unfortunately, MANET still lacks QoS features due to dynamic network physiographic and bandwidth limitations [6]. Consequently, using QoS in MANET becomes problematic, as these networks usually operate with wireless links whose quality varies depending on location and is especially unstable due to the nature of mobile connections and devices. It should also be noted that further obstacles might arise from host flexibility and resource restrictions. In summary, the problem lies in administering the complicated services of QoS in a dynamic setting using a narrow range of resources [7, 8].
According to De-Rango et al. [9], the current decade has witnessed many research studies about using combinations of MANET with wireless networks and VoIP features. This trend has mainly resulted from the capability of VoIP to reduce operational costs while maintaining QoS features. However, this practice can generate a series of problems caused by the large number of calls within a network frame, the increased system faults caused by packet re-routing, the length of the routes themselves, and the proportion of traffic resource availability and active link supply. A key fact here is that MANET largely depends on the network path in terms of network performance. Nonetheless, this limitation has not discouraged researchers from trying to develop a beneficial solution for using VoIP within the Internet frame because of the great impact that such a product will have on the cost of such calls [9]. Many people use wireless applications and VoIP due to the enhanced quality and low cost of setup, but QoS is compromised (slowed) when a large number of calls are connected to VoIP.
jitter, and packet loss per ITU-T Recommendation G.107 [10]. The R-factor value helps in quickly assessing the quality of experience for VoIP calls on a network. In addition, this study deals with reducing the values of end-to-end delay and packet loss ratio, which directly affect the value of the R-factor. This study then proposes the QoS–NN method to search the path with its on-demand nature using context-aware metrics and choose the routing path with the highest R-factor. We utilize the AODV protocol as the underlying MANET routing protocol to implement the proposed method. The successful use of clustering in many MANET applications has motivated this research to adapt the K-NN algorithm to improve the AODV routing protocol [11]. The rest of this paper is organized as follows. In Section 2, we provide the background and related work. In Section 3, we present the proposed QoS–NN method. In Section 4, we describe the simulation settings. In Section 5, we explain the results and evaluations. Finally, the conclusion and possible directions for future work are in Section 6.
2.
Background and related work
2.1.Mobile ad hoc network (MANET)
Cellular and Wi-Fi technologies are infrastructure-dependent; they require connectivity with a central station or access point to enable high-speed transmission and enhanced QoS. When the MANET topology is implemented, the infrastructure will be removed, and mobility will be increased with a massively time-varying channel. However, avoiding degradations in transmission speed and QoS is an immense challenge for MANET system designers. A MANET system consists of a group of mobile nodes that provide multiscale services, including voice, data, and video, between random devices by utilizing one of the devices as the relaying node, thereby ultimately eliminating the need for an infrastructure. In recent years, research on MANETs has become very prominent due to the various angles of challenges that the technology introduces to its protocol stacks [12]. The uniqueness of MANET technology is that it connects to a particular end user irrespective of the latter’s location without relying on any type of infrastructure. MANETs operate on a distributed architecture; that is, each node organizes and delivers information on its own. However, given the random nature of networks with distributed structures, message routing can be complex. In the case of a conventional/static network, an optimum path between source and destination is determined by a cost function. However, this is not the case in MANETs. The route between source and destination in MANETs will extensively vary depending on the network structure, which could be highly mobile, large-to-small-scale (and vice versa), and extremely dynamic to complete static, all of which are determined by power sources [13].
2.2.Voice over internet protocol (VoIP)
Communications technology has significantly evolved over the last decades from conventional analog networks to circuit- and packet-switched ones. There has been recent interest in moving voice and data services from circuit-switched to packet-circuit-switched IP systems. Therefore, VoIP has emerged in the communications sector with significant business interests due to its potential of eliminating operator charges for all ranges of calls, including local-to-international calls [14].
Unlike analog voice transmission, which operates on conventional public-switched telephone network (PSTN) circuits that are optimized for voice, VoIP converts analog signals into digital streams with compression using a coder/decoder (codec). This digital binary data is then transferred to the transmission control protocol (TCP)/IP stack for packetizing and thereafter transmitted across the network [15]. At the receiver, the headers and payloads are stripped from the IP packets and sent to a compatible codec [HPG05]. As shown in Fig. 1, a conventional VoIP packet is sequentially composed of the IP header, the user datagram protocol (UDP) header, the real-time transport protocol (RTP) header, and the payload. The total capacity of a VoIP packet header is 40 bytes, with a voice payload that may range between 33 and 160 bytes according to the applied codec.
Figure 1. Structure of the VoIP packet (as in IPv4) [16] The most important element in most communication networks is the VoIP service, which requires high QoS. In MANETs, various factors impact the QoS of VoIP, namely, the mobility factor, voice codec, node capacity, call duration, number of hops, WLAN system ability, and physical distance between nodes [17].
2.3.CODECs
Table 1. VoIP CODECs [19]
Codec & Bit Rate (kbps) Codec Sample Size (Bytes)
Codec Sample Interval (ms)
Mean Opinion Score (MOS)
Voice Payload Size (Bytes)
Voice Payload Size (ms)
Payload Size (ms) Packets Per Second (PPS)
G.711 (64 kbps) 80 10 4.1 160 20 50
G.729 (8 kbps) 10 10 3.92 20 20 50
G.723.1 (6.3 kbps) 24 30 3.9 24 30 33.3
G.723.1 (5.3 kbps) 20 30 3.8 20 30 33.3
G.726 (32 kbps) 20 5 3.85 80 20 50
G.726 (24 kbps) 15 5 NA 60 20 50
G.728 (16 kbps) 10 5 3.61 60 30 33.3
G722_64k (64 kbps) 80 10 4.13 160 20 50
ilbc_mode_20 (15.2 kbps) 38 20 NA 38 20 50
ilbc_mode_30 (13.33 kbps) 50 30 NA 50 30 33.3
Among the codecs presented in Table 1, only G.711, G.729, and G.723 are widely used within actual networks. The G.711 codec is application-friendly; the voice sampling rate is 8 kHz, and every sample is encoded with 8 bits, hence resulting in a constant bit rate of 64 kbps with high QoS for voice. These samples are periodically packetized into frames every 10 ms. In the case of the G.729 codec, the coder operates at sample intervals of 10 ms, which corresponds to 10 bytes (80 bits) per sample at a bit rate of 8 kbps.
2.4.Rate factor (R-factor)
VoIP performance has been surveyed scientifically and technically. Certain factors are introduced to specifically describe call quality and categorize different tested systems into various performance classes. R-factor is a test parameter used in telephony networks, and it represents the human user’s viewpoint of the sound quality [18]. The calculations are based on the International Telecommunication Union’s Telecommunication Standardization sector (ITU-T) perceptual evaluation of speech quality (PESQ) P.862 standard [20], and the parameters of R-factor are shown in Table 2. In addition to R-factor, jitter and delay are VoIP quality factors [21].
Table 2. R-factor parameters [22]
User Satisfaction Level R-Factor
Maximum usage of G.711 93
Very satisfied users 90-100
Satisfied users 80-90
Some satisfied users 70-80
Many dissatisfied users 60-70
Mostly dissatisfied users 50-60
Not recommended Less than 50
A human’s opinion about the QoS of a service can be verified through factor. According to ITU-T P800 standard [23], R-factor, acting as a measurement metric for QoS, can be graded from 1.0 (poor) to 5.0 (best). A range of metrics is given, and an R-factor result that falls below 3.6 indicates user dissatisfaction with the service, as indicated in Table 2. An
objective method called PESQ is adopted to calculate the R-factor score and assess the perceived voice quality; this method converts the R-factor scale calculated from the following expression
𝑅 − 𝑓𝑎𝑐𝑡𝑜𝑟 = 𝑅0− 𝐼𝑠− 𝐼𝑑− 𝐼𝑒+ 𝐴 (1)
where R-factor is the resulting voice quality, which ranges from 0 to 100; 𝑅0 is the initial signal-to-noise ratio; 𝐼𝑠 is the
simultaneous impairment factor; 𝐼𝑑is the mouth-to-air delay; 𝐼𝑒 is the equipment impairment factor, which includes codecs, packet loss, and end-to-end delay; and A is the advantage factor, which can be acquired through specific applications to improve voice quality [24, 25].
2.5.Related work
To maintain high QoS for VoIP at high call rates in MANET systems, De-Rango et al. [9] proposed the graph theory method. This technique uses novel metric and utility functions to perform optimum path selection between source and destination while taking into account the QoS parameters for VoIP quality. The authors found that the proposed method improved the network management element compared with the classical method by measuring the admitted calls through QoS constraints.
The authors of [26] proposed an industrialist solution for the selection of voice codecs in different environments. The research provided basic understanding, appropriate selection, and a comparison of codecs, such as G.711, G.726, G.729A, G.723.1, GSM-FR, and iLBC, in different environments, such as WLAN/WAN (802.11g), 802.11n, WLAN_11Mb, WiMax, MANET, LAN, VPN, and UMTS. G.711 was found to be the most preferable for obtaining toll-quality voice for its high MOS value, ability to avoid delay, and lack of compression. G.723 and G.729 must be used to increase system capacity for VoIP calls because both codecs’ packets have small sizes and are sent frequently.
queuing (PQ), and weighted fair queuing (WFQ), were utilized as representative queuing techniques. VoIP was applied, and QoS was measured in terms of jitter delay, end-to-end packet delay, and wireless LAN media access delay and wireless throughput of 802.11g technology at 54 Mbps. However, in this study, AODV produced significant results in terms of voice delay jitter than the other tested protocols with all the presented queuing mechanisms. In terms of end-to-end delay, TORA recorded the best result with FIFO queuing, OLSR obtained the best result with PQ, and AODV produced good results with WFQ. Moreover, the TORA protocol showed better results in terms of wireless media delay measurement with all three types of queuing. Finally, the AODV protocol presented significant performance measures for the throughput values with the different queuing techniques.
In [28], the authors studied the performance and quality of VoIP calls through a MANET that had a number of session initiation protocol (SIP) wireless nodes registered on an SIP proxy. The measurement campaign was conducted in an indoor corridor environment at a university campus. The voice codecs used to conduct the calls were G.711, G.727, and G.723.1, which are mainly used in VoIP technologies. The calls’ quality was evaluated using four QoS metrics, namely, MOS, jitter, delay, and packet loss. According to the experimental results, voice codec G.711 provided the best performance in this indoor environment.
The researchers in [29] proposed a scheme that improves the aspects of a network layer by addressing issues from the standpoint of adaptation, claiming that effective adaptation of routing parameters can enhance VoIP quality. The most important contribution of this research is the adaptive optimized link state routing protocol-voice adaptive (OLSR-VA) algorithm, which provides an integrated environment where VoIP activity is constantly detected and routing parameters are adapted to meet application requirements. Several realistic simulations (MANET scenarios) were performed under different conditions to investigate the performance advantage achieved by this algorithm. The most important observation was that the proposed scheme performance was satisfactory in terms of perceived voice quality.
In [25], the authors investigated the effect of packet aggregation variation on VoIP QoS using an R-factor that consisted of end-to-end delay, packet loss, Id, Ie, and energy consumption of mobile nodes within an ad hoc network. This investigation revealed that an optimum amount of VoIP packets should be aggregated with the packets; this process is applicable irrespective of wireless channel conditions. This study was instrumental in guiding the balance of VoIP QoS and the energy consumption of a mobile node under the application of a packet aggregation algorithm for VoIP service.
Another study [30] proposed a VoIP over vehicular ad hoc networks (VANETs), also termed VoVAN, via simulation. The performance of different audio codecs and their effect on QoS metrics were assessed. In [29], the researchers aimed to integrate VoIP to smoothly operate in MANETs through the adaptive OLSR-VA algorithm. Data from a VANET traffic generator, which was obtained from actual road maps in urban environments, was used to achieve the integration. The simulation revealed that G.723.1 operates efficiently in urban VANET environments.
In [31], the authors investigated the possible number of hops
within a network while carrying voice traffic. In this investigation, the researchers compared the improved DSR and warning energy aware cluster (WEAC) protocols and found that the latter is suitable for networks with large numbers of hops due to its low energy consumption. Additionally, codecs G.711, G.729, and G.723.1 were investigated to select a suitable one for voice transmission with the highest possible quality and throughput in MANETs.
3.
Proposed QoS-NN method
This study employs the K-NN algorithm in combination with the AODV routing algorithm to implement the QoS-NN method. QoS-NN clustering is a professional-grade means of simplifying networks. All the nodes should perform cooperatively and efficiently in MANETs. This is achieved through the sharing of information about the quality of the node links and the partial routes. The K-NN algorithm is appropriate for problems that are flexible, dynamic, and have multiple objectives. This study proposes the use of QoS-NN, with its on-demand nature, to search and select the path with the highest R-factor using context-aware metrics. Clustering is performed using AODV routing to locate the possible paths. The K-NN algorithm assigns a number of nearest neighbor (K) values to randomly generate a mobility node (G). Therefore, the availability of the nearest clusters within the new node transmission range is checked. The newly generated node is added to the cluster that possesses the largest number of neighbors to the node. The path that has the least average end-to-end (average E2E) delay and packet loss ratio (PLR) is then discovered by the QoS-NN algorithm by the source node (S). Next, the algorithm floods the path with route request (RREQ) packets to form cluster heads (CHs). This is done by checking the ID and weight value of each neighboring node (N). The node with the lowest ID is designated as the CH, while the others are designated as member N.
Afterwards, the gateway node is chosen based on its distance to the neighboring cluster. Consequently, all the gateway nodes receive RREQ information, but the broadcasting process is not performed when the destination node (D) is found in the same cluster.
The next step is that the gateway nodes send the RREQ information forward to the next CH. Thus, through the adoption of this process, an overall traffic reduction can be seen in a MANET. The pseudo-code used for the QoS-NN algorithm is as follows.
Step 1: Randomly generate a mobility node (G) Step 2: Assign K value to the G
Step 3: Check the availability of the nearest clusters within the new node transmission range
Step 4: Add the new generated node to the cluster that possesses the highest number of neighbors to the node. Step 5: S initiate RREQ
Step 6: Check for direct neighbors to form the CH IF Weight <= min && ID = Lowest THEN select as CH for cluster ELSE select N as member node Step 7: Check for gateway
IF N nearest to neighbor cluster THEN select gateway Step 8: Check the destination node D IF D information exist in N
ELSE forward RREQ to gateway Step 9: Broadcast RREQ
Step 10: Update routing information Step 11: Send RREP
Simulations are conducted using a moderate number of mobile nodes. An OTcL script is written for the purpose of this simulation towards defining the network parameters (number of nodes, propagation model, network traffic, and the routing protocol to be employed). The simulation generates two output files, namely, a trace file (used for data processing) and a NAM file (used for visualizing the simulation). NAM is a tool used for graphical simulation display.
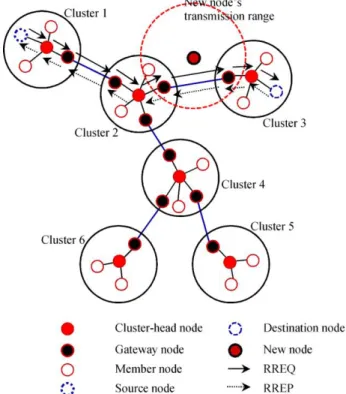
For an improved understanding of how the K-NN algorithm functions with the AODV routing protocol, the QoS-NN route selection, which is based on an R-factor value, is shown in Fig. 2.
Figure 2. QoS-NN selection route based on higher R-factor The QoS-NN algorithm starts by randomly generating a mobility node (G). The new G node chooses a cluster according to the number of neighbors inside the G
transmission range to be as member N in this cluster based on
K value. Furthermore, node G shares the ID and weight value with the cluster to check whether the cluster should become
CH or a member N. Meanwhile, the path in accordance with the higher R-factor between the source in Cluster 1 and destination Cluster 3, as illustrated in Fig. 2. When a node needs a VoIP packet transmission, the routing table should be checked to identify a path that will reach the destination node. If a predetermined route exists within the table, the data will consequently be transmitted to the respective node. Without the predetermined route, the data will instead be queued while an RREQ packet is transmitted by the source node towards the nearest nodes to initiate the creation of clusters.
The network is divided by the QoS-NN algorithm into several clusters to simplify the multi-hop network and reduce the overload on the network, as seen in Fig. 2. Initially, an RREQ packet is transmitted to the nearest nodes by a source node in Cluster 1 to initiate the process of node discovery. The neighboring position is then updated by this RREQ, and every
node’s weight value can be updated. Consequently, regular CH selection processes are executed using the lowest ID and weight value; otherwise, N is designated as member nodes in the cluster. The N nearest the next cluster is likewise checked to become a gateway so that the RREQ and RREP can be forwarded to other clusters.
The best route is the route with the highest R-factor value and the least distance. As shown in Fig. 2, the R-factor value is prioritized in the route with the continuous arrow. The route with the highest R-factor value is also selected even if it does not have the shortest distance.
4.
Simulation settings
Both qualitative and quantitative metrics are needed to measure a routing algorithm’s suitability and performance. Such metrics should not be dependent on any given routing algorithm. The properties of MANET routing algorithms represent qualitative metrics, and quantitative metrics can be used to assess any routing algorithm’s performance. The metrics used in evaluating the said performance are listed below.
4.1.Packet delivery ratio (PDR)
The PDR is the ratio of the data packets that are delivered to the destination to those that are generated by the sources. This metric illustrates the success of the algorithm in delivering packets from source to destination. A high PDR indicates completeness and correctness of the routing algorithm. PDR is calculated as follows:
𝑃𝐷𝑅 = 𝑁𝑢𝑚𝑏𝑒𝑟 𝑜𝑓 𝑃𝑎𝑐𝑘𝑒𝑡𝑠 𝑅𝑒𝑐𝑒𝑖𝑣𝑒𝑑
𝑁𝑢𝑚𝑏𝑒𝑟 𝑜𝑓 𝑃𝑎𝑐𝑘𝑒𝑡𝑠 𝑆𝑒𝑛𝑡 ∗ 100 (2)
4.2.Average E2E delay
Average E2E delay refers to the average time consumed to successfully transmit a data packet across the network from source to destination. It encompasses all possible delays, namely, buffering during the latency of route discovery, retransmission delay at the media access control (MAC), queuing at the interface queue, the propagation delay, and the transmission time delay. All these delays affect the QoS for VoIP traffic. The average E2E delay is computed with the following formula:
𝐴𝑣𝑒𝑟𝑎𝑔𝑒 𝐸2𝐸 𝑑𝑒𝑙𝑎𝑦 = ∑𝑛𝑖=1(𝑅𝑖− 𝑆𝑖)
𝑛 (3)
where n is the number of data packets that are successfully transmitted over the network, i is the unique packet identifier,
𝑅𝑖 is the time needed to receive a packet that has a unique identifier i, and 𝑆𝑖 is the time consumed in sending a packet
with a unique identifier i.
4.3.Packet Loss Ratio (PLR)
The PLR is the ratio of the difference between the number of data packets that are sent and received to the number of data packets that are generated by the sources. The PLR is calculated using the following formula:
𝑃𝐿𝑅 =
𝑆−𝑅𝑆
∗ 100
(4)where S and R are the numbers of data packets sent and received, respectively.
4.4.Rate factor (R-factor)
evaluation of voice quality, as suggested by ITU-T. The value of the R-factor ranges from 1, which stands for the lowest quality, to 4.5, which stands for the best quality [32]. R-factor is composed of R0 ,Is, Id, Ie, and A and is calculated as follows:
𝑅 − 𝑓𝑎𝑐𝑡𝑜𝑟 = 𝑅0 − 𝐼𝑠− 𝐼𝑑− 𝐼𝑒+ 𝐴 (5)
Each parameter’s definition is given in Table 3. Here, 𝑅0 and
Is are not affected by the packet aggregation algorithm. Therefore, we fix R0 _ Is to a value of 94.2 by subtracting the decrease in the voice quality value (𝐼𝑠 = 5.8) from the
maximum R-factor of 100 [31]. We likewise fix the value of
A to 0, assuming that no specific applications are used to improve voice quality. Then, Formula (5) is rewritten as follows:
𝑅 − 𝑓𝑎𝑐𝑡𝑜𝑟 = 94.2 − 𝐼𝑑− 𝐼𝑒 (6)
The utilization of R-factor in assessing the voice quality can be seen in Table 4. The simulation parameters used in the simulation experiments are shown in Table 5.
Table 3. R-factor parameters definition [32]
Parameter Definition
𝑅0 Basic signal versus noise rate (SNR)
𝐼𝑠 Impairment factor of voice quality caused by the
simultaneous voice transmission from two users transmission
𝐼𝑑 Impairment factor of voice quality due to delay
𝐼𝑒 Impairment factor of voice quality due to PL
A Advantage factor which can be acquired through specific application to improve voice quality.
Table 4. The R-factor according to Voice quality evaluation [32]
Voice Quality Evaluation R-factor
Very Good 90 < R < 100
Good 80 < R < 90
Ordinary 70 < R < 80
Low 60 < R < 70
Very Low 50 < R < 60
Table 5. Simulation parameters
Parameter Value Unit
Simulator NS-2 (Version 2.34 ) -
Number of runs 5 -
Channel type Channel/Wireless channel -
Radio-propagation model Propagation/Two ray round wave -
Network interface type Phy/WirelessPhy -
MAC Type Mac /802.11 -
Interface queue Type Queue/Drop Tail -
Link Layer Type LL -
Antenna Antenna/Omni Antenna -
Maximum packet in ifq 50 Packet
Simulation Area 1400 X 1400 𝑚2
Routing Protocols AODV [33], LEXO [9], QoS-NN -
Mobility Model Random Way Point -
Source Type CBR -
Simulation Time 50 Sec
5.
Results and evaluations
To demonstrate the effectiveness of the QoS-NN method in implementing the AODV routing protocol using the K-NN algorithm, a simulation study is conducted using different codecs, numbers of nodes, node speeds, and numbers of calls (connections). The codecs used are G711, G723.1, G726, G728, and G729. Each codec has a different packet size and bit rate, and the numbers of nodes are 20, 30, 40, 50, and 60. The node speeds are 2, 4, 6, 8, and 10 m/s, and the numbers of calls are 1, 2, 3, 4, and 5 calls. The simulation study evaluates the R-factor, average E2E delay, PLR, and PDR performance metrics.
5.1.Impact of VoIP codec
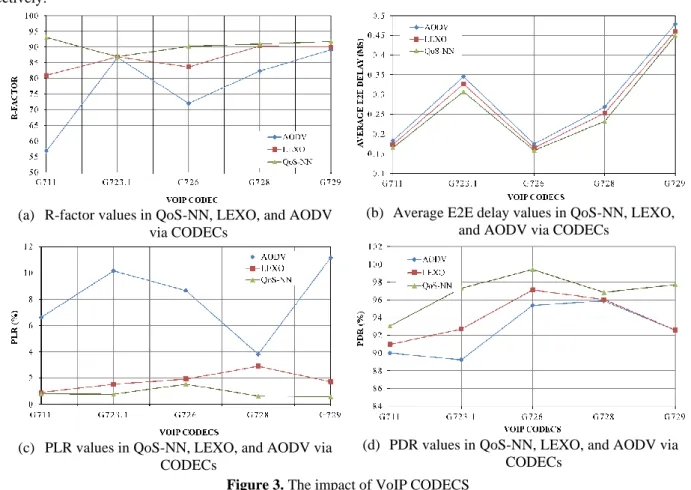
The effects of the VoIP codecs on the R-factor, average E2E delay, PDR, and PLR are shown in Fig. 3.
Fig. 3(a) shows the R-factor values for each VoIP codec for the QoS-NN, LEXO, and AODV algorithms. There is a different R-factor value for the various VoIP codecs. When the VoIP codecs are G711, G723.1, G726, G728, and G729, the R-factor values for QoS-NN are 93.035, 86.8926, 90.2416, 90.9677, and 91.7505, respectively. For LEXO, the values are 80.9605, 86.8733, 83.6353, 90.3467, and 89.9898, respectively. For AODV, the values are 56.817, 86.6544, 72.025, 82.3315, and 89.1211, respectively.
the packet size and bit rate for each codec. When the VoIP codecs are G711, G723.1, G726, G728, and G729, the average E2E delays for QoS-NN are 0.1651, 0.1651, 0.15836, 0.23233, and 0.44951, respectively. For LEXO, the values are 0.17347, 0.32674, 0.16474, 0.25328, and 0.46018, respectively. For AODV, the values are 0.18303, 0.34558, 0.17501, 0.26853, and 0.47893, respectively. QoS-NN has a lower average E2E delay than LEXO and AODV.
Fig. 3(c) shows the variations of PLR for the QoS-NN, LEXO, and AODV algorithms. When the VoIP codecs change, the value of PLR changes based on the packet size and bit rate for each codec. When the VoIP codecs are G711, G723.1, G726, G728, and G729, the PLR values for QoS-NN are 93.065, 97.3077, 99.4231, 96.8413, and 97.7143, respectively. For LEXO, the values are 90.9677, 92.6923, 97.1154, 96.0476, and 92.5714, respectively. For AODV, the values are 90, 89.2308, 95.3846, 95.873, and 92.5714, respectively.
The various values of PDR for QoS-NN, LEXO, and AODV are shown in Fig. 3(d). With changes in the VoIP codec, the value of PDR is altered based on the packet size and bit rate for each codec. With use of VoIP codecs G711, G723.1, G726, G728, and G729, the PDR values for QoS-NN are 93.065, 97.3077, 99.4231, 96.8413, and 97.7143, respectively. The values for LEXO are 90.9677, 92.6923, 97.1154, 96.0476, and 92.5714, respectively. For AODV, the values are 90, 89.2308, 95.3846, 95.873, and 92.5714, respectively.
In conclusion, the QoS-NN algorithm has a high R-factor and PDR; it also has lower E2E delay and PLR in comparison with LEXO and AODV. This is because the CH always keeps the information about its member nodes and keeps track of its path with them. Consequently, most of the packets are successfully delivered with a low average E2E delay and PLR, and the values of R-factor and PDR remain high.
(a) R-factor values in QoS-NN, LEXO, and AODV via CODECs
(b) Average E2E delay values in QoS-NN, LEXO, and AODV via CODECs
(c) PLR values in QoS-NN, LEXO, and AODV via CODECs
(d) PDR values in QoS-NN, LEXO, and AODV via CODECs
Figure 3. The impact of VoIP CODECS 5.2.Impact of number of nodes
The effects of the number of nodes on R-factor, average E2E delay, PDR, and PLR are shown in Fig. 4.
Fig. 4(a) shows that R-factor performance varies with the number of nodes for the QoS-NN, LEXO, and AODV algorithm. The algorithms have different R-factor values with an increase in the number of nodes in the network. When the numbers of nodes are 20, 30, 40, 50, and 60, the R-values decrease from 88.89262 to 85.23968 for QoS-NN, from 88.65292 to 78.78358 for LEXO, and from 75.02077 to 31.20641 for AODV. Nevertheless, the QoS-NN algorithm has a higher voice quality than the two other algorithms. It maintains R-factor values in the range of 80 < R < 90, which indicates “good” voice quality. However, for the LEXO algorithm, the voice quality falls to “ordinary” with an increase in the number of nodes to 60, and that for the AODV
algorithm is reduced to “very low” with an increased number of nodes.
The various values of PDR for QoS-NN, LEXO, and AODV are shown in Fig. 4(d). These algorithms produce different values of PDR with an increase in the number of nodes in the network. When the numbers of nodes are 20, 30, 40, 50, and 60, the PDR values decrease from 96.9677 to 93.5484 for QoS-NN, from 96.4516 to 84.1936 for LEXO, and from 87.4194 to 34.1936 for AODV. However, QoS-NN yields a better result in terms of PDR compared with LEXO and AODV.
Essentially, QoS-NN keeps a record of the information of all the member nodes in a CH routing table. The CH node also acts as a CH if it has the lowest ID and records new member
information in the routing table. On the contrary, a new member node that has the lowest ID is elected by the member nodes as the CH for the cluster. This scenario reduces the value of average E2E delay. Therefore, the CH keeps track of its path with the member nodes, and the PDR remains high, as most of the packets are successfully delivered. Furthermore, QoS-NN has a lower PLR than LEXO and AODV. The reason for such difference is the high delivery rate of packets; as such, its R-factor is better than the others. Accordingly, we can conclude that the QoS-NN algorithm for VoIP is better than the other algorithms.
(a) R-factor values in QoS-NN, LEXO, and AODV via No. of nodes
(b) Average E2E delay values in QoS-NN, LEXO, and AODV via No. of nodes
(c) PLR values in QoS-NN, LEXO, and AODV via No. of nodes
(d) PDR values in QoS-NN, LEXO, and AODV via No. of nodes
Figure 4. The impact of number of nodes 5.3.Impact of node speed
The effects of the node speed on R-factor, average E2E delay, PDR, and PLR are shown in Fig. 5.
Fig. 5(a) shows the evaluation of voice quality by calculation of the value of R-factor for QoS-NN, LEXO, and AODV. The three cases have different R-factor values with an increase in the node speed in the network. When the node speeds are 2, 4, 6, 8, and 10 m/s, the R-factor values decrease from 84.026535 to 70.448885 for QoS-NN, from 79.648124 to 66.63823 for LEXO, and from 57.22812 to 39.91284 for AODV. QoS-NN has a higher voice quality in comparison with LEXO and AODV. The voice quality evaluation is classified as “good” for QoS-NN for the speeds of 2, 4, and 6 m/s, for which the value of R-factor is in the range of 80< R< 90. Thereafter, the value deteriorates to the range of 70 < R< 80, where the voice quality evaluation is “ordinary” for the speeds 8 and 10 m/s. For LEXO, the voice quality evaluation is “ordinary” when the node speed is increased until 10 m/s, where the evaluation becomes “low,” as reflected by its R-factor falling in the range of 60 < R< 70. As for AODV, the evaluation is “very low” when the node speed is increased. These results clearly demonstrate that QoS-NN has a better voice quality than the other algorithms in terms of R-factor.
Fig. 5(b) shows the variations of the average E2E delay for QoS-NN, LEXO, and AODV. When the node speed increases, the average delay increases. When the node speeds are 2, 4, 8, and 10 m/s, the average E2E delays increase from 0.14365 to 0.17347 for QoS-NN, from 0.151876 to 0.1830314 for LEXO, and from 0.171883 to 0.287155 for AODV. Nevertheless, QoS-NN has a lower average E2E delay than do LEXO and AODV.
Fig. 5(c) shows the variations of PLR for QoS-NN, LEXO, and AODV. When the node speed is increased, the PLR increases accordingly. The PLR values of QoS-NN, LEXO, and AODV increase from 0.646 to 3.708, from 0.906 to 10.162, and from 6.612 to 24.034, respectively. Accordingly, in this case, QoS-NN also has a lower PLR than both LEXO and AODV.
These results demonstrate that QoS-NN maintains better voice quality with an increase in node speed. This is because the CH always stores the information of the member nodes. Hence, QoS-NN has the lowest average E2E delay and PLR, and the R-factor values of QoS-NN are better than those of
LEXO and AODV. In summary, the CH keeps track of its path with the member nodes, most of the packets are successfully delivered, and the PDR remains high.
(a) R-factor values in QoS-NN, LEXO, and AODV via Node speeds
(b) Average E2E delay values in QoS-NN, LEXO, and AODV via Node speeds
(c) PLR values in QoS-NN, LEXO, and AODV via No. of nodes
(d) PDR values in QoS-NN, LEXO, and AODV via Node speeds
Figure 5. The impact of node speeds 5.4.The impact of the number of calls
The effects of the number of calls on R-factor, average E2E delay, PDR and PLR is shown in Fig 6.
Fig 6(a) shows the evaluation of voice quality through the calculation of the value of R-factor for QoS-NN, LEXO and AODV. The R-factor value is different for each case with an increase in the number of calls in the network. When the number of calls is 1, 2, 3, 4 and 5 calls, the R-values for QoS-NN decreases from 93.1989 to 77.8283; for LEXO decreases from 93.120544 to 70.752; and for AODV decreases from 87.405 to 20.038. Nonetheless, QoS-NN continues to have a higher voice quality as compared to LEXO and AODV. The voice quality evaluation was “very good” for QoS-NN for the number of calls of 1 and 2. This is because the value of R-factor is in the range of 90<R<100, which thereafter deteriorated to 80<R<90 with voice quality evaluation of “good” for the number of calls of 3 and 4. In addition, in the case where the number of calls is 5, the voice quality evaluation deteriorated to “ordinary”. As for LEXO, the voice quality evaluation is “very good” in the case where the number of calls is 1, which then become “good” with an increase in the number of calls. However, in the case where the number of calls is 4 and 5, the voice quality evaluation become “ordinary” with the value of R-factor in the range of 70< R< 80. Lastly, the evaluation of AODV is “good” in the case of number of calls is 1. But with the increase in the number of calls, the voice quality evaluation begins to degrade until the protocol is not suitable for VoIP connection. Accordingly, the results clearly reveal that QoS-NN has a
better voice quality in terms of R-factor as compared with the others.
Fig 6(b) shows the average E2E delay for QoS-NN, LEXO and AODV. These algorithms have different E2E delays with an increase in the number of calls in the network. When the number of calls is 1, 2, 3, 4 and 5 calls, the E2E delay for QoS-NN increases from 0.19512 to 7.49971; for LEXO increases from 0.173465 to 10.86629; and for AODV increases from 0.18303 to 71.2333. Nevertheless, QoS-NN has a lower average E2E delay in comparison to both LEXO and AODV, which is the effect on the voice quality.
Fig 6(c) shows the variations of PLR for QoS-NN, LEXO and AODV. When increasing the number of calls, there is a different PLR value with an increase in the number of calls in the network. When number of calls are 1, 2, 3, 4 and 5 calls, the PLR for QoS-NN increases from 0.484 to 56.258; for LEXO increases from 0.97 to 59.838; and for AODV increases from 6.612 to 90.384. Likewise, QoS-NN also has a lower PLR when compared to both LEXO and AODV. Finally, Fig 6(d) shows the variations of PDR of VoIP packets for QoS-NN, LEXO and AODV. These routing protocols produce different PDR values with an increase in the number of calls in the network. When number of calls are 1, 2, 3, 4 and 5 calls, the PDR for QoS-NN decreases from 93.0645 to 52.5807; for LEXO decreases from 90 to 50.80645; and for AODV decreases from 80.9677 to 12.2581. The QoS-NN has a better voice quality in terms of PDR as compared to LEXO and AODV.
delay and PLR and hence, its R-factor values are better in comparison to LEXO and AODV. Therefore, the CH keeps track of its path with the member nodes and thus, its PDR
remains high as most of the packets are successfully delivered.
(a) R-factor values in QoS-NN, LEXO, and AODV via No. of calls
(b) Average E2E delay values in QoS-NN, LEXO, and AODV via No. of calls
(c) PLR values in QoS-NN, LEXO, and AODV via No. of calls
(d) PDR values in QoS-NN, LEXO, and AODV via No. of calls
Figure 6. The impact of number of calls
6.
Conclusion and future work
In this study, the performance of the proposed QoS-NN algorithm was simulated using NS2, represented by varying the VoIP codecs, node speeds, numbers of nodes, and numbers of calls. Four performance metrics were measured, namely, R-factor, average E2E delay, PLR, and PDR. The four scenarios hypothetically occurred on a flat plot with an area of 1400 x 1400 m2.
An advantage of QoS-NN is its simplicity; it classifies a MANET to several clusters. Simulation results showed that the proposed QoS-NN is superior in terms of QoS for VoIP traffic compared with LEXO and basic AODV. This study achieved the best QoS for VoIP in a realistic environment where routing algorithms, mobility, and radio propagation models were considered.
Many issues can be considered in the adoption of the QoS-NN algorithm, among which are security attacks. Such attacks could harm the network in many ways, such as by breaking routes, which would reduce the QoS and increase the routing overhead. MANETs are particularly prone to malicious behavior.
7.
Acknowledgment
This research was funded by Deanship of Scientific Research at Princess Nourah bint Abdulrahman University, Saudi Arabia. Grant No# 248/ص/39.
Reference
[1] H. Schulzrinne and J. Rosenberg, "Internet telephony: Architecture and protocols–an IETF perspective," Computer Networks, Vol. 31, pp. 237-255, 1999. [2] T. Wulandari, D. Perdana, and R. M. Negara, "Node
Density Performance Analysis on IEEE 802.11 ah Standard for VoIP Service," International Journal of Communication Networks and Information Security, Vol. 10, pp. 79-84, 2018.
[3] T. Uhl, "QoS by VoIP Under Use Different Audio Codecs," in 2018 Joint Conference-Acoustics, Ustka, Poland, 2018, pp. 1-4.
[4] K. Singh and A. K. Verma, "Flying adhoc networks concept and challenges," in Advanced Methodologies and Technologies in Network Architecture, Mobile Computing, and Data Analytics, 1st ed: IGI Global, 2019, pp. 903-911.
[5] S. H. H. Nazhad, M. Shojafar, S. Shamshirband, and M. Conti, "An efficient routing protocol for the QoS support of large‐scale MANETs," International Journal of Communication Systems, Vol. 31, No. 1, p. e3384, 2018.
[6] M. Rath and B. K. Pattanayak, "Monitoring of QoS in MANET Based Real Time Applications," in International Conference on Information and Communication Technology for Intelligent Systems (ICTIS 2017), Springer, Cham, 2017, pp. 579-586. [7] K. Wu and J. Harms, "QoS support in mobile ad hoc
[8] N. Bouchama, D. Aïssani, N. Djellab, and N. Nouali-Taboudjemat, "A critical review of quality of service models in mobile ad hoc networks," International Journal of Ad Hoc and Ubiquitous Computing, Vol. 31, No. 1, pp. 49-70, 2019.
[9] F. De Rango, P. Fazio, F. Scarcello, and F. Conte, "A new distributed application and network layer protocol for voip in mobile ad hoc networks," IEEE Transactions on Mobile Computing, Vol. 13, No. 10, pp. 2185-2198, 2014.
[10] J. Holub, M. Wallbaum, N. Smith, and H. Avetisyan, "Analysis of the Dependency of Call Duration on the Quality of VoIP Calls," IEEE Wireless Communications Letters, Vol. 7, No.4, pp. 638-641, 2018.
[11] O. Kramer, Dimensionality reduction with unsupervised nearest neighbors: Springer, 2013.
[12] S. K. Sarkar, T. G. Basavaraju, and C. Puttamadappa, "Ad hoc mobile wireless networks: principles, protocols, and applications," 2nd ed: CRC Press, 2016. [13] A. O. Bang and P. L. Ramteke, "MANET: History,
challenges and applications," International Journal of Application or Innovation in Engineering & Management (IJAIEM), Vol. 2, No. 9, pp. 249-251, 2013.
[14] H. M. Chong and H. S. Matthews, "Comparative analysis of traditional telephone and voice-over-Internet protocol (VoIP) systems," in IEEE International Symposium on Electronics and the Environment, 2004. Conference Record. 2004, AZ, USA, 2004, pp. 106-111. [15] F. Ohrtman, Voice Over 802.11: Artech House, 2004. [16] E. Said, B. Mohammed, and B. Anouar, "VoIP over
MANET (VoMAN): QoS & Performance Analysis of Routing Protocols for Different Audio Codecs," International Journal of Computer Applications, Vol. 36, pp. 0975-8887, 2011.
[17] M. Alshamrani, H. Cruickshank, and Z. Sun, "SIP Signaling and QoS for ROHC Based Next Generation MANETs Reactive Routing Protocols," in 2013 8th EUROSIM Congress on Modelling and Simulation, 2013, Cardiff, UK, pp. 591-599.
[18] M. Mohamed, F. Zaki, and A. Elfeki, "Performance Analysis of VoIP Codecs over WiMAX Networks," IJCSI International Journal of Computer Science Issues, Vol. 9, No.3, pp. 253-259, 2012.
[19] CISCO. (2017, 13/6/2019). Introduction to VOIP
Codecs. Available:
https://www.cisco.com/c/en/us/td/docs/ios-xml/ios/voice/.../cube-codec-basic.pdf
[20] A. Korobeynikov, M. Boyarshinov, A. Nistyuk, and V. Emelianov, "Using the Standard P. 862 to Compare the Quality of Low-Bitrate Vocoders," Intellekt. Sist. Proizv., Vol. 16, No. 4, pp. 109-113, 2019.
[21] H. Xiao, W. K. Seah, A. Lo, and K. C. Chua, "A flexible quality of service model for mobile ad-hoc networks," in VTC2000-Spring. 2000 IEEE 51st Vehicular Technology Conference Proceedings (Cat. No. 00CH37026), Tokyo, Japan, 2000, pp. 445-449. [22] S. Ashouri, H. Khosraviroshkhari, S. A. H. Seno, and
M. H. Y. Moghaddam, "VoIP performance comparison in wireless networks with different encryption methods," in 2014 4th International Conference on Computer and Knowledge Engineering (ICCKE), Mashhad, Iran, 2014, pp. 753-757.
[23] I. Rec, "P. 800: Methods for subjective determination of transmission quality," International Telecommunication Union, Geneva, p. 22, 1996.
[24] S. Sengupta, M. Chatterjee, S. Ganguly, and R. Izmailov, "Improving R-score of VoIP streams over WiMAX," in 2006 IEEE International Conference on Communications, Istanbul, Turkey, 2006, pp. 866-871. [25] J.-Y. Jung, H.-S. Kang, and J.-R. Lee, "Performance
evaluation of packet aggregation scheme for VoIP service in wireless multi-hop network," Ad Hoc Networks, Vol. 11, No. 3, pp. 1037-1045, 2013. [26] N. Gupta, N. Kumar, and H. Kumar, "Comparative
Analysis of Voice Codecs Over Different Environment Scenarios in VoIP," in 2018 Second International Conference on Intelligent Computing and Control Systems (ICICCS), Madurai, India, 2018, pp. 540-544. [27] A. M. Sllame, "Evaluating the Impact of Routing on
QoS of VoIP over MANET Wireless Networks," Open Access Library Journal, Vol. 4, No. 2, p. 1, 2017. [28] L. A. Haibeh, N. Hakem, and O. A. Safia, "Performance
evaluation of VoIP calls over MANET for different voice codecs," in 2017 IEEE 7th Annual Computing and Communication Workshop and Conference (CCWC), NV, USA, 2017, pp. 1-6.
[29] E. b. Said, E. b. Mohamed, and B. Driss, "A new QoS management scheme for VoIP application over wireless ad hoc networks," Journal of Computer Networks and Communications, Vol. 2014, pp. 10, Article ID. 945695, 2014.
[30] S. El Brak, M. Bouhorma, A. A. Boudhir, M. El Brak, and M. Essaaidi, "Voice over VANETs (VoVAN): QoS performance analysis of different voice CODECs in urban VANET scenarios," in 2012 International Conference on Multimedia Computing and Systems, Tangier, Morocco, 2012, pp. 360-365.
[31] M. G. Kaosar and T. R. Sheltami, "Voice transmission over ad hoc network adapting optimum approaches to maximize the performance," Computer Communications, Vol. 32, No. 4, pp. 634-639, 2009. [32] L. Raja and S. S. Baboo, "An overview of MANET:
Applications, attacks and challenges," Int. J. of Comp. Sci. Mobile Comput.(IJCSMC), Vol. 3, No. 1, pp. 408-417, 2014.
![Figure 1. Structure of the VoIP packet (as in IPv4) [16]](https://thumb-us.123doks.com/thumbv2/123dok_us/8121845.2154134/2.892.491.827.549.683/figure-structure-voip-packet-ipv.webp)
![Table 2. R-factor parameters [22]](https://thumb-us.123doks.com/thumbv2/123dok_us/8121845.2154134/3.892.90.442.856.1062/table-r-factor-parameters.webp)
![Table 4. The R-factor according to Voice quality evaluation [32]](https://thumb-us.123doks.com/thumbv2/123dok_us/8121845.2154134/6.892.78.434.450.656/table-r-factor-according-voice-quality-evaluation.webp)