High Performance Wireless Networking and
Weather
Jose Otero, Pavana Yalamanchili, Hans-Werner Braun Abstract— High performance wireless networking is
effected by a number of internal and external vari-ables. External weather phenomena, such as rain, fog, wind, and temperature can effect the performance of network equipment, as well as node to node commu-nication efficiency. Through the collection of Manage-ment Information Base (MIB) data and meteorological data it is possible to begin an investigation on poten-tial correlations.
Keywords— weather, wireless networks, measure-ment, HPWREN
I. INTRODUCTION
The High Performance Wireless Research and Ed-ucation Network (HPWREN) [1] team is creating, demonstrating, and evaluating, a non-commercial, prototype, high performance, wide area, wireless net-work in San Diego County. The NSF-funded netnet-work includes backbone nodes on the University of Cali-fornia, San Diego (UCSD) campus and a number of ‘hard to reach’ areas in San Diego County (an area located in Southern California). The HPWREN is in-tended to serve multiple purposes. In addition to pro-viding high speed Internet access to field researchers from several disciplines and educational opportuni-ties to rural Indian reservations and schools, it serves as a test-bed for network measurement and analysis. We have begun investigating the effects of external variables, such as weather phenomena and atmo-spheric conditions on wireless network performance. A variety of measurement activities occur on a daily basis within the HPWREN, reflecting factors such as network throughput, error rates, wireless radio fre-quency interference, and general transceiver status information. Most of this data is recorded via Sim-ple Network Management Protocol (SNMP) [2] oper-Jose Otero is with the NLANR Measurement and Network Analy-sis group and the HPWREN, University of California, San Diego, San Diego Supercomputer Center, 9500 Gilman Dr., La Jolla, CA 92093-0505. E-mail: [email protected]
Pavana Yalamanchili is with the NLANR Measurement and Network Analysis group and the HPWREN, E-mail: [email protected]
Hans-Werner Braun is the principal investigator of HPWREN and NLANR and Measurement and Network Analysis group.
Fig. 1. Weather station at Mt. Woodson
ations.
This paper will show the preliminary results of our study on the effects of weather on the HPWREN.
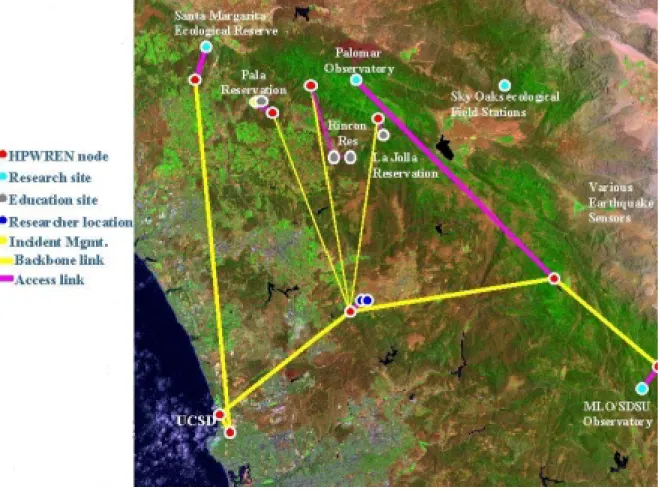
II. WIRELESS TOPOLOGY ANDINSTRUMENTATION The HPWREN provides an unique test-bed. Per-haps one of the most fascinating aspects of this net-work is that it spans a wide topography and traverses a number of biomes. The backbone link spans from the coast of San Diego, through the mountains of eastern San Diego County, and eventually to the deserts of Southern California (Figure 2). In itself, this provides a number of logistical challenges from a deployment stand point, as well as presenting an in-teresting milieu in terms of meteorological phenom-ena across the link path. For example, it can be snowing in the mountains, raining in San Diego, and quite warm in the desert. This sort of hypothetical situation leads to many inquiries about network ad-versities and benefits. With our research, we hope to be to able to answer such questions, as well as develop parameters for measurement and analysis.
The current HPWREN infrastructure utilizes two types of radios. The high speed backbone (45 Mbps) uses Western Multiplex Tsunami radios [3]; the back-bone to user links (11 Mbps) use Lucent
Technolo-Fig. 2. Topology of the High Performance Wireless Research and Education Network (HPWREN)
gies [4] equipment. The Western Multiplex Tsunami radios utilize the unlicensed frequency spectrum of 5.75/5.8 GHz and proprietary protocols, while the Lucent radios utilize the unlicensed frequency spec-trum of 2.4 GHz Direct Sequence Spread Specspec-trum (DSSS) and the IEEE 802.11b protocol.
At select sites, the HPWREN infrastructure also utilizes solar arrays to power the various network de-vices and radio equipment.
In order to fully understand the implications of weather conditions on network performance, it is nec-essary to have a standard procedure for weather col-lection across the HPWREN. Techniques for weather collection are as varied as the weather itself. For our network we have chosen the most effective and simple instrumentation for preliminary research pur-poses.
To measure and record weather conditions, we have chosen an inexpensive weather station with RS232 (serial) output. The Oregon Scientific WM-918 instrument [5] measures a variety of weather phenomena, including rainfall, humidity (indoor and outdoor), temperature (indoor and outdoor), wind
speed, wind direction, and barometric pressure. Bi-nary data is kept on a central server and fed from the HPWREN backbone sites for user retrieval [6]. This data is then plotted in reference to the wireless MIB data [7].
Construction design of the weather stations varies from location to location and is largely dependent on the surrounding environment and man-made struc-ture(s). Preliminary weather station construction called for the weather collection apparatus to be mounted on large sections of plywood or plastic. This type of construction created a number of problems. The most crucial being the lack of shielding from ra-dio frequency (RF) radiation and the relatively large foot print that the weather instrumentation requires. Current construction design has a more streamlined approach in which all of the collection apparatus are mounted in a linear fashion on top of each other through the use of a 2 inch rigid metal pipe (Figure 1). The modified pipe allows for easy mounting of the weather station, as well as supplying ample shield-ing from stray RF. For a list of parts and construction details, see the HPWREN weather station Web page
Fig. 3. Outdoor temperature at UCSD/SDSC
Fig. 4. RSL and wind speed at UCSD/SDSC
[8].
There are currently two such weather stations de-ployed, with a third planned for installation. The cur-rent locations are atop the roof of the San Diego Supercomputer Center (SDSC), a coastal site; the second is atop Mt. Woodson in Ramona, an inland mountain site. These stations are 17.75 miles apart. A third station is planned for the Mt. Laguna Obser-vatory (MLO) site. It should be noted that weather conditions at any one site can vary drastically from the other sites.
With two weather stations deployed and data be-ing collected, we have begun to look for correlations between network metrics and weather phenomena.
III. DATACOLLECTION
The HPWREN currently utilizes two types of data collection. Both radio data and weather data are col-lected at five minute intervals. Weather data is read off of the serial port in binary form and stored on a central collector located at SDSC. Several tools have been written to convert the binary data to graphical and ASCII forms.
A variety of graphs and tables can be found on the HPWREN performance analysis Web pages [7].
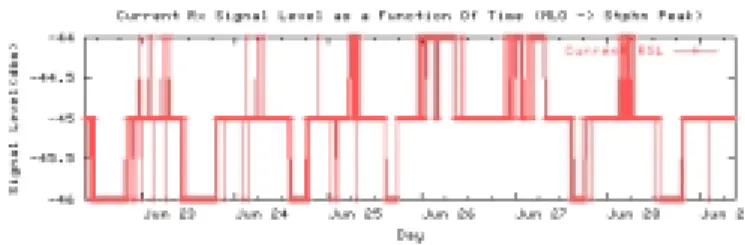
Fig. 5. RSL at Mt. Laguna Observatory (MLO)
Fig. 6. RSL and rainfall at Mt. Woodson
Data tables include current weather conditions by site as well as weather almanac data. There are graphs for temperature, wind chill, humidity, rainfall, dew point, barometric pressure, wind speed, and wind di-rection. This data is available separately or in con-junction with the radio data. Figure 3 shows the out-door temperature at UCSD/SDSC during a week in June 2001. Figure 4 shows the radio received signal level (RSL) data at UCSD/SDSC in conjunction with the wind speed data.
Unlike the weather stations which use RS232 and the existing Transmission Control Protocol/Internet Protocol (TCP/IP) [2] infrastructure, radio data is col-lected via SNMP calls and the User Datagram Proto-col (UDP) [2]. The raw MIB data is then plotted with a number of perl scripts built into the HPWREN Web pages.
The MIB data reflects various parameters such as signal and noise values, signal to noise ratios, and transmission data for the Lucent radios, as well as radio status, RSLs, error intervals, and bit error rates for the Tsunami radios. Figure 5 illustrates RSL at MLO for the MLO to Stephenson Peak link.
IV. WEATHER CONDITIONS AND OBSERVATIONS We have found that different weather phenomena effect the wireless links in a variety of ways. One of the strongest correlations that we have seen is that of precipitation and network performance degradation.
A. Rain and Snowfall
Previous studies have shown that absorption, scat-tering, and refraction of microelectromagnetic waves by atmospheric gases and precipitation is an impor-tant limiting factor in transmission distances in wire-less communications. In fact, rain, fog, and clouds become a significant source of attenuation when wireless networks operate using the microwave spec-trum [9].
This limiting effect has been noticed on a number of occasions in the HPWREN. For example, we
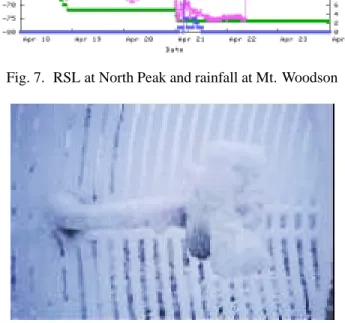
ob-Fig. 7. RSL at North Peak and rainfall at Mt. Woodson
Fig. 8. Snow and ice on a grid antenna at the La Jolla relay
served a significant drop in the RSL on both sides of the UCSD to Mt. Woodson link during a particularly heavy rain storm in February 2001. In Figure 6, there is a drop in RSL of approximately 4 dBm between February 10th and February 17th.
A similar observation was made during a snow storm in April 2001, which resulted in an even larger RSL drop. The signal path between North Peak and Stephenson Peak (approximately 13 miles) experi-enced a RSL drop of about 14 dBm (Figure 7). It should be noted that Figure 7 does not exhibit a strong correlation between precipitation and network degradation. This is because weather conditions re-flect only those of Mt. Woodson, which is located ap-proximately 20 miles away from North Peak. Unfor-tunately there are no weather stations atop Stephen-son Peak and North Peak. They are presented, how-ever, to show that there was precipitation in the area. The observation of signal degradation with the snow storm (signal fade) is particularly interesting be-cause the RSL drop and eventual RSL increase oc-curred at very rapid rates. During this signal fade event, useful connectivity was lost for approximately the duration of the storm. Further details can be found in [10].
Many of the mountain sites within the HPWREN have snow on occasion; Figure 8 shows one of the grid antennae covered in snow and ice at the La Jolla relay site (backbone to user network node). As
dis-cussed in the preceding paragraph, it is quite evident that snow attenuates RSL. It would be reasonable to assume that this link path would be effected in a sim-ilarly negative manner. Unfortunately, radio data is unavailable for this time period (due to nonweather related conditions). In addition, even if radio data had been available, we lack weather instrumentation at this site. Clearly, additional work needs to be done in this area.
B. Wind
Wind appears to be another aspect of weather phenomena which may effect wireless network per-formance. To date, we have little direct evidence of this. However, the presumption of this effect is based on a number of factors. The pressure on an antenna during wind storms or strong wind gusts may shake or vibrate the radome thus causing it to gradually shift out of alignment. Even the slightest antenna mis-alignment can have noticeable effects on RSL.
For example, we had significant problems with an-tenna alignment atop the La Jolla relay. A particu-larly strong wind storm caused the antenna to move enough, such that the signal level dropped below ac-ceptable limits. This forced us to revisit the site and realign the antenna to achieve a stronger signal level. Special care must be taken to ensure precise and stable mounting, in order to avoid vibration and shift-ing. With our current deployment of cameras, it is possible to see antenna tower vibration in windy con-ditions. Knowing that our highly directional antennae (1.5 degree beamwidth for the 8 foot radome) are susceptible to misalignment, vibration of the tower and a shift in antenna alignment is a great concern.
C. Humidity and Temperature
Humidity and temperature are additional phenom-ena which may effect wireless networking equipment. Although the effects of temperature and humidity may be insignificant in terms of link path propagation, computer and radio equipment is highly susceptible to these factors. With this in mind, our measure-ments allow us to verify that the electronic equipment is maintained within the recommended environmen-tal conditions. If these conditions are exceeded, neg-ative results may arise. For example, if temperatures rise above recommended levels, the packet proces-sors in the routers may cause errors and failures. Ra-dio equipment is likewise effected, as high tempera-tures cause distortion in the output waveform during
Fig. 9. Indoor and outdoor temperature at Mt. Woodson in November 2000
final stage amplification.
In addition to allowing us to monitor whether equip-ment is within recommended operating environmen-tal conditions, sudden temperature changes can alert us to potential problems or emergencies. For exam-ple, in November 2000 (Figure 9), we noticed that the temperature in the Mt. Woodson communications room rapidly approached 40 degrees centigrade. Our first thought was perhaps a small fire, but investi-gation showed that it was an air conditioning issue. While not as dangerous as a fire, if left unrepaired, this situation could have damaged the equipment at this site, thus corrupting the data.
V. FUTUREWORK AND CONCLUSION
We have yet to find conclusive evidence that as-sociates network degradation or improvement to de-fined weather phenomena. There are a number of possible reasons for this. First, we have not deployed weather stations at all of the wireless network sites. Second, we have collected data for a relatively short period of time. Third, our weather instrumentation is rather rudimentary, and although accurate, does not give high precision. Furthermore, there may be an association between weather phenomena and net-work metrics that we cannot yet measure. For exam-ple, we cannot accurately measure cloud cover, iono-spheric levels and inversion layers. This leaves open many questions regarding weather phenomena and their effects on the wireless network performance.
The effects of solar conditions on the HPWREN may also be an interesting area for future research. Solar flux, a measurement of the intensity of solar radio emissions with a wavelength of 10.7 cm (a fre-quency of about 2800 MHz), may have a significant role in the daily functioning of the HPWREN. Dur-ing solar activity peaks, the noise floor may increase, thereby effecting RSL. Currently, work is being done to record daily solar flux values. When available, these values will be displayed with the Tsunami and Lucent MIB data sets.
Visibility and cloud cover may also have strong
ef-fects on network performance and our solar arrays. The exact effects caused by fog and the marine layer, in terms of radio wave propagation, within the HP-WREN infrastructure are as yet unknown. It has been noted, however, that ‘rain fade’ (the degrada-tion of RSL due to rain) is a large problem when go-ing through cloud cover at microwave frequencies. With the marine layer being at a lower elevation than our mountain sites, significant effects may be felt be-tween the coastal and mountain nodes. We hope to associate marine layer, inversion layer, and fog ef-fects with RSL, through the use of high quality Web cameras atop Mt. Woodson and MLO.
With our current equipment and research, we have shown evidence of certain weather phenomena ef-fecting network performance. Future work should provide the opportunity to give more insight into the association of network performance and external weather phenomena.
VI. ACKNOWLEDGMENTS
This work was sponsored by the National Science Foundation under Cooperative Agreement No. ANI-9807479 and Grant No. ANI-0087344 to the Uni-versity of California, San Diego (UCSD). Frank L. Vernon of Scripps Institute of Oceanography (SIO), UCSD is the co-principal investigator of the HP-WREN. This work was done in close collaboration with the National Laboratory for Applied Network Re-search (NLANR) Measurement and Network Analy-sis group [11]. We would like to thank Todd Hansen for his support and inspiration. We would like to ac-knowledge the editing help received from Maureen C. Curran and Kim Bruch.
REFERENCES
[1] High Performance Wireless Research and Education Net-work (HPWREN), http://hpwren.ucsd.edu/
[2] Request For Comments, http://www.freesoft.org/CIE/RFC/ [3] Broadband wireless WAN networking systems: Western
Multiplex, http://www.wmux.com/ [4] Lucent, http://www.lucent.com/
[5] Oregon Scientific, http://www.oregonscientific.com/wm918 .html
[6] HPWREN Weather Station Data, http://stat.hpwren.ucsd. edu/Weather
[7] HPWREN Measurement and Analysis Web Server, http:// stat.hpwren.ucsd.edu/
[8] Weather Station Parts, http://stat.hpwren.ucsd.edu/Weather/ html/construction.html
[9] VHF/UHF/Microwave Radio Propagation: A Primer for Digital Experimenters, http://www.tapr.org/tapr/html/ve3jf. dcc97/ve3jf.dcc97.html
[10] Todd Hansen, Pavana Yalamanchili, and Hans-Werner Braun. Wireless Measurement and Analysis on HPWREN, unpublished. E-mail: [email protected]
[11] National Laboratory for Applied Network Research (NLANR) Measurement and Network Analysis group, http://moat.nlanr.net/