Working Paper no. 4/2000
Determinants of net trade flows in the OECD: new evidende with special emphasis on the
case of the former communist members
Carmela Martín Francisco J. Velázquez
The European Economy Group (EEG) was formed in 1998 within the framework of a Jean Monnet Action. Since November 2000 its activities are partially financed by the Uni2-UCM Chair on European Economy. Its objective is to undertake and promote research and other academic activities about the European integration process.
The EEG Working Papers Series disseminates the original and unpublished research of its members and collaborators.
More information on the EEG can be obtained on the web site http://www.ucm.es/info/econeuro.
Carmela Martín and Francisco J. Velázquez Universidad Complutense de Madrid
Grupo de Economía Europea
(*) The authors gratefully acknowledge helpful comments from José Luis Raymond on an earlier version. The paper has also benefited from the insightful suggestions of participants in the IX International Conference of the International Trade and Finance Association.
Universidad Complutense de Madrid Campus de Somosaguas
Grupo de Economía Europea 28223 Madrid (Spain) Phone: 34-91-394 24 54
e-mail: [email protected] [email protected]
DETERMINANTS OF NET TRADE FLOWS IN THE OECD: NEW EVIDENCE WITH SPECIAL EMPHASIS ON THE CASE OF THE
Abstract
This study explores - by estimating an econometric panel data model – the capacity of some of the hypotheses formulated in the recent dynamic models of trade and economic growth to explain the bilateral trade of OECD countries. In this respect, special emphasis is placed on the former communist members in order to assess whether their case differs from that of the OECD on the whole.
Amongst other findings, our study suggests that the larger a country’s endowment of capital, both tangible and intangible (human and technological capital), in relation to that of its trade partners, the better the export/import ratio of its bilateral trade. It also shows that direct investment enhances the export/import ratio with the host country. The results obtained for the former communist countries reflect only a few minor differences in relation to the others.
Index
Page
Introduction 3
Theoretical Framework 4
Econometric Analysis 8
Specific evidence for the former communist members 15
Conclusions 17
Bibliography 20
Appendix: Statistical sources and procedure used to estimate the
Introduction
The purpose of this paper is to enhance our knowledge of the determinants of trade in the OECD with an empirical study of the influence of the differences in the countries’ relative factor endowments on their bilateral trade1. In this respect, it refers not only to traditional productive factors – physical capital and labour – but also to the other types of capital, tangible and in particular intangible (specifically, human and technological capital), highlighted in the recent dynamic models of trade and economic growth.
Special emphasis is placed on the new Central and Eastern European member countries (CEECs) - Poland, the Czech Republic and Hungary – in order to assess whether they differ from those of the OECD on the whole.
The study is structured as follows. Section II discusses the theoretical hypotheses. Section III presents the empirical model and comments on the method used and econometric results referring to the OECD countries as a whole. Section IV estimates the model for the CEECs. Finally, the closing section summarises the main conclusions. In addition, an appendix has been included to explain the procedure used to draw up the variables.
Theoretical framework
The starting idea is that, just as the reformulation of the neo-classical model of Solow (1957) with the inclusion of technological and human capital as endogenously generated productive factors (together with the differentiation of several variants in physical capital, in particular the breakdown of infrastructure) has substantially enhanced our knowledge of the reasons behind the absolute and relative growth of countries2, the adaptation of the Heckscher-Ohlin model with the incorporation of all these factors could also lead to a significant advance in the explanation of international trade. Thus, this enlargement of the countries’ factor endowment and the consideration of its dynamic nature – in that the endowment can be modified by investing in the generation of each asset of this type – seem to be a more appropriate channel of analysis to explain several stylised facts of international trade, such as its considerable geographical concentration in countries (basically those encompassed in the OECD) with similar relative endowments of physical capital and labour, the ever higher level of intra-industrial trade in which vertical differentiation predominates, and the important and increasingly greater presence of intra-firm trade.
Indeed, in the most recent scientific studies in the area of international trade there has been renewed interest in the ideas of the H-O model, albeit with a profound and varied 1
Deardorff (1984) offers a survey on the sequence of the most relevant tests of the Heckscher-Ohlin model to that year, and Leamer and Levinsohn (1995) provide a survey on much of the evidence for the subsequent decade. References for even more recent studies are given later.
reformulation of its assumptions, in an attempt to arrive at more realistic explanations3. In this respect, the assumption of the existence of technological differences between countries, the incorporation of human capital, the consideration of economies of scale of different types and the recognition of product diversification basically constitute the new assumptions envisaged in the new versions of the model of factor proportions.
It is worth highlighting that many of the models involve a return to the conviction, held by David Ricardo in the early 19th century, of the importance of the productivity differences between countries in explaining international trade patterns4 - a conviction that was otherwise never entirely eliminated in international trade theory. Thus, it is interesting to note that after the first test of the Heckscher-Ohlin model and its unexpected findings, which gave rise to what has since been known as the “Leontief paradox”, Leontief himself referred to productivity differences (superiority of the productivity of workers in the United States) in an attempt to find an explanation. Moreover, as noted in the recent survey in Helpman (1998), in subsequent literature various studies show that the patterns of international trade cannot be understood without considering the existence of productivity differences between the countries5.
2
A detailed view of endogenous growth models developed since the early 1980s can be found in Barro and Sala-i-Martín (1995) and Grossman (1996), and a recent survey of the empirical evidence is presented in Temple (1999).
3
One example is the recent edition of the Review of International Economics, volume 7 (1), 1999, in which the basic ideas of H-O are reinforced by relaxing many of its assumptions.
4
A recent study by Eaton and Kortum (1997) provides consistent evidence with an extension of Ricardo’s model that explains productivity differences on the basis of the differences in the countries’ technological levels.
5
By way of example, see the more recent ones: Trefler (1993, 1995), Davis, Weinstein, Bradford and Shimpo (1997), and Harrigan (1997, 1999).
In other respects, it becomes increasingly clear that these productivity differences are in turn largely attributable to disparities in technology and, in a complementary way, in the training of labour in the countries in question6. Moreover, these factors have also been found to be essential ingredients in competitive strategies based on product differentiation, especially that of a vertical nature. In this respect, it could be argued that the production of higher quality goods will be more intensive in technology and human capital than lower quality ones and, therefore, that countries with a higher relative endowment of said factors will tend to specialise in the export of product lines with a higher level of quality and vice versa.
Consequently, this interpretation of the Heckscher-Ohlin model is consistent with the more innovative explanations of intra-industrial trade that, on observing the predominance of vertical intra-industrial trade (in other words, trade involving qualitatively differentiated product lines), question the appropriateness of the models of monopolistic competition to understand this type of trade. They suggest it would be appropriate to return to an approach that emphasises technological differences and factor endowment, albeit now considered of a dynamic nature or, more precisely, determined by the quantity and efficiency of investment in physical (plants and machinery) and intangible (training and R&D) assets7.
6
Grossman and Helpman (1995) give an overview of the studies that have analysed the relationship between technology and trade. The evidence of the influence of human capital on trade has been underscored since the pioneering studies of Keesing (1965, 1966) and Kenen (1965).
7
Finally, it should be noted that, given the overwhelming evidence accumulated in recent years on the considerable and growing importance of international capital movements in the form of direct investment and, therefore, of the enormous development of multinational firms, the attempts to explain trade that do not contemplate this aspect appear doomed to obtain more or less unsatisfactory results. This is particularly true when – as in our case – attempting to explain the trade between developed countries, because the largest proportion of direct investment is in fact concentrated in these countries. In this respect, Markusen (1998) argues that a broad and dynamic view of comparative advantages may be compatible with the more convincing explanations concerning the surge and expansion of multinational firms and their growing role in shaping international trade patterns, as developed on the basis of the OLI paradigm or “eclectic theory” formulated in Dunning (1974, 1993).
Nonetheless, even though all these developments have helped overcome the limitations of the neo-classical theory, as well as the subsequent complementary models of monopolistic competition, we still do not have a model that explains satisfactorily and inclusively the reality of international trade, especially with respect to the developed countries. For the time being, we will have to continue combining different models and, through empirical research, improve their explanatory capacity. In any case, as Helpman has correctly noted in the form of a corollary to his survey on the research carried out in this area over the past 20 years, we need models that take into account the influence of
technology and its impact on the dynamic and changing nature of comparative advantages8.
Thus, in this paper, our intention is simply to carry out an “empirical exploration” of several of the theoretical hypotheses formulated within this family of dynamic models of trade and economic growth that suggest that the countries’ comparative advantages are basically generated by investment in R&D and education to increase technological and human capital, while at the same time underscoring the role of multinational firms.
Econometric analysis
In this theoretical context, our study explores, on the basis of regression analysis and using new own elaborated data, the influence of the above-mentioned relative factor endowments in determining the bilateral trade performance of OECD countries, estimated by the export/import ratio, as registered in recent years for those for which the information could be calculated: 1986-19969.
8
Thus Helpman points out: “Technological change has modified the patterns of specialization, has reduced trading costs and encouraged larger trade volumes, new countries have joined the trading system, and multinational corporations have spread their net more than ever before... All this means that we need more technologically oriented trade theory and more emphasis on dynamics in order to understand these developments.” Helpman (1998: 587).
9
The sample encompasses 756 bilateral flows (corresponding to 28 countries, as the figures for Belgium and Luxembourg must be taken together) and spans 11 years, representing a total of 8,316 observations. However, given the specification of the dependent variable – the bilateral export/import ratio – and the resulting symmetry in the regressors, depending on whether it is defined from the standpoint of the exporter or importer (since all are defined as ratios), the same result is reached by carrying out the estimate in terms of bilateral trade flows in a single direction, which of course reduces the sample by half, or 4,158 observations.
More specifically, the equation estimated is the following:
btit = β0 + β1kit + β2tifit + β3h kit + β4 t kit + β5 f kit + β6sizeit + εit
where:
btit = bilateral export/import ratio from the standpoint of the export country
kit = relative endowment of physical capital/labour of the export country vis-à-vis that of the import country
tifit = relative endowment of transport infrastructure of the export country vis-à-vis that of the import country
hkit = relative stock of human capital of the export country vis-à-vis that of the import country
tkit = relative stock of technological capital/labour of the export country vis-à-vis that of the import country
fkit = bilateral stock of direct investments
size = GDP of the export country relative to the GDP of the import country
And where all the variables are specified in logarithms.
The economic justification of the variables that measure the relative endowments of the two types of capital, tangible and intangible (k, tif, hk and tk), is the abundant and solid evidence (both at the level of firms and of countries) on their positive and significant
influence on productivity10 and therefore presumably on the competitiveness and performance of foreign trade. Moreover, particularly in the case of technological and human capital, this influence is likely to be greater not only because – according to most studies – its impact on productivity is greater due to the existence of positive externalities11, but also because it constitutes an essential factor for competing on the basis of strategies of product differentiation that appear, at least in the case of the developed countries, to be so important.
The inclusion of the variable that estimates the ratio of bilateral stock of direct investments (fk)12 is explained by the significant influence, also conclusively shown in previous studies, of multinational firms in shaping the geographical structure (and also product structure) of international trade. Thus, we know that a high and growing proportion of world trade is carried out by multinational firms and also that, for the most part, this involves trade between subsidiaries or companies associated with the multinational firm, i.e. intra-firm trade. But, unfortunately, our knowledge of the nature and size of this trade is scant, because it is based on data obtained from surveys taken among a sampling of companies with insufficient coverage and time spans. In any event, the studies based on this type of information have underscored that, even though the trade strategies of multinationals are varied and complex, several dominant behavioural patterns
10
By way of example, see the many bibliographical references in the books cited in note 2. 11
Note that, in considering that technological capital and human capital are determinants of the countries’ comparative advantages, it is implicitly assumed that their positive externalities are not full across countries. The opposite – in other words, if these factors were treated as international public goods – would mean returning to the stricter framework of the H-O model, where there are no differences either in technological capacity or in the training of labour across countries.
exist. Most notable among these is the fact that firms with foreign capital show both a greater export propensity and, above all, a higher import propensity than companies whose partners are all residents13. As a result, it seems reasonable to assume that in the definition of the trade strategy of multinationals the supply of the host country’s market, via exports, is a priority criterion. Consequently, it is also logical to expect – as in our empirical model – that the direct investment carried out in a country will facilitate obtaining better results (greater coverage) in its bilateral trade.
Finally, the last of the regressors included in the equation, the ratio between the GDP of the export country relative to that of the import country (size), seeks to explore the impact of the relative size and growth of the countries’ economic activity on their mutual trade relations. Indeed, this variable implicitly incorporates the joint effect of the other two variables, which have an opposite impact on the export/import ratio. On the one hand, in that it is a measure of the export country’s relative size, it is an estimation of the potential use of economies of scale, and thus it is likely to have a positive sign. But, on the other hand, this variable captures the trends in the activity of the export country in relation to that of the host country of the exported products, which should be inversely related to the export/import ratio. For this reason, in estimating the model, to separate the two effects, this variable will be broken down by temporal average and deviation.
12
In other words, the coefficient of the stock accumulated by the export country in the host country of the exports and its reciprocal.
13
See Markusen (1995) for references to this and other empirical regularities found in the behaviour of multinational firms.
As explained in detail in the appendix, the measurement of many of the variables – specifically, the relative endowments of physical capital, transport infrastructure, human capital and technological capital – required a laborious task of compiling and editing the basic information in order to construct a homogeneous panel of data on all variables for each of the OECD member countries during the reference period. In fact, the estimation of the stocks of all these variants of capital is considered one of the relevant contributions of this study.
For the econometric estimation, the standard panel technique was used. In order to avoid the biases derived from the existence of individual correlated effects, with the explanatory variables we used the standard within-group estimator, because it allows us to obtain consistent estimators (see Hausman and Taylor, 1981).
The results of the estimation of this basic specification of the model are given in Table 1, column 1.
(Table 1 around here)
As seen, all the coefficients of the regressors are significant and show the expected signs, with the exception of physical capital and human capital. In this respect, given that the other types of capital give good results, we might suspect that this paradoxical finding stems from the existence of problems of multi-colinearity. In fact, the examination of the matrix of correlations (see Table 2) shows that there is a high correlation between some regressors, particularly between the relative endowments of several of the capital variants,
which confirms these suspicions. Thus, to avoid the problems of multi-colinearity, we carried out an analysis of the principal components, giving rise to a grouping of the regressors in two factors: factor 1 (formed by the variables kit and tifit), which is the conjunction of the variables that measure the endowment of the different types of tangible capital, and factor 2, which includes the two regressors that measure intangible capital (hkit and tkit).
(Table 2 around here)
We then made a new estimation of the reformulation of the equation which incorporates these two factors, whose results are shown in Table 1, column 2. In accordance with this estimation, both the factor that approximates tangible capital (tangk) and the one referring to intangible capital (intgk) have the expected sign and are significant. Before accepting the validity of such a satisfactory result, however, we should make sure that it is not the product of problems caused by errors in the measurement of such a complex variable of intangible capital.
An appropriate procedure to avoid this eventuality is to replicate the estimation by using an instrumental variable, taking into account that for it to be a good instrument it must be correlated with the regressor which it substitutes and not correlated with the residual. As an instrumental variable of intangible capital, here we have chosen GDP per capita with a one-year lag, as it is considered to comply with both requirements. The results of the estimation under this method of instrumental variables – shown in the same Table 1,
column 3 – underscore that, once implemented, the relative intangible capital variable – just like the other explanatory variables – continues to show a significant influence in determining the bilateral trade relations of the OECD countries.
However, since several events as important as the launch of the single European market occurred in the reference period of the analysis, before concluding this empirical study on the explanatory factor of bilateral trade in the OECD zone, it would seem interesting to explore their possible influence. To this end, we made an additional estimation to examine the performance over time of the previously estimated elasticities. We interacted a time trend with each of the model’s explanatory variables, and this allowed us to recover an initial value for their elasticity, corresponding to the value of the first year (1987, in this case), and another for the trend (here with nil initial value) which, multiplied by the year in question and added to the previous value, would give the elasticity value for each year.
Naturally, this procedure relaxes the assumption of the estimated coefficients’ stability over time, although it assumes that the trend they follow is linear. The results of this new estimation, presented in Table 1, column 4, corroborate the influence of all the regressors and also signal several interesting qualifications. Notable among these is the clearly upward trend of the elasticities of the intangible capital and relative stock of foreign investment. Also, these findings capture better the effect of the variable of relative size by showing that, even though the relative size level has a positive impact on the export/import ratio
(economies of scale effect), the deviation of this variable affects it negatively, as logically expected14 (external demand effect).
Specific evidence for the former communist members
In this section we will use the empirical model estimated to explain the bilateral trade of the OECD countries as a whole in order to explore the possible specificity of the trade patterns of the three CEECs which recently joined the organisation15.
The relatively short period transpired since the collapse of the COMECON – and, by extension, of the autarkic policies practised by these former communist countries in their trade with non-COMECON countries – leads us to believe that their trade patterns may differ from those of the OECD countries as a whole.
However, in light of the rapid intensification of the trade of these three CEECs with the OECD countries, the vitality of the direct investment received and in general of the profound economic changes which have since arisen, there is room to believe that the determining factors of their trade flows resemble those of the other OECD countries.
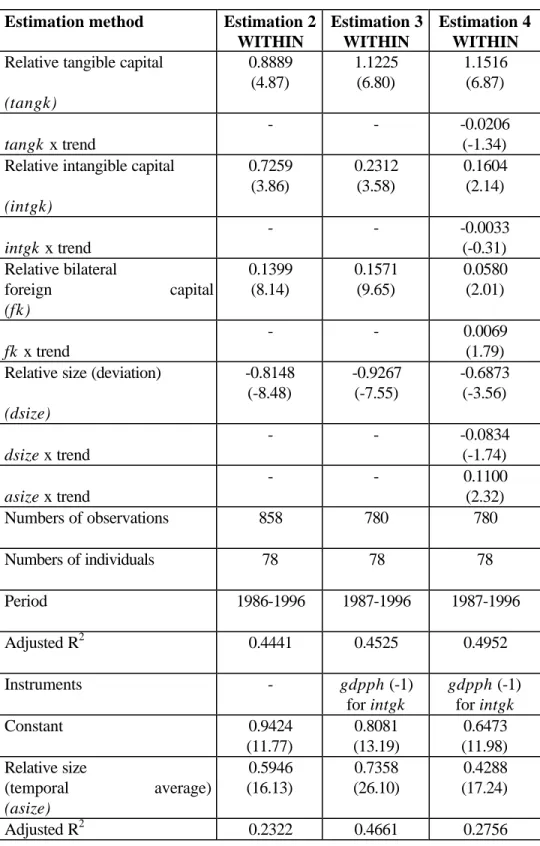
(Table 3 around here)
14
Note that a negative sign, in that it is defined as the ratio of the variation of the export country’s GDP with respect to that of the import country’s GDP, signifies a positive influence of the pressure of external demand.
15
Specifically, these countries joined the OECD on the following dates: Czech Republic, 21 December 1995; Poland, 22 November 1996, and Hungary 7 May 1996.
In this context, it would seem interesting to explore this question by estimating the same empirical model applied to the bilateral flows of the three new members. Indeed, the findings of this estimation – shown in Table 3 – suggest that the explanatory factors of the new former communist members’ bilateral trade are in general similar to those of the OECD members as a whole. Thus, the case of the former communist partners reflects only a few differences, such as the higher influence of the relative endowment of tangible capital and the much greater importance of the penetration of foreign capital in determining the trade performance of these countries.
Conclusions
In sum, our study suggests that – in the OECD zone at least – the greater a country’s capital endowment, both tangible and intangible, in relation to that of its trade partners, the better its bilateral export/import ratio. Moreover, it shows that direct investment enhances the export/import ratio with the host country. Likewise, the present study suggests that the performance of net exports is more influenced by the trends in economic activity on the host market than by the size (possibility of benefiting from economies of scale) of the export country.
Finally, the specific estimate referring to the three new Central and Eastern European member countries has shown that all the above-mentioned variables also exert a significant influence in shaping their trade flows. Thus, the case of these countries reflects only a few minor differences with respect to the OECD countries as a whole.
TABLE 1. RESULTS OF THE ESTIMATIONS
Dependent variable: bilateral export/import ratio
Estimation method Estimation 1
WITHIN Estimation 2 WITHIN Estimation 3 WITHIN Estimation 4 WITHIN
Relative physical capital (private and public) (k)
-0.1222 (-2.04)
- -
-Relative endowment of
transport infrastructure (tif)
0.0921 (1.82)
- -
-Relative tangible capital
(tangk) - 0.1389 (2.27) 0.2897 (5.24) 0.2795 (4.88) tangk x trend - - - -0.0095 (-1.97) Relative stock of technological
capital
(tk)
0.3124 (7.73)
- -
-Relative stock of human capital
(hk)
-0.0401 (-0.90)
- -
-Relative intangible capital
(intgk) - 0.3071 (5.27) 0.1812 (4.75) 0.1018 (2.45) intgk x trend - - - 0.0160 (4.62) Relative bilateral of foreign capital (fk) 0.0517 (8.04) 0.0574 (9.05) 0.0662 (9.96) 0.0313 (3.65) fk x trend - - - 0.0032 (2.90) Relative size (deviation)
(dsize) -0.5804 (-12.69) -0.6191 (-14.33) -0.7644 (-13.69) -0.4276 (-5.01) dsize x trend - - - -0.0616 (-3.45) asize x trend - - - 0.0692 (3.50) Numbers of observations 4,158 4,158 3,780 3,780 Numbers of individuals 378 378 378 378 Period 1986-1996 1986-1996 1987-1996 1987-1996 Adjusted R2 0.7569 0.7548 0.7694 0.7758 Instruments - - gdpph (-1) for intgk gdpph (-1) for intgk Constant -0.0809 (-6.54) -0.0911 (-6.61) -0.0873 (-6.28) -0.0797 (-5.92) Relative size (temporal average) (asize) 0.4855 (82.60) 0.5223 (79.82) 0.6905 (104.59) 0.3386 (52.91)
Adjusted R2 0.6213 0.6051 0.7432 0.4255 Result of the analysis of principal components:
tangk = 0.548551 tif + 0.533134 k intgk = 0.556164 tk + 0.503179 hk
Result of the auxiliary regression of the estimation of the instrumental variable of intangible capital:
intgk = 0.1064 + 1.2940 gdpph (-1) Adjusted R2 = 0.6677 (6.15) (87.15)
TABLE 2. CORRELATION MATRIX OF THE INDEPENDENT VARIABLES Relative physical capital (k) Relative technological capital (tk) Relative human capital (hk) Relative endowment of transport infrastructure (tif) Relative penetration of foreign capital (fk) Relative size (size)
Relative physical capital
(k) 1.0000 Relative technological capital (tk) 0.8309 1.0000
Relative human capital
(hk) 0.6449 0.7817 1.0000 Relative endowment of transport infrastructure (tif) 0.7093 0.7222 0.5150 1.0000 Relative penetration of foreign capital (fk) 0.5680 0.5723 0.4181 0.4153 1.0000 Relative size
(size)
TABLE 3. RESULTS OF THE ESTIMATIONS FOR THE FORMER COMMUNIST MEMBERS
Dependent variable: bilateral export/import ratio
Estimation method Estimation 2
WITHIN
Estimation 3 WITHIN
Estimation 4 WITHIN
Relative tangible capital
(tangk) 0.8889 (4.87) 1.1225 (6.80) 1.1516 (6.87) tangk x trend - - -0.0206 (-1.34) Relative intangible capital
(intgk) 0.7259 (3.86) 0.2312 (3.58) 0.1604 (2.14) intgk x trend - - -0.0033 (-0.31) Relative bilateral foreign capital (fk) 0.1399 (8.14) 0.1571 (9.65) 0.0580 (2.01) fk x trend - - 0.0069 (1.79) Relative size (deviation)
(dsize) -0.8148 (-8.48) -0.9267 (-7.55) -0.6873 (-3.56) dsize x trend - - -0.0834 (-1.74) asize x trend - - 0.1100 (2.32) Numbers of observations 858 780 780 Numbers of individuals 78 78 78 Period 1986-1996 1987-1996 1987-1996 Adjusted R2 0.4441 0.4525 0.4952 Instruments - gdpph (-1) for intgk gdpph (-1) for intgk Constant 0.9424 (11.77) 0.8081 (13.19) 0.6473 (11.98) Relative size (temporal average) (asize) 0.5946 (16.13) 0.7358 (26.10) 0.4288 (17.24) Adjusted R2 0.2322 0.4661 0.2756
Bibliography
Barro, R. and Sala-i-Martín, X. (1995): Economic Growth, McGraw-Hill, New York.
Blanes, V. and Martín, C. (1998): The nature and causes of intra-industry trade: back to the comparative advantage explanation? The case of Spain, Working Paper 144/1998, FUNCAS, 28 pp.
Davis, D.R. (1995): “Intra-industry trade: A Heckscher-Ohlin-Ricardo approach”, Journal of International Economics, vol. 39, 202-226.
Davis, D. R., Weinstein, D.E., Bradford, S.C., and Shimpo, K. (1997): “Using International and Japanese regional Data to Determine when the Factor Abundance Theory of Trade Works” American Economic Review, 87 (3), 421-446.
Deardorff, A.V. (1984): “Testing Trade Theories and Predicting Trade Flows” in: Jones, R.W. and Kenen, P.B. (eds.): Handbook of International Economics. Volume I, chapter 10, 467-517, Elsevier Science Pub.
Dunning, J.H. (1974): Economic Analysis and the Multinational Enterprise, Allen & Unwin.
Dunning, J.H. (1993): Multinational Enterprises and the Global Economy. Addison Wesley.
Eaton, J. and Kortum, S. (1997): “ Technology and Bilateral Trade”, Working Paper 6253, N.B.E.R.
Greenaway, D., Hine, R. and Milner, C. (1995): “Vertical and Horizontal Intra-Industry Trade: a Cross-Intra-Industry Analysis for the UK”, The Economic Journal, vol. 105, 1505-1518.
Grossman, G.M. (ed.) (1996): Economic Growth: Theory and Evidence, Edward Elgar.
Grossman, G. M. and Helpman, E. (1995): “Technology and trade” in Grossman, G.M. and Rogoff, K. (eds.): Handbook of International Economics, Vol. 3, Amsterdam, North Holland.
Harrigan, J. (1997): “Tecnology, Factor Supplies, and International Specialization: Estimating the Neoclassical Model”, American Economic Review, vol. 87(4), 475-494.
Harrigan, J. (1999): “Estimation of cross-country differences in industry production functions”, Journal of International Economics, 47, 267-293.
Hausman, J.A. and Taylor, W.E. (1981): “Panel Data and Unobservable Individual Effects”, Econometrica, vol. 49, 1377-1398.
Helpman, E. (1998): “Explaining the Structure of Foreign Trade: Where Do We Stand?” Welt. Archiv., vol.134 (4), 573-589.
Keesing, D.B. (1965): “Labor skills and international trade: Evaluating many trade flows with a single measuring device”, Review of Economics and Statistics, vol. 47, August.
Keesing, D.B. (1966): “Labor skills and comparative advantage”, American Economic Review, vol. 56, May, 249-258.
Kenen, P.B. (1965): “Nature, capital and trade”, Journal of Political Economy, vol. 73, October, 437-460.
Leamer, E. and Levinsohn, J. (1995): “International Trade Theory: The Evidence” in Grossman, G. and Rogoff, K. (eds.): Handbook of International Economics. Volume III, chapter 26, 1339-1394, Elsevier Science Pub.
Markusen, J.R. (1995): “The Boundaries of Multinational Enterprises and the Theory of International Trade”, Journal of Economic Perspectives, vol. 9 (2), 169-189.
Markusen, J.R. (1998): “Multinational Firms, Location and Trade”, The World Economy, vol. 21, 733-756.
Solow, R. (1957): “Technical Change and the Aggregate Production Function”, Review of Economics and Statistics, vol. 39, August, 312-320.
Temple, J. (1999): “The New Growth Evidence”, Journal of Economic Literature, vol. XXXVII, 112-156.
Trefler, D. (1993): “International Factor Price Differences: Leontief was Right!”, Journal of Political Economy, vol. 101(6), December, 961-987.
Trefler, D. (1995): “The case of the Missing Trade and Other Mysteries” American Economic Review, vol. 85 (5) 1029-1046.
APPENDIX: STATISTICAL SOURCES AND PROCEDURE USED TO ESTIMATE THE VARIABLES
bt = bilateral export/import ratio from the standpoint of the export country
The data on bilateral trade flows were drawn from the IMF: Direction of Trade Statistics Yearbook. To solve the problem of the lack of coincidence between the trade data from the standpoint of imports (f.o.b.) and of exports (f.o.b.), the arithmetical mean between the two was calculated.
k = relative endowment of physical capital/labour of the export country with respect to that of the importer
The physical capital stock of each country was estimated on the basis of the accumulation of investment flows under the perpetual inventory method. The series on the GFCF (Gross Fixed Capital Formation) and their deflators are those which figure in the National Accounts and were taken from OECD:
National Accounts. Vol. I, Main Aggregates. The employment data were drawn from OECD: Labour Force Statistics, and United Nations: Statistical Yearbook.
tif = bilateral endowment of transport infrastructure of the export country with respect to that of the importer
The transport infrastructure endowment of each country was estimated by calculating the arithmetic mean of the availability of kilometres of standard motorway per km2 and per capita. The kilometres of standard motorway were calculated by using the kilometres available in each type of motorway, under the following criterion: 1 km. of motorway was assumed to equal 16 km. of state roads, 32 km. of provincial roads and 64 km. of local or urban roads. The data were obtained from various publications of the United Nations: Annual Bulletin of Transport Statistics for Europe and North America; Statistical Yearbook for Asia and the Pacific, and Anuario Estadístico de América Latina.
hk = relative human capital stock of the export country with respect to that of the importer
The stock of human capital of each country was estimated by calculating the percentage of the working-age population (15 to 64) with an standard level of education. Here we had to calculate the ratio between the weighted sum of the number of students who attended classes at all levels of education -between
1930 and the reference year of the human capital stock estimated- and the working-age population. The weight applied to convert the different levels of education into a standard one is the average expenditure per student at each level of education on average in the OECD countries. The data base is that of UNESCO: Statistical Yearbook; OECD: Education at a Glance, and EUROSTAT: Education across the European Union. Statistics and Indicators.
tk = relative stock of technological capital of the export country with respect to that of the import country
The stock of technological capital of each country was estimated on the basis of the accumulation of R&D expenditure under the perpetual inventory method (with a lag of two years) and assuming a 10% depreciation rate, based on data obtained from OECD: Main Science and Technology Indicators; Basic Science and Technology Statistics; Research and Development Expenditure in Industry, and UNESCO: Statistical Yearbook.
fk = penetration of foreign capital of the export country in the import country
The values of this variable – which approximates a country’s stock of foreign capital by source country – were obtained from OECD: International Direct Investment Statistics Yearbook. Given the disparities found between the trade flow data for the source and host countries, the statistics had to undergo a data-editing process.
size = GDP of the export country relative to the GDP of the import country
The GDP data for each country are those of the National Accounts and were drawn from OECD: National Accounts. Vol. I: Main Aggregates.