School of Electrical Engineering
Thesis submitted for examination for the degree of Master of Science in Technology.
Espoo 30.08.2019
Thesis supervisor:
Prof. Heikki Hämmäinen
Thesis advisor:
Author: Manohar Bayyapu Reddy
Title: Data Service Efficiency of Mobile Network Operators using Data Envelopment Analysis
Date: 30.08.2019 Language: English Number of pages: 9+55
Department of Communications and Networking Professorship: Network Economics
Supervisor: Prof. Heikki Hämmäinen Advisor: D.Sc. (Tech.) Benjamin Finley
The ubiquity of mobile devices such as smartphones, tablets, laptops, and mobile routers drive unprecedented mobile data traffic year after year. However, the actual mean mobile data usage (volume) per subscriber varies significantly between Mobile Network Operators (MNOs) and countries. Understanding these differences is im-portant for both MNO’s evolving business models and telecom regulation in general. A potential driver for these differences is MNO efficiency in delivering mobile
data services. Where efficiency is measured relative to non-financial inputs
(subscribers and spectrum) and output (total data volume). Given this context, this study estimates and analyzes the efficiency of data service delivery (data usage by subscribers) of 94 mobile operators from 28 countries by using the Data Envelopment Analysis (DEA) method.
The study demonstrates that many countries have a single highly efficient MNO due to that MNO’s effort to gain market share. While in a few other countries all MNOs are high efficiency likely due to country-level initiatives. Furthermore, major economic disparities between countries highly influence country-level efficiency scores. Finally, a case study between Finland and India highlights their similar high-efficiency scores but very dissimilar data service markets.
Keywords: Mobile network operator, Data volume, Data envelopment analysis, Efficiency
lot to investigate the economics and business aspects required for the study. I owe my thanks to my thesis advisor Benjamin Finley for his great support in every aspect of the thesis irrespective to the kind of help needed from him. His work on detail approach motivated me to work on the research effectively.
I would also like to acknowledge professor Hitoshi Mitomo and Kalevi Kilkki for their feedback and suggestions provided on the research. I am also thankful to all the team members of the network economics team, Alex, Jaspreet, Jaume, and Oliver, for their help and guidance.
Finally, I would like to thank my family and friends for their support. Especially, I am grateful to my mother, Ratnamma for her endless support in my life.
Otaniemi, 30.08.2019
Contents
Abstract ii
Preface iii
Contents iv
List of Figures viii
List of Tables ix 1 Introduction 1 1.1 Research question . . . 2 1.2 Scope of study. . . 2 1.3 Research method . . . 3 1.4 Thesis structure . . . 4
2 Literature review/Background information 5 2.1 Performance assessment . . . 5
2.2 Production theory. . . 6
2.3 Efficiency measurement concepts . . . 8
2.3.1 Input-oriented . . . 9
2.3.2 Output-oriented . . . 11
2.4 Approaches for measuring the efficiency. . . 12
2.4.1 Stochastic frontier analysis (SFA) . . . 13
2.4.2 Data envelopment analysis . . . 14
2.5 Performance measurement with non-financial parameters . . . 15
2.6 Efficiency studies using DEA in telecommunications . . . 16
3 Data envelopment analysis 19 3.1 Input-oriented CCR model . . . 19
3.2 Output-oriented CCR model . . . 21
4 Research approach 23 4.1 Research process . . . 23
4.2 Variables selection . . . 24
4.3 Decision making units selection . . . 27
4.4 Data availability and collection . . . 28
4.5 Software availability . . . 31
5 Data analysis and empirical findings 32 5.1 Data assessment. . . 32
5.2 Efficiency analysis at the operator level . . . 33
5.2.1 Productive efficiency of MNOs . . . 33
5.2.2 Efficiency vs market share . . . 33
6.4 Future research . . . 45
References 46 A Two inputs and two outputs case 51 A.1 Data . . . 51
A.2 Bivariate analysis . . . 52
A.3 Productive efficiency . . . 53
A.4 Efficiency vs market share . . . 53
Abbreviations
1G First Generation
2G Second Generation
3G Third Generation
3GPP 3rd Generation Partnership Project
4G Fourth Generation
5G Fifth Generation
AE Allocative Efficiency
APEC Asia-Pacific Economic Cooperation
CDMA Code Division Multiple Access
CCR Charnes-Cooper-Rhodes method
CRS Constant Returns to Scale
DEA Data Envelopment Analysis
DL Downlink
DMU Decision Making Unit
DRS Decreasing Returns to Scale
EE Economic Efficiency
EFIS ECO (European Commissions Office) Frequency Information System
ETSI European Telecommunications Standards Institute
EU European Union
FICORA Finnish Communications Regulatory Authority
GB Giga Bytes
GDP(PPP) Gross Domestic Product(Purchasing Power Parity)
GSMA Groupe Speciale Mobile Association
ICT Information and Communications Technology
IEEE Institute of Electrical and Electronics Engineers
IoT Internet of Things
IP Internet Protocol
IRS Increasing Returns to Scale
ITU International Telecommunication Union
KPI Key Performance Indicator
LTE Long Term Evolution
LTE-A LTE-Advanced
M2M Machine-to-Machine
MA Mergers and Acquisitions
Mbps Mega Bits Per Second
MHz Megahertz
MIMO Multiple Input Multiple Output
mmWave Millimeter Wave
MNO Mobile Network Operator
MTC Machine-Type Communication
OECD Organisation for Economic Co-operation and Development
PB Peta Bytes
Wi-Fi Wireless Fidelity
List of Figures
1 Mobile broadband data usage in OECD countries in 2017. . . 1
2 Performance components [50]. . . 6
3 Basic production functions with different input-output combinations. 8 4 Production function for all three RTS principles. . . 9
5 Framework for performance assessment[53]. . . 10
6 Technical and Allocative efficiencies in the input oriented approach. [27] . . . 11
7 Technical and Allocative efficiencies in output oriented approach.[20] 12 8 Research process followed in the thesis. . . 24
9 Mobile data services driven heirarchy of needs. . . 25
10 ITU region-wise selected countries for the study. . . 27
11 Correlation between inputs and output variables . . . 32
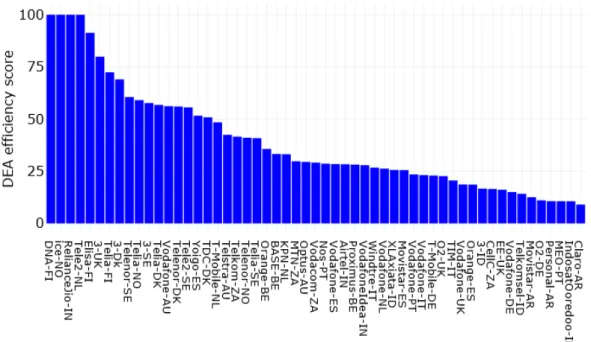
12 Productive efficiency scores of MNOs (in descending order). . . 33
13 Efficiency scores and market shares of MNOs (ranked by country alphabetically and market shares descending order). . . 34
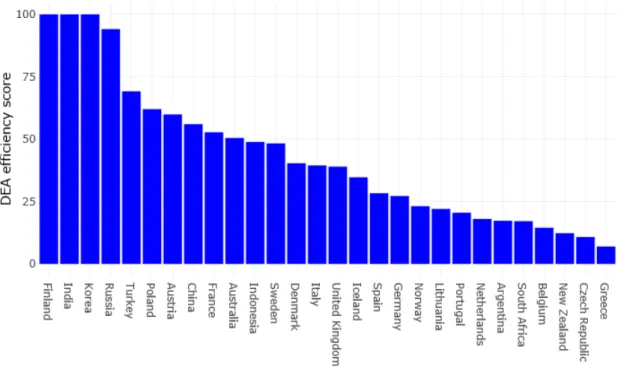
14 Efficiency scores of countries (in descending order). . . 35
15 Correlation between DEA efficiency scores and various other measures of countries. . . 37
16 Comparison of country’s mobile data efficiency scores with its fixed-line broadband subscriptions per 100 people. . . 38
A1 Correlation between inputs and outputs variables . . . 52
A2 Productive efficiency scores of MNOs (two input and two output). . 53
A3 Efficiency scores and market shares of MNOs (two input and two output). . . 54
The first hand-held mobile phone was introduced in 1973, since then there has been rapid advancement in the innovation of mobile phones and its communica-tion technologies. The growth of cellular devices and their advanced technologies also bringing the demand for more and more mobile data across the world. Many factors are supporting this demand including rapid commodification, adoption of smartphones along with the rapid growth of mobile applications, development of IoT and connected smart home devices. Specifically, Ericsson estimates that by 2023 global mobile data traffic will increase seven-fold compared to 15EB/month in 2017 [2]. However, this data traffic/usage is not equally divided across nations or operators. For instance, in 2017 the average mobile data usage per subscription per month in OECD countries was 2.94 GB, with the highest usage of 15.45 GB in
Finland and lowest usage of 0.72GB in Slovakia (see Figure 1) [4]. Consequently,
even within a single country, such as Austria, differences between mobile network operators (MNOs) can be substantial. For three Austrian operators the usages are 15.4 GB, 4.69 GB, and 3.4 GB in 2017.
Figure (1) Mobile broadband data usage in OECD countries in 2017.
Even though mobile data usage is rapidly increasing worldwide, huge disparities have been seen in its usage across the nations and MNOs. Understanding the reasons behind these differences is important for MNOs evolving business in ever-changing mobile technologies and the effect of telecom regulations on it. There is a need for the comparison between MNOs operations and resources utilization to find out these reasons. For this purpose, there is a need for the assessment of relative performance between MNOs. Further, this approach helps to find the differences at the country
this context, the data envelopment analysis (DEA) method is a frequently used non-parametric approach to assess productive efficiency with multiple inputs and multiple outputs.
Conventionally, organizations have been estimating their performance through account-based indicators or resources. The conventional performance measures with financial indicators would furnish small support to the firms which are interested in a complete scenario and looking for a higher competing advantage. Thus, there is an importance of using non-account based measures as well. This thesis study is in technical nature and non-financial measures will help for finding the differences in mobile data service delivery. Consequently, non-financial resources involved in mobile data service are used to determine the efficiency scores of MNOs and countries by adopting the DEA method. Further, this approach will illuminate the reasons for high dissimilarities in mobile data usage or mobile data service delivery.
1.1
Research question
Since the inception of 3G technology, the importance of mobile voice services shifted to mobile data services. Accordingly, the MNOs business dynamics and regulatory policies have also changed. The mobile data usage is ever-growing from 4G technology to upcoming 5G technology. However, the differences are quite high in mobile data delivery and usage across the MNOs and countries. Thus there is a need to envisage the reasons behind these dissimilarities which provides to understand MNOs operations and find the success of the regulatory policies in mobile data services. In this regard, the thesis study addresses the following research questions:
• What are the main factors that contribute to significant variation in delivering
mobile data services to subscribers at the operator level and country level?
• How the observed factors could be explained in MNOs business operations and
strategies along with the regulatory bodies role?
1.2
Scope of study
In general, widespread factors contribute to high variability in mobile data usage such as customer requirements and usage patterns, time spent on the internet, the
role of data-hungry applications, dominance of fixed-line broadband, deployment and adaptation of latest mobile technologies, affordability of data services, market dynamics, MNOs business strategies, MNOs resources usage, socio-economic differ-ences, regulation policies and country initiatives towards ICT evolution. There are two observations can be seen from these factors.
• Firstly, these factors can be broadly viewed as in consumers usage, MNOs
operations, and regulatory implications. Where, customer usage patterns allow to envisage the differences by their behaviors, demographics and social analytics; these, in turn, help MNOs to implement the strategies in highly competitive market place [52]. Additionally, MNOs operations, specifically apprehending their operational performance would permit to know broader aspects of influencing factors in the delivery of mobile data usage. Further, the regulatory implications facilitate fair competition and fair service levels towards the growth of the telecommunication industry. As the differences in mobile data usage can be seen majorly in three aspects, the MNOs role is a central part in it.
• Secondly, these factors constitute a huge number of variables. Accommodating
all these variables is quite challenging in an empirical study due to its data availability and suitability for performing empirical studies.
Thus, in this study, the scope is limited to find the reasons by measuring the efficiency of MNOs with the variables associated with the MNOs non-financial resources used for mobile data services. The efficiency scores are measured by using a non-parametric empirical method called data envelopment analysis (DEA). Few other variables are also considered later in the analysis part to validate the conclusions made.
1.3
Research method
The thesis comprises research based on the empirical results (efficiency scores) ob-tained from the performance and benchmarking quantitative model. This model widely used in operations research. The data required to conduct the empirical method are obtained from various sources, which are mostly publicly available and followed the external secondary data collection process. These sources are described in detail in chapter 4. Besides, this research also includes literature studies of aca-demic and industry research publications for better implementing the method and analyzing the results with respect to the business strategies of MNOs and underlining regulation policies involved.
Empirical studies are done using DEA method. This method is based on linear programming and can handle multiple inputs and outputs to find the productive efficiency of a firm. This thesis adopts the classical CCR model for finding the efficiency scores of MNOs [18].
method. Chapter 5 discusses data analysis and empirical findings from the DEA method to asses the data service efficiency scores of MNOs. Chapter 6 discusses the conclusions of the research and future work.
2
Literature review/Background information
This chapter details the importance of performance assessment, fundamental pro-duction theory concepts to understand the performance measurement techniques, various types of efficiencies involved and approaches to calculate these efficiencies to asses the performance. Further, the literature survey explains the importance and application of performance techniques using non-financial parameters and perfor-mance techniques used in the telecommunications industry.
2.1
Performance assessment
Performance assessment is the key to the growth of any firm in an industry. There has been a great opportunity of effort for the process of counting, measuring and comparing the performance levels of businesses. It is always important to choose an appropriate performance measurement technique when one intends to measure how well an organization is performing.
Performance denotes to output produced, and results are generated from products, operations, and services that allow assessment and analogs relative to targets, prior outcomes, and other establishments. This could be articulated in both financial and non-financial terms. In continuation, the evaluation of performance is a measurement which quantifies the input and output; performance magnitudes products, operations, services, and complete organization outcomes. This also includes evaluating numeri-cal information with other industries. It is common to illustrate the performance of production units as being more or less “productive”, or more or less “efficient”.
The terms productivity and efficiency are used synonymously to each other in many instances to discuss the performance assessment. Whilst they are closely related, they are two distinct concepts. Productivity is described as the proportion of output units created to input units utilized, whereas efficiency refers to an optimal observed value of productivity. This suggests that efficiency is considered as a relative performance measure in contrast to productivity. The efficiency also depends on how one describes or calculates it for the optimal performance value.
The performance is treated as a suitable mix of efficiency and effectiveness in service industries [50]. Efficiency refers to improving the productivity of a given number of outputs by using the minimum number of inputs, whereas effectiveness refers to the ability to set and achieving the organization’s goals and objectives to perform the job right. As one can see these are separate entities, for an organization they are closely related. The trade-off between usage of both entities together depends on the objectives of a business.
Figure 2 explains the conceptualization of service performance. Applying it to
Figure (2) Performance components [50].
data service performance while keeping the constant resources usage, technology-mix (different versions of 3G to 4G technologies) and case-mix (provision to different user segments) with respect to the company’s objectives. Effectiveness, more particularly, assesses the outcomes or goals of data services and can be influenced by the efficiency or can affect the efficiency. The effectiveness motivates to check the necessary inputs are being utilized to generate the best post possible outputs. An MNO can be efficient but not effective or vice versa, the motive is maintaining both.
In a mobile data service perspective, the MNOs performance needs to be calculated and compared for many reasons, comprises of:
1. Determining how firms are operating relative to competitors in a given industry sector, often this process also called "benchmarking".
2. Finding the changes in operations from one time period to another time period. 3. Assimilating with public policies.
In this thesis, performance is examined as a relative phenomenon between the MNOs. For this, MNOs are benchmarked at one period of time for the year 2017 in their mobile data services delivered. Also, the regulatory policies that are affected the MNOs operations are analyzed. There are challenges in yielding the effectiveness score as it is related to the firm’s objectives. Therefore, the performance study is limited to measuring the efficiency scores.
2.2
Production theory
As already discussed, productivity and efficiency terms are related to fundamental measures for an organization’s performance. The performance measuring techniques are related to production theory concepts. In this sub-section, production theory has been used as a framework for describing how different performance measures of
a firm can be explained and/or understood.
In general, a production process is the transformation of inputs into single or multiple outputs. This makes to increase the consumer usability of goods and services. The productive resources that a firm utilizes to generate the goods and services are called inputs, and the amount of generated goods and services are called outputs. Generally, inputs are raw materials, labor and capital and outputs are any kind of finished products.
A firm can often select one of the several mixtures of inputs to produce given output volume. A production function is a mathematical depiction with diverse recipes of input-output combinations from which a firm can pick to set its production function. In specific, the production function says about the firm’s maximum output
quantity yielding from the employed input quantities. If xi is theith input and y is
the single output, then production function withk inputs represented as
y=f(xi) =f(x1, x2, . . . , xk) (1) This production function is depicted in microeconomic theory concepts. Using this function, one can show the generated maximum output of a firm with the inputs used. However, it does not give findings of whether a firm is efficiently producing that output. It just connotes the inputs combinations to produce the output quantities. Given this drawback with productivity principle, efficiency concept is helpful to find whether the generated output is maximum or not with the used input-output combinations.
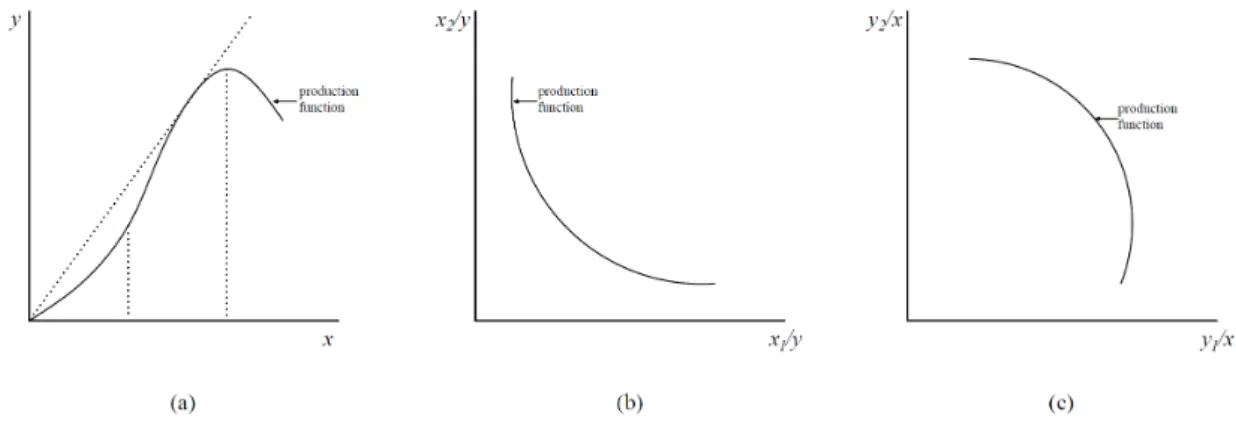
Production function can be represented graphically. Figure 3(a) shows a curve of
the production function with one input and one output. This explains the law of diminishing returns, which is the most fundamental principle of economics [55]. This serves as a pivotal part in production theory. Law of diminishing return pertains to short-run due to only then is some factor fixed. Under this law, as the firm adds more and more input units it will generate few and fewer outputs. Alternatively, the amount of input increases the marginal product of each unit of input will diminish. Ideally, the firm’s production with one input and one output combination will not
be the case under study. Consequently, Figure 3(b) and 3(c) show the graphical
representation of production function for the two-input and one-output case and one-input and two-output case respectively. Further, extending the graphical repre-sentation for a multiple-input and multiple-output case is difficult because of the complexity in drawing the diagrams in more than two dimensions.
Mostly, the production function is defined in the long run on the basis variable productive factors (inputs and outputs). In the long run, all these factors are not fixed and become variable. Thus, the concept of returns to scale (RTS) arises under the circumstances of production function and it articulates the behavior of a production function when the changes occur in all the productive factors. Fundamentally, RTS explains the behavior of variations in output proportion to the variations in the
Figure (3) Basic production functions with different input-output combinations. proportion of input.
There are three different types of RTS principles.
1. Increasing returns to scale (IRS): This is a scenario where the variation in output proportion is higher than to the equi-proportional change in the inputs of production. For instance, if all the inputs are doubled in production then the corresponding output of production increases at more than double rate. 2. Constant returns to scale (CRS): This is a scenario where the change in output
proportion is the same as the change in inputs proportion of production. It means if all the inputs quantities are doubled then the output also increases double.
3. Decreasing returns to scale (DRS): This is a scenario where the variation in output proportion is smaller than to an equi-proportional change in the inputs of production. It is also called as diminishing returns to scale. For instance, if all the inputs are doubled then the output increases at lower then double rate.
Figure 4 represents the production function form of all the three RTS principles
for a single input and single output case.
The technical relationship between inputs and outputs are referred widely as production function in economics literature, whereas it is referred to as production frontier in efficiency measurement literature. However, these two phrases can be used interchangeably [20]. This is the key connection between economic theory literature and efficiency measurement literature. The frontier term widely uses in the latter research area. Thus production frontier is used in most parts of this thesis.
2.3
Efficiency measurement concepts
Figure5 illustrates the complete framework associated with performance assessment.
Figure (4) Production function for all three RTS principles.
objective in this research (also discussed in section 2.1). Further, the efficiency is divided into two concepts and it is important to describe these two concepts which
are shown in Figure 5. The discussion of efficiency measurement concepts starts
with seminal work of Farrell in 1957. This work is based on the simple estimate of firm efficiency with multiple inputs which was proposed by Debreu and Koopmans [27]. According to Farrell’s work, an organization’s efficiency comprises of two parts: one is technical efficiency, this contemplates efficiency of an organization to acquire the maximum output with provided inputs, and second is allocative efficiency, this envisages the use of optimal proportions of inputs with the specified costs of these inputs and production technology. The mixture of these two efficiencies is called as economic efficiency [20].
Allocative and technical efficiencies are calculated in a couple of approaches viz., input-oriented and output-oriented. The former one (input-oriented) addresses the reduction of input supplies needed without altering the output volumes. In contrast to this, the latter one ( output-oriented) offers to expand the output quantities by keeping the input quantities constant. The following sub-section starts with a focus on reducing the inputs, which is Farrell’s fundamental idea and this is termed as input-oriented measures. The subsequent sub-section to this is focused on output-oriented measures.
2.3.1 Input-oriented
Consider a firm delivering only one output y with the use of two inputs x1 and x2
with a postulate of constant returns to scale (CRS). The firm’s production frontier is
Figure (5) Framework for performance assessment[53].
CRS principle. Thus the production frontier could be expressed as a unit isoquant
and this is represented in Figure6 as F F0. TheF F0 represents the produced output
unit with a minimum mixture of inputs per output unit. Consequently, supporting this, the combination of inputs that fall on unit isoquant is deemed technical efficient. Conversely, if a point falls over the isoquant such as point P which uses more than enough resources to produce an output unit thus this point is defined as technical
inefficient. From Figure6, the distance QP across the line OP estimates a
produc-tion unit’s technical inefficiency at point P. This span indicates all the quantity of inputs can be divided instead of reducing output quantity. The technical inefficiency incorporated with the production unit at point P expressed by QP/OP, and hence, the production unit’s technical efficiency (TE) is 1-QP/OP or OQ/OP.
Technical efficiency calculated as
T E =OQ/OP (2)
The producer is accountable not only for choosing a technical efficient point on the isoquant but also for choosing the optimal point to minimize the cost. This is an allocation problem and the related efficiency is called as allocative efficiency (AE). It is also referred to as price efficiency in economic literature. For instance, here cost minimization is assumed by knowing the market prices information, the input
price ratio is depicted by isocost-line AA’ as shown in Figure 6. In this instance,
the least-cost combination of inputs represented by point Q’ which is technical and allocative efficient but the combination of the inputs represented by Q is technical efficient but not allocative efficient. It demands producer to move from Q to Q’ for the cost reduction.
Figure (6) Technical and Allocative efficiencies in the input oriented approach. [27]
AE =OR/OQ (3)
The technical efficiency and the allocative efficiency could be defined jointly as overall efficiency (OE) [27]. Later this term renamed as economic efficiency (EE) in the literature [49]. It is expressed as
OE =EE =T E∗AE =OQ/OP ∗OR/OQ=OR/OP (4)
2.3.2 Output-oriented
The above input-oriented model estimates efficiency with the proportionate decrease of input amounts without altering the output amounts produced. In contrast to this, one can alternatively look into the proportionate increase of output amounts without altering the input amounts utilized. This is called as output-oriented measures and present section illustrates the same.
Here, a production withy1 andy2outputs andxinputs are considered to illustrate
the output-oriented efficiency. Under the constant returns to scale (CRS), the unit production frontier of chosen production is represented by curve EE’ and producer at point A represents an inefficient one which lies below the curve. Applying the Farrell’s principles the same as in the input-oriented case, distance AB marks the inefficiency. The technical efficiency in this case is
Figure (7) Technical and Allocative efficiencies in output oriented approach.[20]
In the event of output-orientation, a producer needs to choose the optimal point to maximize the revenue along with the technically efficient. In this case, output
price shown by line DD’ in Figure 7. The allocative efficiency associated with the
producer at point A is calculated as
AE =OB/OC (6)
The overall efficiency or economic efficiency in the output-oriented case is
OE =EE =T E∗AE =OA/OB∗OB/OC =OA/OC (7)
2.4
Approaches for measuring the efficiency
Efficiency is the best feasible outcome of a decision-making agent by comparing all the perceived outcomes. The input-oriented and output-oriented approaches are explained in subsections 2.3.1 and 2.3.2 which facilitate to calculate technical efficiency and allocative efficiency. Consequently, these two efficiencies can be used to estimate economic efficiency. Calculation of these efficiencies consists of evaluating the concealed production frontier. Further, the efficiency measurement requires a relative comparison of the actual performance of an individual production unit with an optimal performance observed on the appropriate production frontier. This frontier is not an ideal one and varies according to the production units and its associated parameters considered in the study. Since this production frontier is not known, an empirical approximation is required. Thus, an elemental production frontier can be calculated empirically in distinct methods. These empirical methods are parametric and non-parametric. The parametric method follows an economic
model and it’s counterpart non-parametric method follows a mathematical model. These methods use distinct methods to handle the data for enveloping which majorly helps for dealing with random noise and flexibly structuring the production unit. Thus both contradict in several modes but benefits concerning one on another bring out two characteristics [53]:
• Firstly, the econometric approach is stochastic in nature which accounts to
differentiate the noise and inefficiency effects, whereas mathematical approach (precisely linear programming approach) is deterministic in nature and incapable
to factor out the noise and inefficiency.
• Secondly, due to the econometric approach is parametric in nature which
makes the result to suffer from a wrong selection of functional form, whereas programming approach is non-parametric and unsusceptible to functional form. In this section, the prominent and widely used methods that exist in the para-metric procedure (stochastic frontier analysis) and non-parapara-metric procedure (data envelopment analysis) are explained concisely in sub-sections 2.4.1 and 2.4.2.
2.4.1 Stochastic frontier analysis (SFA)
Stochastic frontier analysis (SFA) is one of the frequently used parametric technique. The basis of SFA was developed from the seminal articles of Meeusen and van den Broeck [47] and Aigner, Lovell and Schmidt [8] in the year 1977. Since then, the research in this area have been producing many reformulations and extensions of the original model.
The basic idea of SFA is motivated by the deviation of any firm being studied from the production function frontier. This deviation might not be fully in the firm’s control. For instance, the external factors such as random failure of equipment or extreme weather conditions might lead to the firm’s efficiency understudy in deter-ministic frontier models. Further, any error in the model or its variables measurement including output could also lead to increased inefficiency.
The SFA’s pertinent mathematical formulation is [29]
yi =f(xi)T Eievi (8)
where T Ei is technical efficiency of ith of N firms in a sample of measurements,
vi is statistical noise or measurement error. The below equation is reformulated from
the above by including measurement errors, statistical noise and random variation across all the firms. This equation is the log-linear specification of the stochastic production function.
the performance evaluation of observed input-output bundle vitally influenced by the relevance of the functional form used in the model. The choice of the desired function form is subjective and driven by mathematical easiness and controllability. Moreover, the selection of the half-normal or exponential stochastic distribution depends on analyst preference. In contrast to this, the DEA method is non-parametric needs no parametric production frontier and depends on basic production technology with a few common assumptions. The basic method introduced by Charnes, Cooper, and Rhodes (CCR) in 1978 based on the seminal effort of Farrell [18] and this method further generalized by Banker, Charnes, and Cooper (BCC) in 1984 [11]. It uses observed actual input-output data and the assumptions to deliver an efficiency mea-sure, by which firms efficiencies can be compared.
The transformation of input bundle x into output bundle y of any production
technology represented by production possibility set
P ={(x, y) :yproducedf romx;x≥0;y≥0} (10)
For one output case, for any input bundle x0, f(x0) can produce the maximum
quantity of y and the production function is given as
f(x) =max(y) : (x, y)∈P (11)
In this case, an equivalent production possibility set would be
P ={(x, y) :y ≤f(x);x≥0;y≥0} (12)
This production possibility set able to give the quantities of input and output bundles of the given production technology to be measured. According to the tradi-tional DEA models, all observed production possibilities are feasible. This is one of the fundamental assumptions in these models. Thus, this DEA approach does not permit any statistical noise or error and the proper care needed to select the inputs and outputs and collection of related data.
In this thesis, the DEA method is considered as the main performance assessment method. Hence, this method is explained in detail in chapter 3.
2.5
Performance measurement with non-financial
parame-ters
As discussed in section 2.1, it is necessary to evaluate the performance with opera-tional related characteristics to asses or enhance the operations of any system. These characteristics can be divided broadly into financial characteristics and non-financial characteristics. Particularly, the performance evaluation is complicated due to the problem of selecting the relevant operational characteristics and measurement of these with different scales and units [26]. This problem can be handled by the DEA method as it works on "unit invariance" property. This facilitates or gives freedom to choose the inputs and outputs irrespective of their nature. In general, one believes that the performance of a firm is related to its financial operations. Additionally, this belief strengthens because the literature background of DEA lies on the foundations of economic theory and production theory. Nevertheless, there have been researched studies suggest that non-financial measures also improve the firm’s performance. In this section, such research studies literature has been reviewed because this thesis adopts the non-financial parameters for calculating the MNO’s efficiency in mobile data service perspective. This section broadly divided into three parts.
Firstly, research studies in the view of the importance of measuring the perfor-mance with non-financial measures. Account-based measures have been using to assess the performance of a firm for a long time. But the advent of competitive nature actualities such as quick response to customer expectations, improved customization, flexible to deliverables, quality over price and new manufacturing processes are ques-tioning the adequacy of account-based performance measurement methods [19]. A number of authors highlighted the importance of non-financial elements in the firm’s performance [37], [39], [19], [12]. These elements such as quality of the product or service, user satisfaction, and market share have been using by numerous companies to assess and reward managerial performance [37]. Besides, rewards are connected to future financial performance and this is ignited by innovation, quality and customer satisfaction which are the outcomes of managerial actions [39], [31]. Additionally, customer satisfaction is also notably linked with future financial performance [12].
Secondly, performance measurement using DEA with non-financial measures as inputs and outputs. There have been studies where DEA has employed for finding the efficiency of a firm exclusively using non-financial parameters. The studies are related to varied service industries. Dénes et al. used DEA with non-financial measures for finding the performance of rehabilitation departments and explored operational shortcomings in these departments [26]. The non-financial approach followed in another service industry where the performance of Latin-American airline companies measures [17]. In one more study, authors used the DEA method to find the relation between operational technical efficiency of the US airline industry and its stock market returns, where they used non-account based measures [9]. In the telecommunication industry, the DEA method used with non-financial measures related to mobile ser-vices quality such as faults, success rate, drop rate, delay, complaints, and subscribers.
involved in data services to answer the research question and objectives that are explained in section 1.1. The studies related to the application of DEA method in the telecommunication industry are reviewed in the following section.
2.6
Efficiency studies using DEA in telecommunications
Nowadays, the telecommunication sector has been facing fierce competition with pres-sure from both technical advancements and market competition. For the competitive advantage, finding mobile operators efficiency in the telecommunications market is important. Previous research studies have studied the efficiency of mobile operators in the telecommunication industry by applying DEA method. These studies are focused in different areas such as worldwide, economic group level, regional level and national level.
At worldwide, for instance, in a study, the authors compared the ranking of 39 mobile operators that were listed in the 2003 Forbes list with their productive efficiency scores, where results state that Forbes rankings and productive efficiency rankings of mobile operators are not identical [60]. In another study, the authors attempted to find the managerial performance of 36 global mobile operators. In which, these operators grouped based on the regions and learned that operators in the Asia-pacific and America region did perform inferior to operators in Europe. Moreover, the authors found that state-owned firms operated better than the private telecoms [36]. In one more study, 24 Fortune 500 ranked global telecom operators performance was benchmarked using context-dependent DEA method. In which, operator’s efficiency scores grouped into various stages of efficiency frontier and further investigated the operating performance [44].
Some studies focused on economic group levels such as OECD, APEC, and BRICS. Few studies used OECD published telecommunications data and calculated the efficiency at country level [28], [43]. In one of such study 30 member states data was used and analyzed the performance in four different groups. Eight countries found efficient ones and concluded the results with finding the requirements needed to improve the efficiency of low performed states concerning with the policy implications [28]. In another study, 24 OECD countries data from 1980 to 1995 was used and
found that the competition in the telecommunication industry to be linked with escalated production efficiency [43]. At APEC level, one particular research investi-gated that efficiency improvement influenced heavily by scale and scope economies, whereas market competition and privatization impact on performance was not at a considerable level. In this study, the authors used 24 telecom firms data for the period 1999-2004 in APEC member economies [34]. In some other study, the authors reviewed the performance of 16 major operators in APEC countries. In this study results shown that higher efficiency achieved by the operators with high penetration rate and efficiency is not related to their revenue and policy implications that were discussed in the paper [42]. In another research work, DEA analysis was performed on ten major operators in BRIC nations to find operational efficiency. In which, authors observed full operational efficiencies achieved by few operators irrespective of differences in their revenue scales [41].
At the regional level, in a study, the efficiency of 17 major MNOs in the Asia-Pacific region was appraised, where authors used the efficiency scores to explore the performance of MNOs in relation with fixed-line penetration. Based on this penetration, they categorized firms concerning with their country of operation as mobile jumping and non-mobile jumping countries. Results indicated that operators with lesser fixed-line penetration achieved total asset efficiency than their counter-parts [35]. In another research, the DEA based efficiency analysis considered to inspect the influence of corporate mergers and acquisitions (M&A) on an operator’s performance in the Association of Southeast Asian Nations (ASEAN) countries [54]. In one more study, the benchmark of operators was performed in the European region, in which 19 public telecommunications organizations were considered and explored that operational efficiency can be achieved irrespective to the revenue size [51].
When it comes to the country level, a couple of studies scrutinized the perfor-mance of Indian mobile operators [46], [48]. In the first study, the authors observed that companies with higher operational efficiency and effectiveness of service accom-plished excellent profitability [46]. In the second study, parameters related to the quality of service delivery used and reviewed the performance of Indian operators [48] .
Table 2lists the summary of research works in the telecommunications domain
where the relative efficiency of MNOs was measured. From this, one can observe that most of the studies were based on input-output combinations either exclusive to financial measures or mixed with both financial and non-financial measures. As mentioned in section 2.5, this thesis adopted non-financial parameters to measure the relative performance of mobile operators across the globe. The details are discussed in chapter 4 about input and output selection and its applicability to DEA method.
Employees EBIT A Comparative Study of the
Per-formance Measurement in Global Telecom Operators [36]
CCR,BCC,SE Total assets Revenue
CAPEX EBITDA
Employee EBIT
Net income Comparing operational efficiency
of the main European telecommu-nications organizations:A quanti-tative analysis [51]
BCC Access lines Revenue
Mobile sub. Employees Efficiency of Telecommunication
Companies in ASEAN: Corporate Mergers and Acquisitions [54]
CCR,BCC Current assets Revenue
Fixed assets Efficiency ranking of the OECD
member states in the area of telecommunications:A composite AHP/DEA study [28]
BCC Access lines Subscribers
Staff Revenue
Internet hosts Competition and production
ef-ficiency Telecommunications in OECD countries[43]
CCR,BCC,SE Telephone lines Revenue
Staff Investment Efficiency and Productivity of
Ma-jor Asia-Pacific Telecom Firms [34]
CCR,BCC,SE Fixed assets Fixed-line
revenue
Employees Non-FL
revenue Measuring the technology gap of
APEC integrated telecommunica-tions operators [42]
DEA Employees Revenue
Meta Assets FL sub.
frontier Capital Mobile sub.
BB sub. Benchmarking telecommunication
service in India: An application of data envelopment analysis [48]
CCR,BCC,SE No. of faults Service delay
Call suc. rate Comp./bills
Call drop rate Comp. res.
Voice quality refunds per.
No. of sub. Operational efficiency and service
delivery performance: A compar-ative analysis of Indian telecom service providers [46]
2-stage DEA No. of BTS ARPU
3
Data envelopment analysis
In the previous chapter, the DEA method is briefly introduced along with the fun-damentals of productivity and efficiency which are base for the frontier methods. DEA method is a non-parametric procedure for data fusion. The prime advantage with DEA is that it can easily blend different types of data into the same dimension comparing with other data fusion methods [22]. Non-parametric means that DEA method facilitates data to fit into a functional form without any statistical, unlike its counterpart parametric technique.
DEA is helpful to assess the Decision-making units (DMUs) performance by find-ing the relative efficiency. DMU is any kind of production unit for which efficiency need to be evaluated. DMUs of any type with similar variables can be evaluated. Each DMU with different features can be taken into consideration as long as these features can present numerically. Charnes et al. introduced term DMU in 1978 [18]. For instance, in this thesis DMUs are MNOs and countries.
There is a multitude of DEA models are developed by researchers. In which,
the CCR model1 and the BCC model2 are the two most widely used DEA models.
CCR model works on CRS principle and the BCC model uses VRS principle. In the thesis study, CCR model is adopted for finding the productive efficiency of MNOs. The following sections illustrate how the two available approaches in CCR-DEA model are mathematically structured.
3.1
Input-oriented CCR model
Charnes et al. generalized fundamental productive ratio into multiple inputs and outputs. In which, these inputs and outputs of each DMU formed with the weights
vi and ur to calculate the productivity ratio
ef f iciency= output
input =
u1y10+u2y20+. . .+uqyq0
v1x10+v2x20+. . .+vkxk0
(13)
A DMU’s efficiency achieved as the maximum proportion of weighted outputs to weighted inputs in the CCR model. The calculated ratio of a DMU need to be lesser than or equal to unity and applies to all DMUs in thes study. The optimal weights are obtained from the data and these weights may vary for individual DMU. The above ratio is maximized to determine the weights using fractional programming model
1An original DEA model, abbreviated after authors Charnes, Cooper, and Rhodes
2one of first major extensions to the original DEA model, abbreviated after authors Banker, Charnes, and Cooper
1 q ab pb
va and up are the input and output weights (or) multipliers.
The main objective is to find the weights va and up which maximizes the ratio
for a DMU and constraints helps to keep the ratio not to exceed one. The fractional model (9) can be changed into the linear programming model:
maxh0 = Pqp=1up∗yp0 s.t. Pka=1va∗xa0 = 1 Pq p=1up ∗ypj−Pka=1va∗xab ≤0 b= 1, . . . , l up, va ≥0 p= 1, . . . , q a= 1, . . . , k (15)
The above model is termed a multiplier model and delivers at least one efficient DMU. This model produces a production frontier with a straight line starts from an origin and passes through on all efficient DMUs in case of one input and one output combination. This creates constant returns to scale situation as input proportional change creates the same output proportional change.
The dual model of (10) expressed as:
minθ−Pka=1Sa−−Pqp=1Sp+ s.t. θ∗xao−Plb=1λb∗xab−Sa− = 0 a= 1, . . . , k l X b=1 λb∗ypb−Sp+=yp0 p= 1, . . . , q λb, Sp+, Sa−≥0 b= 1, . . . , l, a= 1, . . . , k, p= 1, . . . , q (16)
From (10), as Sp+ ≥ 0 and Sa− ≥ 0, the first two constraints implicit to Pl
b=1λb.xab ≤ θ.xao and
Pl
b=1λb.ypb ≥ yp0. This show that entire observations
have a large quantity of inputs and small quantity of outputs compared to the
point (Plb=1λb.xab,Plb=1λb.ypb ≥ yp0) on the production frontier. In this scenario,
production frontier envelops all observations. Thus, the model expressed in (11) called as envelopment model.
It is advisable to use dual (envelopment form) model in CCR method [22]. In
DEA, generally, the number of DMUs (l) is higher than the sum of inputs and
outputs (k+q). Thus, the dual form is easier to solve (with k+q constraints) than
the primal (with l constraints). Further, solutions obtained from dual are easy to
interpret than the primal solutions. The results from dual also help the inefficient unit to indicate the improvement options.
In this section, the purpose of the CCR model considered as minimizing the inputs while generating at least required chosen output scales. It is termed an input-oriented model. Next section illustrates an output-oriented CCR model.
3.2
Output-oriented CCR model
The calculation of efficiency from the output side is also possible. This technique is called an output-oriented model. The output-oriented model aims for maximization of outputs by utilizing specific quantities of any observed inputs. The efficiency
represented as a reciprocal of h0. The output fractional programming model is
g0 = min 1 h0 = Pk a=1va∗xa0 Pq p=1up∗yp0 s.t. Pk a=1va∗xab Pq p=1up∗ypb ≥1 b= 1, . . . , l up, va ≥0 p= 1, . . . , q a= 1, . . . , k (17)
The primal from output oriented approach in linear programming model as follows:
ming0 = Pqp=1va∗xa0 s.t. Pqp=1up∗yp0 = 1 Pk a=1va∗xab− Pq p=1up∗ypb ≥0 b= 1, . . . , l up, va ≥0 p= 1, . . . , q a= 1, . . . , k (18)
The constraints in this model depict that it finds for a larger value ofφ to expand
the outputs while keeping inputs at the present position xa0. As explained before,
this is the objective of an output-oriented model.
An output-oriented CCR-DEA model is chosen in the thesis study for assessing the productive efficiency of MNOs based on selected inputs and outputs variables. These inputs and outputs selection process is discussed in section 4.2.
4
Research approach
This chapter explains the steps followed towards conducting the DEA method for the empirical analysis. These steps are described in subsequent subsections. These subsections are followed complete research process, inputs and outputs selection, decision-making units selection, availability and collection of data and software availability. In which, thesis process illustrates the overall research methodology followed for the study and indicates where each process is included in the thesis document. The software availability section gives the gist of available packages and direction towards the employed software package for the study. The other subsections describe the methodological concerns involved in data set creation to do empirical analysis.
4.1
Research process
Research involves the process of gathering, analyzing and evaluating data to solve the study objectives. The research qualification depends on the characteristics associated with the process involved in it. The required characteristics by the process are con-trolled, accurate, methodical, factual and provable, empirical and decisive [40]. Thus, this thesis study is adopted to have all these characteristics in the research process.
Further, this thesis is applied research3 type from the aspect of the application,
whereas, it is a blend of descriptive type4, correlational type5, and explanatory type6
from the aspect of objectives.
The positivist paradigm7 is followed for the study and the research process
fea-tures both evaluative and descriptive characteristics. For the evaluative approach, the research work depends on mainly statistical analysis and production theory principles. Additionally, the Data Envelopment Analysis (DEA) method is utilized to calculate efficiency scores with selected variables for the study and this method is non-parametric. For the descriptive approach, extensive literature is studied for the textual and numerical data.
Figure 8 illustrates the overview of the research process flow followed in this
study. Each step of the process is explained in different chapters of the thesis study and which chapter contains which process is indicated in the flow chart against each process.
3the conclusions for the study being intended to use in grasping certain phenomenon/problem or to change the existing scheme/situation.
4 detailing a condition, circumstance, problem or issue
5Initiating or finding a relationship among two or more variables 6justifying how some things occur the way they do
7a paradigm which emphasizes logical examination through observation, the knowledge gained from human experience, factual information obtained from appropriate measurements, data trans-formed to quantifiable units for empirical analysis, deductive reasoning, causes effects and outcomes, the importance of replication, generalization which is not by chance [21]
DMUs (Countries/ MNOs) selection Performing DEA at MNO level sources Whether data available for all the variables and all the MNOs in a country
(*)
Aggregation of operator level data to obtain
country level data
Envisaging the results
Bivariate analysis (initial data analysis)
Performing DEA at country level
Envisaging the results
Case study between Finland and India
* Where all the MNOs selected in a country holds more than 90% of market share cumulatively DMU (Country/MNO) not
selected for the study Yes No Results Chapter-4 Chapter-5 Chapter-6
Figure (8) Research process followed in the thesis.
4.2
Variables selection
Variables (inputs and outputs) selection is critical for performing DEA analysis. As the prime objective of this study to envisage differences in mobile data services through performance investigation of MNOs, the selection of inputs and outputs
are considered that related to data services delivery. Though many financial and non-financial factors contribute to the performances, this thesis concentrated on accounting the performance view through non-financial measures as discussed earlier. The reasons for this approach are the availability of data in public domain partic-ular to data services provided by mobile operators, lack of studies in performance assessment using non-account-based measures and looking at the latest technology adoption by mobile operators.
The technical variables required for empirical investigation of performances in mobile data services are selected by applying the Maslow’s hierarchy of needs for human growth framework. The basic idea of this framework is that people need to meet the most primitive and basic needs before satisfying their higher needs [45]. For instance, one who cannot have access to basic needs such as food and shelter, friendship and realizing personal potential are irrelevant. Applying this analogy to mobile data services, the technical parameters needed to deliver the facilities from
foundational requirements to higher-level requirements are structured in Figure 9.
Figure (9) Mobile data services driven heirarchy of needs.
The basic requirement for any MNO to provide any service to their customers depends on its spectrum holdings. The roll-out of spectrum allocations is driven by regulators to accommodate the newest mobile communication technologies. At the same time, MNOs are increasing their spectrum holdings to deliver these technologies for market survival and various amenities provision. The advancement in technologies also bringing the challenges to deliver and use the newest mobile broadband data services. However, on the other end, it is also important to use the held spectrum by any MNO effectively and efficiently. These reasons make the spectrum is a fundamental parameter for provisioning data services.
with building additional infrastructure, coverage and efficient spectrum usage. Once the MNO is able to meet the customer appetite to the data needs, it concentrates on the next level of deliverables, which are related to the quality of the services. These deliverables are average downlink and uplink speeds and connection failure rates. In overall, all the factors proceeding from a low level to a higher level of the pyramid are relatable to the mobile data services delivery.
In Figure 9, all the levels are relevant for data delivery to the customers but the
important factors that contribute to the service delivery are spectrum, subscriptions or connections, data capacity, and speed. The other two factors coverage and failure rates, in which coverage pivots on MNOs spectrum licenses and customer penetration in any given geographical location; whereas failure rates are pertaining to the reliable connection delivered to the customers. In addition, most of the MNOs providing above 90% coverage area. Further, it is assumed that all the MNOs delivering 99.999% ("five nines") connection availability. Thus, these two factors are not considered in the study.
Table (3) Summary of selected inputs and outputs.
Inputs Outputs
Number of connections Data volume
Average speed
Spectrum (only for the study in appendixA)
From the four main measures, MNO can deliver data capacity or data volume and average speed to their customers depends on the number of connections in its network and spectrum holdings. The fundamental Shannon principle also supports capacity is directly proportional to the available bandwidth. There are limitations in data availability for the average speed variable. Thus, total data volume delivered to all the connections with using the spectrum available with each operator is the case understudy for the thesis work. In this case, inputs are the number of connections and spectrum; output is data volume and can build 2 input and 1 output DEA model
for MNO’s productive efficiency measurement (shown in Table 3). This study is
The DMUs are discarded form the study for which average speed data is not available. Then the efficiency measurements are done which is discussed in appendix
A. In this, total data volume provided with an average speed provided to all the
connections with using the spectrum available by each operator. In this case, inputs are the number of connections and spectrum; outputs are data volume and average speed; can build 2 input and 2 output DEA model for performance study. The results from this case are not concerned with thesis main results.
4.3
Decision making units selection
Figure (10) ITU region-wise selected countries for the study.
MNOs and countries are decision-making units (DMUs). Many MNOs are not disclosing data regarding total data volumes delivered within their network. This is a key challenge in data collection and restricts the number of MNOs considered, which in turn limits the number of countries for the study. Countries were selected for the study based majorly on the availability of input and output data for all MNOs of that country. All MNOs selected in a country should hold more than 90% of market share cumulatively, which would help us further to examine the differences at the country level. The data available for a limited number of operators in a particular country is not considered in the study, as it would not reflect the efficiency achievement differences at the country level. Besides, the countries with similar financial or social or regulative market conditions would benefit finding the dissimilarities effectively. In view of this, the data collection is prioritized as the countries belong to different economic groups or unions. The priority order to find the data was for all the
Region Countries ITU-1
Austria, Belgium, Czech Republic, Denmark, Finland, France, Germany, Greece, Iceland, Italy, Lithuania, Netherlands, Norway, Poland, Portugal, Russia, South Africa, Spain, Sweden, Turkey, United Kingdom
ITU-2 Argentina
ITU-3 Australia, China, India, Indonesia, Korea, New Zealand
Further, the availability and collection of inputs data and outputs data are discussed in section 4.4.
4.4
Data availability and collection
Data collection is an exercise of arranging and accumulating the data in good order from various sources that have been noted, recorded and organized for a particular purpose. Consequently, the selection of a particular data collection method is regu-lated by the strategy, the type of variables and the source [16]. Accordingly, the data is segregated as primary data and secondary data. The primary data is acquired by experiments, surveys, and research to accomplish an objective of a specific study and which has not been available formerly. Conversely, secondary data is achieved through the use of data partly or fully or which has some relevance for the current study to be carried from the data set that was gathered for separate objectives [33]. Further, data is also divided by its sources viz. external sources and internal sources [14]. In this research, external secondary data have been used for the study. The data availability and its sources for the selected inputs and outputs parameters are discussed here.
The collection of quantitative data is a challenging task for the selected input and output parameters of MNOs under study. The challenge starts from finding the data from each operator’s report and if any particular MNO has not listed all the data for the selected input and output parameters then it needs to look the data from other sources. Various sources are the backbone for the study due to nonavailability of the data from a single source and many MNOs were not disclosed their operational indexes in their reports. These sources range from operator annual
reports to third-party industry analyses. Further, the challenges with data collection, all the terminology used by each source and all the sources used for data collection of each input and output measures are explained in following enumerated sections.
1. Number of connections:
In general, the number of connections means total subscribers or SIMs served by the MNO. However, the term "number of connections" has been used in this study due to embedded SIMs adding to the traditional physical SIMs and number of IoT devices or M2M devices connected to the mobile network along with human subscribers. In addition, majority of MNOs are reporting their customer base with different terms such as number of prepaid customers, number of postpaid customers, business customers or corporate subscriptions, Smartphone customers, M2M connections, cellular IoT connections, active customers and mobile broadband customers. In view of this, the term number of connections keeps the uniformity for all the MNOs in the study. The number of connections equals to cumulative of various types of subscriptions served by the MNO.
The prime sources for the number of connections are:
• Operator reports
• GSMA intelligence data
2. Spectrum:
Various phrases have been using to illustrate a frequency band available for a particular service type, a specific technology or an individual firm. These phrases are allocation, identification, allotment, and assignment. In which, "allocation" is frequency band used for certain type of service by a national regulator, identification is to select which frequency bands compatible for dif-ferent cellular technologies, allotment is frequency channel assigned for specific service under specific conditions and assignment is awarded frequency band to a user or firm by the national regulator [1]. Thus, the data search for spectrum in the sources heavily depended on these phrases. Consequently, the search for data followed as allocation to find mobile service bands, assignment to find bands granted for the 2G, 3G, 4G, and 5G services, assignment to which operators these frequency bands allocated. In consolidate, this approach has given data for the spectrum holdings with each MNO. Further, the mobile spectrum allocated up to 4G services is considered for the study and excluded mobile spectrum used for WiMAX and 5G services.
The spectrum holding data is not available in most of the MNOs annual reports. In view of this, various other sources are looked for the relevant data needed. These sources are:
• European Commissions Office (ECO) Frequency Information System
usage and data usage by active users. However, the availability of data related to data volume or data usage is one of the biggest challenges for the study. Many MNOs are not disclosing this data in their key performance indicators or operational data or annual reports. Thus, many sources have been used for the collection of this data. These sources are:
• Operator reports
• Regulator reports
• GSMA intelligence data
• Tefficient analyses
• Calculations (missing operator’s data calculated by subtracting all other
reported operator’s data from the country’s total data)
Data availability of this variable is a key constraint for the study. Many major countries and major operators are not included in this study due to non-availability of this data either fully or partially. Even though few operators reported the data in particular major country but not included in the study which limits the study to evaluate the efficiency scores at the national level. 4. Average speed:
Average speed is a parameter that represents the data download or upload speed by the customers in a given MNO’s mobile network. Among these two, average download speed is a study of interest in this thesis. Availability of this data with operators is very limited. Most often MNOs depends on third-party measurement services such as Ookla’s speedtest, Opensignal, and Netradar for their service quality performance metric. The approach towards the measurement of average speed by these services is different hence the results are. Therefore, data is collected from only one service i.e. Opensignal to maintain the similarity in the comparison. Additionally, a maximum number of MNOs data is available with Opensignal. However, the average speed is another constraint after the data volume which leads the study to have a major DEA analysis with 2 inputs and 1 output. Consequently, an additional study
is included in appendixA with 2 inputs and 2 outputs DEA analysis with the
4.5
Software availability
A multitude of statistical software packages are available to work on DEA analysis. They are broadly divided into open source and proprietary software packages. Open source software package gives greater flexibility to work on different aspects of analysis without incurring any cost, whereas proprietary packages are limited to the purchased features in the software package. There are studies in which the available DEA software packages and its features are emphasized extensively [13] [25]. Few
important DEA software packages are listed in Table 5. In this thesis study, open
source "rDEA" package in R programming language is used for the empirical analysis
and verified the results with other open source packages listed in Table5.
Table (5) Available software packages for DEA.
Software Type Reference
R
rDEA
Open source Benchmarking
additiveDEA
Python Open source pyDEA
Other
Open Source DEA (http://opensourcedea.org/)
Open source MaxDEA(http://maxdea.com/MaxDEA.htm)
DEAP (https://economics.uq.edu.au/cepa/software)
Other
SAITECH - DEA-Solver(http://opensourcedea.org/) Banxia - Frontier Analyst(https://banxia.com/frontier/)
Proprietary STATA - DEAS
STATA - https://sourceforge.net/projects/deas/ Matlab - DEA Toolbox
Table (6) descriptive statistics of data set.
Variables Obs. Mean Median Std. Dev. Min Max
Connections (in millions) (x1) 94 45.11 10.26 132.86 0.149 1116
Spectrum (in MHz) (x2) 94 159.95 168.8 57.91 47.38 322.6
Data Volume (in PB) (y) 94 1023 244 2181 4.24 15140
Figure11illustrates the correlations between the inputs and output variables.
Un-surprisingly, connections and data volume are strongly positively correlated, whereas spectrum and data volume are very weakly negatively correlated. This suggests that spectrum scarcity might not be a major constraint in increasing data volumes delivered to the customers. 5G literature discusses increasing data volume density by 1000-fold as a key KPI of 5G. However, there is a possibility of increasing the data volumes of current generation mobile networks by using the available spectrum for most of the MNOs.
(a) connections vs data volume (b) spectrum vs data volume
5.2
Efficiency analysis at the operator level
5.2.1 Productive efficiency of MNOsRegarding operator efficiency, Figure12illustrates the efficiency of mobile data service
delivery for the 94 operators ranked by efficiency scores (corresponding production
frontier of this is shown in appendixB). Two operators, DNA (Finland) and Reliance
Jio (India) are fully efficient. A further case study of these two operators and their dissimilar reasons for high efficiency is detailed in section 4.4. Also, notably, CK Hutchinson’s Three brand is very efficient in most of their countries of operation (e.g. Austria, United Kingdom, Denmark and Sweden). Therefore, illustrating that even
big telecom groups can be widely efficient. Figure 13 details efficiency of operators
with the addition of a market share curve and ranked first by country of operation and then by descending order of market share. Interestingly, CK Hutchinson’s Three brand also shows low market share in many of their markets. Thus, their efficiency may be driven by their status as upstart operators.
Figure (12) Productive efficiency scores of MNOs (in descending order).
Furthermore, in many countries, a single operator dominates in terms of efficiency the other operators in the same country; this phenomenon is discussed further in section 4.2.2. Though, in several cases, the operators of a single country are about equally efficient (e.g. Argentina, Belgium, China, Czech, Greece, Italy, Lithuania, New Zealand, and Russia). This scenario is hypothesized that this behavior may be due to strong regulatory policies.
5.2.2 Efficiency vs market share
It is observed that several cases where one MNO dominates in data service efficiency in comparison to the counterparts from the same country. In order to explain this behavior, market share has taken as an alternative per