Dissecting Moneyball: Improving Classification Model Interpretability in
Baseball Pitch Prediction
Kevin Hickey Fairfield University Fairfield, CT, USA, 06824 [email protected] Lina Zhou The University of North
Carolina at Charlotte Charlotte, NC, USA, 28223 [email protected] Jie Tao Fairfield University Fairfield, CT, USA, 06824 [email protected]
Abstract
Data science, where technical expertise meets do-main knowledge, is collaborative by nature. Complex machine learning models have achieved human-level performance in many areas, yet they face adoption chal-lenges in practice due to limited interpretability of model outputs, particularly for users who lack special-ized technical knowledge. One key question is how to unpack complex classification models by enhancing their interpretability to facilitate collaboration in data science research and application. In this study, we ex-tend two state-of-the-art methods for drawing fine-grained explanations from the results of classification models. The main extensions include aggregating expla-nations from individual instances to a user-defined ag-gregation level, and providing explanations with the original features rather than engineered representa-tions. We use the prediction of baseball pitch outcome as a case to evaluate our extended methods. The exper-iment results of the methods with real sensor data demonstrate their improved interpretability while pre-serving superior prediction performance.
1. Introduction
Data science is essentially a confluence of technical and human forms of work. Real-world data science teams are collaborative yet heterogeneous by nature [1]. Central to the collaborative work is trust. Despite the fact that data scientists may have the necessary expertise to juggle between technical skills and domain knowledge, the complex nature of state-of-the-art mod-els makes it hard for data scientists to interpret analytical results, or provide a clear explanation that is applicable to respective domains. As a result, these complex mod-els are faced with trust and acceptance challenges from end-users who likely lack specialized data science knowledge.
As part of the efforts in increasing human trust and acceptance of complex models, the interpretability of
classification results has been gaining increasing ground in both research and practices, particularly in areas that hold high stakes, such as the finance and medicine. The expectations for interpretability of classification results is heightened when the users require explicit and action-able explanations in order to accept models, when regu-lations require unambiguous explanations or rationales behind the decisions, and when the insights are used to support new scientific theory and hypothesis develop-ments [2]. However, research of classification models has predominantly focused on improving model perfor-mances (i.e. accuracy). This has motivated the develop-ment of complex models such as neural networks and ensemble models, which have achieved near human-level performances in some applications. However, these models are generally considered as black-boxes that are hard to interpret by humans. They manifest the traditional accuracy-interpretability trade-off in devel-oping classification models. In other words, models that lead to relatively highperformance are more difficult to interpret. Therefore, one key question is whether we can improve model interpretability without negatively af-fecting its performance. In this research, we aim to an-swer the research question of unwrapping algorithmic black-boxes by using baseball strike prediction as a case study.
Significant progresses have been made in increasing the interpretability of complex classification models. One common approach is to provide not only tion results but also some of the logic of this classifica-tion [3]. Specifically, researchers have looked into the metrics for model interpretability such as model com-plexity, and the extraction of comprehensible classifica-tion results (e.g. rule sets or decision trees) from the black-box models or from the complex models produced by ensembles of classifiers [2]. On the other hand, there are counterarguments that simpler models are not nec-essarily more interpretable mainly because they contain fewer informative attributes for users to make sense of. Thus, compared with complex models, the monotonicity Proceedings of the 53rd Hawaii International Conference on System Sciences | 2020
constraints provided by the user or experts in the appli-cation domain are better metrics of model interpretabil-ity [2].
In this study, we extend the state-of-the-art methods for interpreting classification models, namely Local In-terpretable Model-agnostic Explanations (LIME) and SHapley Additive exPlanations (SHAP), by introducing new analytical capabilities to enhance their interpreta-bility for addressing a real-world problem. Major exten-sions include aggregating explanations from the level of individual instances to a user-defined aggregation level to better support decision making, and providing expla-nations with the original features rather than their de-rived complex representations (e.g. engineered features). We design an experiment using sensor data to predict baseball pitch outcomes. The experiment results demon-strate the improved interpretability and sustained supe-rior prediction performances of complex models.
2. Model Interpretability
In this section, we discuss the complexity-interpret-ability trade-off and the motivations for improving model interpretability, and review state-of-the-art meth-ods for model interpretability.
2.1. Complexity-Interpretability Trade-off With increasing rich datasets being collected for analysis in various domains, extracting (implicit) pat-terns from such datasets becomes more difficult. Tradi-tional machine learning techniques (e.g. regression models, decision trees) are no longer sufficient for such tasks. More advanced modeling techniques (e.g. random forest and deep neural networks [4]) are developed to extract complex patterns (e.g. non-linear patterns) from the datasets. Although more complex models have been trained for better performances with complex datasets, increased model complexity has led to the issue of a de-crease in model interpretability. It is believed that some traditional machine learning models yield predictive sults with better explanatory power. For instance, in re-gression models, the coefficients can be used to interpret the effects of input features; and rules can be generated from decision trees to support decision making. Never-theless, when bagging simple decision trees into random forests, or boosting them with extreme gradient boosting (XGBoost), the interpretability superiority gets lost.
The declined model interpretability has led to sev-eral issues. First, the ignorance of why certain decision is made diminishes the decision support role of machine learning models. Real-world data science projects re-quire collaboration and communication among people with diverse domain expertise, who may range from
business managers through machine learning special-ists/engineers, social scientists, to end users. In addition, the role of data scientists is reflected in their orientation toward solving business and societal problems using machine learning techniques. The interdisciplinary na-ture of data science research and practice naturally de-mands the methods to facilitate user interactions with the models (i.e. classifiers) as well as their results [5]. Second, limited model interpretability, often termed as black-box models, faces the challenges of gaining trust and acceptance from users. Users (i.e. analysts) trust models/results that explanations can be drawn from, sometimes regardless of their predictive performances [6]. Third, lack of interpretability goes against the prin-ciple of ease-of-use —an important success factor of any system design. One of the key indicators of ease-of-use in machine learning models is the interpretability of predictive results. Thus, increased model interpretabil-ity is crucial for the successful design of any machine learning models [5].
2.2. Model Agnostic Interpretability
In view of the diverse representations of various classification models, there are model level interpreta-bility and more generic interpretainterpreta-bility issues. One ap-proach to enhancing machine learning model interpret-ability is to treat original models as black-boxes and draw post hoc explanations from the analytical results by learning explanation models (models used to provide interpretability to the complex counterparts) based on the model results; for instance, we can perturb inputs features to investigate how the black-box model behaves – this approach is termed as model agnostic [7]. One scenario is that human analysts have difficulty in com-prehending a model globally if the model structure is very complex. For instance, a large vocabulary size of the text data (i.e. high dimensionality of input data) used to train a sentiment classifier may lead to a com-plex model. Thus, it is desired to separate the model from its interpretability, in order to preserve its flexibil-ity [8]. Another scenario is that analysts may focus on either the positive (which feature/instances contributes most) or the negative (which feature/instances contrib-utes least) evidences in the prediction. In other cases, analysts need finer-grained information with respect to how different feature values may lead to different model behaviors.
Model interpretability may appear in different forms (e.g. linear models, rules, graphs), and an approach should, accordingly, support as many forms as possible [7]. Regardless of the specific explanation form, an ex-planation (model) should possess fidelity to the black-box model – meaning that the prediction from the expla-nation model should be (to some extent) consistent with
the original complex model. Since it is very difficult to obtain global fidelity (the explanation model can mimic all the behaviors of a black-box model across the da-taset), researchers have instead aimed at achieving local fidelity (behaviors from the explanatory models and the black-box models are consistent at some of the in-stances). Additionally, it is increasingly recognized that using evaluation metrics (or similarly, loss functions) as the only criteria to compare models, in contrast to incor-porating interpretability metrics, has limited applicabil-ity [9]. One approach that tackles model agnostic inter-pretability is LIME [7]. This approach possesses several interesting characteristics, including interpretable data representation, fidelity-interpretability trade-off, sam-pling for local exploration, and sparse linear explana-tions.
2.3. Instance-wise Feature Importance Scoring As discussed in Section 2.1, machine learning mod-els generally compromise interpretability with emphasis on performances enabled by increased complexity. As a result, feature ranking (and selection) has become one of the most important tasks in machine learning [10]. Features are ranked by their importance to the predic-tions (known as feature importance scoring). Feature importance scoring methods can be roughly categorized into two groups, namely global and instance-wise fea-ture importance scoring. Global feafea-ture importance scoring measures feature contributions to the prediction based on the overall dataset, which is often used for ture selection purposes. In contrast, instance-wise fea-ture importance scoring measures the relative im-portance of all input features for a given instance in the dataset. The scoring method often yield a vector of im-portance scores, associated with all the features [11]. Although the best explanation of a model, or its results, is the model itself, the original models in case of in com-plex models are deemed not as useful as the best expla-nations due to their lower interpretability. Thus, a sim-pler surrogate model that approximates the original model needs to be defined (e.g. a surrogate decision tree model for the original random forest model).
In complex models, where the feature space is often too complex to learn, it is impossible to define the rela-tionship between features and the predictive results. Ad-vanced approaches (i.e. Monte Carlo approximation [9] or nanograms [12]) have been used to search for the op-timal values defining such relationships. Recently, co-operative game theory has been used in the context of instance-wise feature importance scoring, in which each feature serves as a player in the game. The latest devel-opment in this category is SHAP, which aims to assign importance scores to individual features for each predic-tion/instance [13]. Compared to previous instance-wise
feature importance scoring methods, SHAP possesses unique properties such as local accuracy (the explana-tion model matches the original model for a given in-stance), missingness (if a feature has no impact in the original model, it should not have any impact in the ex-planation model), and consistency (feature contributions should be consistent in both of the original and explana-tion models).
3. Methods and Results
To evaluate the proposed methods for improving model interpretability, we design an experiment to pre-dict the output of baseball pitches (i.e. ball or strike). 3.1. Proposed Methods
In real-world decision making processes, investigat-ing the impact of individual features may not be as use-ful – due to the complexity of the decision problem, it might be more interesting and useful to examine the in-teractions between features and their combined impacts on the predictions. Users of classification models may prefer explanations of results at a finer granularity rather than at a global level to better inform the course of ac-tion. In case of baseball, practitioners may want expla-nations for individual instances (e.g. pitches). While collaborating with domain experts in collecting require-ments for meaningful explanations, they suggest that drawing explanations from individual features may not be very useful but it is necessary to investigate the inter-action(s) among different features. To this end, we ex-tend LIME [7] and SHAP [13] in two important aspects:
• The original LIME and SHAP provide instance-wise explanations. In view of the size of modern datasets and explanation generality, it can be more efficient and valuable to group similar instances and provide explanations at a group level (e.g. pitches from certain pitcher, a specific type of pitch).
• Although including engineered features (e.g. posi-tion_x, position_z) may improve prediction perfor-mance, they would not be useful to the end users because those features cannot be directly measured in the field. Thus, we extend LIME and SHAP by drawing explanations from the original rather than the engineered features.
Despite two illustrations that demonstrat the appli-cation of LIME [7], there are a few extensions deemed necessary for LIME. For instance, in terms of interpret-able data representation, the explanation should be interpret-able to penetrate any representation of the features. If there is any engineered features used in the black-box model, the explanation should be reflected upon the original
features, so that practitioners can better use these expla-nations in their practices. For instance, in the context of text analytics, if the text is represented in word embed-ding models, the explanations should be provided on the original words instead of the word embeddings. In addi-tion, linear explanation may be inadequate or not action-able in some contexts. Other forms of explanations, such as decision rules, may become more useful in these sce-narios. Additionally, in addition to the instance-wise feature importance scoring, it is important to generalize the interpretation from individual instances, possibly to a group of instances. This can help achieve consistency across similar instances.
3.2. Analytical Problem and Data
We use the prediction of the baseball pitch outcome as a case study to evaluate the performance and inter-pretability of the proposed methods. A pitch is the pitcher throwing a baseball toward the home plate. A called strike (strike) is when a pitch is in the strike zone, or the hitter swings the bat at the pitch and misses; while a called ball (ball) is a pitch outside of the strike zone and the hitter does not swing1. Predicting the outcome of a pitch can help baseball coaches, players, teams, and analysts in identifying areas of improvement or develop counter-strategies. In essence, the prediction of baseball pitch is a binary classification problem. Previous studies have analyzed whether historical pitches would indicate the type of a future pitch [14], [15].
We programmatically collect the data from the StatCast system2
,
which is an analytical platform that uses arrays and sensors placed in all 30 Major League Baseball (MLB) stadiums to track and quantify meas-urements regarding various aspects of a baseball game, including pitching measurements, hitting measure-ments, and so forth. We randomly select the pitch data of 350 pitches from the top 400 pitchers (in number of pitches) in the 2018 season of the MLB league (a total of 140,000 pitches). Since sensory data is difficult to im-pute, we exclude instances that contain any missing value. Finally, our dataset consists of 126,486 instances.We collect 18 sensory features, along with the name of the pitcher, and the outcome of the pitch. Given that our goal is to predict the outcome of the current pitch, we filtered the features based on their relevance and availability. In addition, we removed 4 features that are strongly correlated with other features, and engineered 2 new features from those 4 features. The following is a final list of input features and prediction target.
1
https://www.umpirebible.com/files/Osborne02.pdf
• position_z: a pitch’sending vertical position – calculated using the vertical release position and the vertical movement from the catcher’s perspec-tive;
• position_x: a pitch’sending horizontal position – calculated using the horizontal release position and the horizontal movement from the catcher’s perspective;
• p_throws: hand with which the pitch is thrown (left/right);
• vx0: horizontal velocity (ft/sec) of the pitch, deter-mined at y=50 feet;
• vy0: velocity (ft/sec) of the pitch in the direction toward the catcher, determined at y=50 feet; • vz0: vertical velocity (ft/sec) of the pitch,
deter-mined at y=50 feet;
• release_spin_rate: spin rate of the pitch;
• pitch_name: pitch type such as four-seam fastball and curve ball.
• sz_top: top of the strike zone when the ball is halfway to the plate;
• sz_bot: bottom of the strike zone when the ball is halfway to the plate;
• player_name: the name of the pitcher; • outcome: resulting pitch (1 = strike, 0 = ball)).
The data is imbalanced, with a distribution ratio of roughly 1:2 between strike and ball. Thus, we performed random under-sampling on the ball pitches. The results of correlation analysis show that the selected feature are strongly correlated with the target variable.
3.3. Classification Models and Results
We implemented two categories of classification techniques in this study: traditional (baseline) models such as logistic regression (LR) and decision tree (DT), and complex models such as random forest (RF) and XGBoost (XG). Decision trees, classification rules or decision tables tend to be higher in interpretability than mathematical equations (cf. [2]), and thus we choose DT as one of the baseline method in this study. On the other hand, the complex models are capable of capturing com-plex (e.g. non-linear) patterns in the data at the cost of interpretability. The data did not go through traditional preprocessing steps (e.g. scaling, skewness handling) except for one-hot encoding on the categorical features (pitch_name, p_throws) due to concerns about the pos-sibly negative impacts of those steps on the interpreta-bility of the prediction results.
All the models included in this study were evaluated with a 5-fold cross-validation. In addition, the random search method was employed to search for the optimal hyperparameters in all the models. The evaluation met-rics include binary cross-entropy accuracy (ACC), Area Under Receiver Operating Characteristics Curve (AUC), and F1-score. AUC values range from 0 to 1 [16]. It represents random guessing when AUC = 0.5; and perfect prediction while AUC = 1. F1-score is a har-monic mean of precision and recall. To validate the re-sults interpretations derived from the models, we con-sulted domain experts.
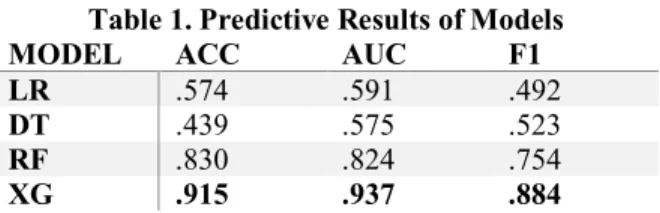
The predictive results of all models are reported in Table 1. The highest value for each evaluation metric is marked in bold face. The result show that the advanced modeling techniques (RF, XG) outperforms traditional machine learning techniques (LR, DT) in the predictive power. Particularly, the XGBoost model (XG) outper-forms all other models in accuracy (.915), AUC (.937), and F1-score (.884).
Table 1. Predictive Results of Models
MODEL ACC AUC F1
LR .574 .591 .492
DT .439 .575 .523
RF .830 .824 .754
XG .915 .937 .884
3.4. Results Interpretation of Baseline Methods As discussed in Section 2.1, baseline mdoels (LR & DT) possess better interpretability in the predictive re-sults. For instance, in the LR model, the signages of the coefficients in the trained model indicate whether a fea-ture positively or negatively impacts the prediction. We report the signages of coefficients in the trained LR model (see Table 2). In Table 2, the top-3 features that are positively correlated with the strike are: sz_top (.64), pitch_Sinker (+.53), and pitch_2-seam_fastball (+.41), which indicate that the top of the strike zone, as well as two variants of the fast ball pitches (Sinker and 2-Seam Fastball) would increase the likelihood of throwing a strike. On the contrary, the top-3 features that are nega-tively correlated with the strike are: sz_bot (-1.2), pitch_Split_Finger (-.63), and pitch_ChangeUp (-.49), increase the likelihood of throwing a ball. The domain experts verified the above explanations. They confirm that pitchers typically have a better control of a fastball or its variants, rather than an off-speed pitch (i.e. Change-up, Split-Finger); thus, the latter decreases the likelihood of a strike. Additionally, the results also sug-gest that the thresholds of the strike zone also contribute to the likelihood of throwing a strike: if the top of the strike zone (sz_top) is higher, and the bottom of the strike zone (sz_bot) is lower (the batter has a larger
zone), it reduces the chance of a pitch resulting outside of the zone (which is automatically a ball).
Table 2. Coefficients in the Trained LR Model
FEATURE COEFFICIENTS position_x -.04 position_z +.27 release_spin_rate +.00 sz_top +.64 sz_bot -1.2 p_throws_l -.06 p_throws_r +.08 vx0 -.02 vy0 +.02 vz0 +.08 pitch_2-seam_fastball +.41 pitch_4-seam_fastball +.35 pitch_changeup -.49 pitch_curveball -.10 pitch_cutter +.06 pitch_sinker +.53 pitch_slider -.10 pitch_split_finger -.63
The results suggest that the result explanations from the traditional models (i.e. LR and DT) have high pre-dictive power. Despite that the advanced, high perfor-mance models and the traditional, high interpretability models share common explanations , there are some no-ticeable differences between their explanations. For in-stance, the feature release_spin_rate is ranked slightly higher in the advanced than the traditional models, but none of the pitch types received high rankings in LR & DT models. Under these circumstances, it is difficult for practitioners (e.g. analysts) to determine which group of models to trust in their practices.
The explanations for Decision Tree (DT) results can come in two forms: decision rules and feature im-portance scoring. In order to maintain the readability of the tree structure, we limit the depth of the tree to 4. Based on the domain experts‘ review of the decision rules generated by DT, and the feature importance scor-ing, we selected a few informative rules. Two sample rules are listed in the following:
• If a pitch is not moving downward at 8.955 ft/sec and is not a type of Change-up, it is a strike;
• If the lateral movement of a pitch is below 9.23 ft/sec to the right in the catcher’s perspective, it is a strike.
Compared with other models, the DT model per-formed better in predicting ball (the negative class) than strike (the positive class). In contrast, the RF and XG models are more accurate in predicting the target variable. Since they are both decision tree
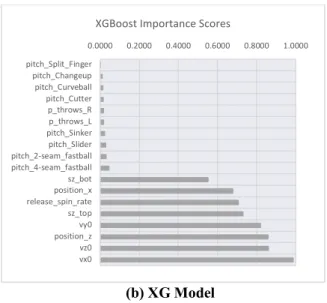
based approaches, so we extract their feature im-portance scoring from them separately (see Figure 1).
(a) RF Model Figure 1. Feature Importance Scoring (b) XG Model
We make some interesting observations from the figure. Firstly, the vertical speed of the pitch (vz0) re-mains is one of the top features in the prediction, and the horizontal speed (vx0) is ranked among the top by both RF and XG. Secondly, consistent with the LR and DT models, the final positions of the pitch (position_x and position_z) are ranked high by both of the complex mod-els. Similar to the results of LR, the measurements of the strike zone (sz_top and sz_bot) are selected as important features by both RF and XG models.
Figure 2. LIME Results of an Individual Pitch
3.5 Results Interpretation of Our Extended Methods
We report the results of our extended LIME method from our best performing XGBoost model for individual pitches in Figure 2. For the sake of space, we randomly select one instance from the top ranked predictions (in
terms of accuracy) and interpret its results. Figure 2 shows that the XG model is 93% confident that the spe-cific pitch is a strike; and the top contributing feature to this prediction (right part of the figure) include the re-leasing lateral speed (vx0), ending horizontal position (position_x), and whether this pitch a Curve Ball is not. We can draw the following sample decision rules from the figure: 0.0000 0.2000 0.4000 0.6000 0.8000 1.0000 pitch_Split_Finger pitch_Changeup pitch_Curveball pitch_Cutter p_throws_R p_throws_L pitch_Sinker pitch_Slider pitch_2-seam_fastball pitch_4-seam_fastball sz_bot position_x release_spin_rate sz_top vy0 position_z vz0 vx0
XGBoost Importance Scores
0.01 0.01 0.02 0.02 0.02 0.02 0.02 0.03 0.12 0.0 < pitch_R <= 1 pitch_Slider <= 0 pitch_Curveball <= 0 position_z > 7.21… -6.75 < vz0 <= -4.48 pitch_Split Finger <= 0 pitch_2-Seam Fastball <= 0 position_x <= -2.79 4.13 < vx0 < 7.07 Fea tu re Ball (0.07) Strike (0.93)
• If a right-handed pitcher throws a pitch that is not a 2-seam fastball, a curveball, or a slider, the pitcher controls the lateral speed (at 50 feet from the releasing point) in the range of between 7.07 ft/sec and 4.13 ft/sec to the right, and the vertical speed is between 4.48 and 6.75 ft/sec downwards, then it increases the likelihood of the pitching end-ing up beend-ing a strike.
• If the ending horizontal position is more than 2.79 ft. to the left (against the center of the strike zone), then it decreases the likelihood of the pitching end-ing up beend-ing a strike.
Figure 3. SHAP Results of an Individual Pitch
Subsequently, we reverse-engineered the feature po-sition_x: if the release position is 3 ft. to the left of the pitcher, then the lateral movement between the release and the home plate should be less than 0.21 ft.
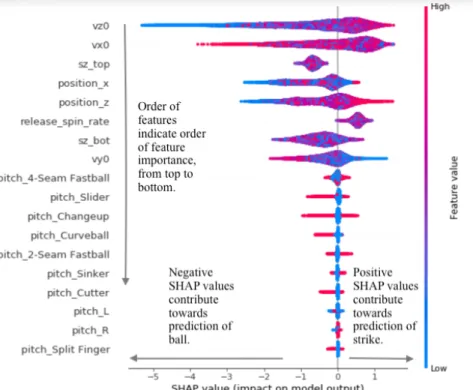
We report the results of the extended SHAP method for individual pitches from our best performing XG model in Figure 3. In the figure, for a particular pitch resulting in strike, features shown in blue contribute negatively to the prediction, where the magnitudes of the impact is expressed in the length of the bar, meaning the particular values of features such as ending horizon-tal position (position_x), vertical speed (vz0), and strike zone top (sz_top) and bottom (sz_bot) decrease the like-lihood of the pitch being a strike. Thus, the SHAP re-sults can be used to assess the global (dataset level) fea-ture importance scoring. The more instance-wise feafea-ture importance scoring is aligned with the global feature im-portance scoring, the more consistent and reliable is the model.
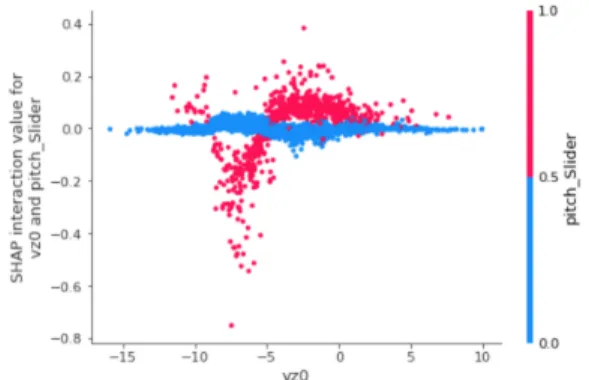
We also analyzed the pairwise feature interaction, and their effects on prediction results. For example, the effects of interaction between the vertical speed (vz0) and a specific type of pitch (Slider) are plotted in Figure 4. A slider is a particular type of pitch that breaks down-ward along the trajectory. For instance, if the speed of the pitch moving downward is faster than 5 ft/sec at the point of 50 ft. away from the catcher on the pitch trajec-tory, there is a higher likelihood that the pitch results in a ball. Additionally, if the vertical speed (vz0) lies in the range between both 2.5 ft/sec downwards and 2.5ft/sec upwards, the likelihood of a pitch resulting in as a strike increases (peaking at approximately 0 ft/sec). This ob-servation makes sense even with the basic knowledge
3 Due to the computational complexity, we randomly sample
5,000 pitches from the analysis data.
about baseball: for a Slider pitch, the vertical speed should be in a certain range so that the pitch can land in the strike zone.
Figure 4. Pairwise Feature Interaction Analysis3
We can also observe from Figure 4 that the interac-tions between these two features are non-linear. The fea-ture importance scoring from the XG model after con-sidering the interactions between features is shown in Figure 5. A comparison between Figure 5 and Figure 1(c) shows that, regardless of feature interaction, some features (e.g. vz0, vx0) consistently demonstrate their importance for making predictions. Figure 5 also shows how an individual feature, in combination of all other features, impacts the prediction. For instance, the lower the vertical speed (vz0) is, the lower likelihood a pitch results in a strike. The observations provide evidence for increased generalizability in terms of explanations of high quality predictive results.
Features in red contribute to prediction of strike.
Features in blue contribute to prediction of ball.
Length of horizontal bar indicates magnitude of contribution towards particular predicted class.
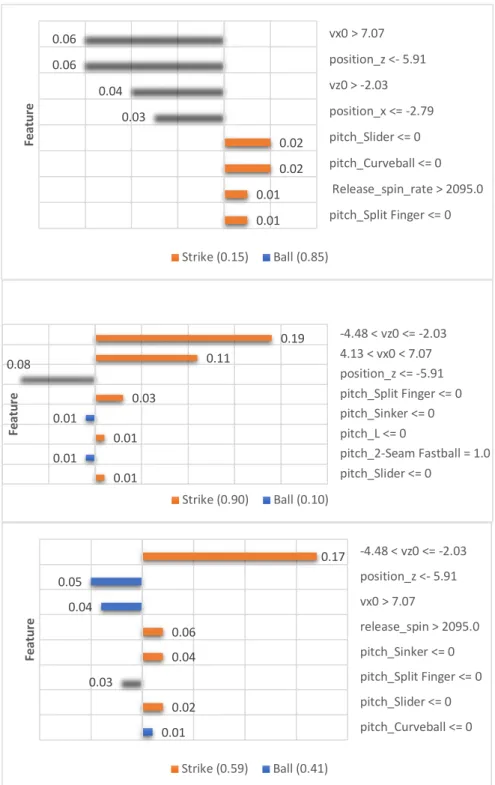
To demonstrate our extension of SHAP to a user-de-fined aggregation level, we select a specific pitcher (pseudo name: AN), and then analyze 3 randomly se-lected fastball pitches of 2 types each (2 4-Seam Fast-balls and 2 2-Seam Fastballs), . Our method is able to capture some subtle differences between the 2 fastball types (see Figure 6). Specifically, the XG model is highly confident (>.85) about the first 2 predictions. The first prediction is a ball, and the combination of the re-lease vertical position (position_z <= 5.91) and the hor-izontal speed (vx0 > 7.07) are strong indicators of the prediction. The next two predictions are strikes: com-pared to the first prediction, the main difference lies in the vertical (vz0) and horizontal (vx0) speed. Because of the high confidence in these predictions, the thresholds
of {vz0: -2.03 ft/sec; vx0: 7.07 ft/sec} can be used as a guide in pitcher training/coaching. Additionally, we se-lect a misclassified prediction in which the model learns contradicting patterns from the top-3 important features: the top feature (vz0) shows a strong impact on predicting a strike; whereas the next two top features show strong indications toward prediction a ball. This finding con-firms that complex machine learning models (e.g. XGBoost) are able to learn patterns from feature inter-actions. Furthermore, we observe that between predic-tion 2 and predicpredic-tion 3, the values of vx0 lie on both sides of the threshold, which provides evidence that the XG model is capable of capturing the differences be-tween different types of fastballs.
Figure 5. Importance Scoring for Feature Interaction based on XG Model Results
4. Discussions
Although we can directly draw explanations (in dif-ferent forms) from the predictive results of the LR and DT models, their performances are inferior to complex models (i.e. RF, XG) in terms of the predictive power. As a result, users or analysts may not accept the results from traditional baseline models (i.e. LR, DT) due to their poor performances. Complex models like RF and XG are able to achieve better performance at the cost of interpretability. In addition, the interpretability of the traditional models (e.g. LR, DT) above are limited to the global level. In other words, the influences of features
on the model results are interpretable from a general, holistic perspective of all instances of a dataset, but are not interpretable on specific, individual instances. Fur-thermore, we present interpretation of results in decision rules, which are actionable to support domain-specific decisions.
This research contributes to the data science research and practice in multiple aspects. Firstly, it provides new evidences that interpretability methods, specifically LIME and SHAP, can help unpack complex, black-box models. Secondly, it extends the above methods by troducing new analytical capabilities to enhance their in-terpretability for addressing a real-world problem. The main extensions include aggregating explanations from the level of individual instance to a user-defined group
level to better support decision making and providing explanations to the original features rather than their de-rived complex representations (e.g. engineered features). Thirdly, this study represents the first effort in predict-ing the outcome of the current pitch by employpredict-ing sen-sory data from stadiums. While investigating the inter-pretability of prediction results, we not only discovered
finer-grained representations of interpretations, but also validated the explanations with domain experts. The ex-planations drawn from the results of the current study can be directly used to inform baseball coaching and training, which in turn augment human trust in the pre-diction results of complex models.
Figure 6. Aggregated LIME Interpretation at Pitcher Level
0.01 0.01 0.02 0.02 0.03 0.04 0.06 0.06 pitch_Split Finger <= 0 Release_spin_rate > 2095.0 pitch_Curveball <= 0 pitch_Slider <= 0 position_x <= -2.79 vz0 > -2.03 position_z <- 5.91 vx0 > 7.07 Fea tu re Strike (0.15) Ball (0.85) 0.01 0.01 0.01 0.01 0.03 0.08 0.11 0.19 pitch_Slider <= 0 pitch_2-Seam Fastball = 1.0 pitch_L <= 0 pitch_Sinker <= 0 pitch_Split Finger <= 0 position_z <= -5.91 4.13 < vx0 < 7.07 -4.48 < vz0 <= -2.03 Fea tu re Strike (0.90) Ball (0.10) 0.01 0.02 0.03 0.04 0.06 0.04 0.05 0.17 pitch_Curveball <= 0 pitch_Slider <= 0 pitch_Split Finger <= 0 pitch_Sinker <= 0 release_spin > 2095.0 vx0 > 7.07 position_z <- 5.91 -4.48 < vz0 <= -2.03 Fea tu re Strike (0.59) Ball (0.41)
We also learned a few lessons from applying LIME and SHAP on the predictive results, which offers rec-ommendations for future analyses. Firstly, in addition to interpretability methods, LIME/SHAP can also be used to support prescriptive and diagnostic analyses. For the prescriptive purposes, LIME/SHAP provide the means for the analysts to gauge how models be-have. In other words, LIME/SHAP show light on not only (complex) patterns embedded in the data, but also how a model makes predictions (i.e. what combina-tion/interaction of features informed the prediction). This is particularly useful for designing new algo-rithms, or tuning a trained model for better perfor-mances. For diagnostic purposes, LIME/SHAP can help analysts identify condition(s) that might lead to misclassifications. Secondly, speaking from our own experiences, SHAP is computationally more expen-sive when compared with LIME; thus, it is deemed necessary to develop new approaches to optimizing the search for optimal SHAP values for the features (e.g. [11]) . Last but not the least, in the context of the baseball pitch prediction, SHAP appears to be superior to LIME in terms of interpretability. For instance, SHAP provides support at both instance and the over-all dataset level, and provides support for understand-ing the interaction(s) between a specific pair of fea-tures.
5. Conclusion
As machine learning models grow more complex, effective communication of the (prediction) results of these models is being recognized as one of the most important factors in gaining trust from analysts/end us-ers in the data science field. In this study, we propose extensions to the state-of-the-art interpretability meth-ods, namely LIME and SHAP, by equipping them with the abilities to provide explanations on the original features, and aggregate explanations at the user-de-fined decision levels. The results of our empirical eval-uations with the prediction of baseball pitch outcomes demonstrate enhanced interpretability of the extended approaches.
6. References
[1] S. Passi and S. J. Jackson, “Trust in Data Science: Col-laboration, Translation, and Accountability in Corporate Data Science Projects,” in In Proceedings of the ACM on Human-Computer Interaction, 2018, vol. 2, no. CSCW, Ar-ticle 136, pp. 136:2-136:28.
[2] A. A. Freitas, “Comprehensible Classification Models - a position paper,” SigKDD Explorations, vol. 15, no. 1, pp. 1–10, 2014.
[3] J. Burrell, “How the Machine ‘Thinks:’ Understanding Opacity in Machine Learning Algorithms,” Big Data & So-ciety, no. Janurary-June, pp. 1–12, 2016.
[4] C. Krauss, X. Anh, and N. Huck, “Deep neural networks , gradient-boosted trees , random forests : Statistical arbi-trage on the S&P 500,” European Journal of Operational Re-search, vol. 259, no. 2, pp. 689–702, 2017.
[5] L. Zhou, S. Pan, J. Wang, and A. V. Vasilakos, “Machine learning on big data: Opportunities and challenges,” Neuro-computing, vol. 237, no. December 2016, pp. 350–361, 2017.
[6] R. Piltaver, M. Luštrek, M. Gams, and S. Martinčić-Ipšić, “What makes classification trees comprehensible?,” Expert Systems with Applications, vol. 62, pp. 333–346, 2016. [7] M. T. Ribeiro, S. Singh, and C. Guestrin, “‘Why Should I Trust You?’ Explaining the Predictions of Any Classifier,” in Proceedings of the 22nd ACM SIGKDD International Conference on Knowledge Discovery and Data Mining - KDD ’16, 2016, pp. 1135–1144.
[8] G. Shmueli and O. R. Koppius, “Predictive Analytics in Information Systems in Research,” MIS Quarterly, vol. 35, no. 3, pp. 553–572, 2011.
[9] E. Štrumbelj and I. Kononenko, “An Efficient Explana-tion of Individual ClassificaExplana-tions using Game Theory,” Jour-nal of Machine Learning Research, vol. 11, pp. 1–18, 2010. [10] A. Razmjoo, P. Xanthopoulos, and Q. P. Zheng, “Online feature importance ranking based on sensitivity analysis,” Expert Systems with Applications, vol. 85, pp. 397–406, 2017.
[11] J. Chen, L. Song, M. J. Wainwright, and M. I. Jordan, “L-Shapley and C-Shapley: Efficient Model Interpretation for Structured Data,” 2018.
[12] E. Štrumbelj and I. Kononenko, “Explaining the Predic-tions of an Arbitrary Prediction Model: Feature Contribu-tions and Quasi-nomograms,” in Human and Machine Learning: Visible, Explainable, Trustworthy and Transpar-ent, J. Zhou, F. Chen, S. A. Cambo, and D. Gergle, Eds. Cham: Springer International Publishing, 2018, pp. 139– 157.
[13] S. M. Lundberg and S. I. Lee, “A Unified Approach to Interpreting Model Predictions,” Advances in Neural Infor-mation Processing Systems, pp. 4765–4774, 2017.
[14] P. Hoang and H. T. Tran, “A Dynamic Feature Selection Based LDA Approach to Baseball Pitch Prediction,” in Fast Dependency Parsing using Distributed Word Representa-tions, 2015, p. pp.125-137.
[15] G. Sidle and H. Tran, “Using multi-class classification methods to predict baseball pitch types,” Journal of Sports Analytics, vol. 4, no. 1, pp. 85–93, 2017.
[16] M. Wasikowski and X. Chen, “Combating the small sample class imbalance problem using feature selection,” IEEE Transactions on Knowledge and Data Engineering, vol. 22, no. 10, pp. 1388–1400, 2010.