Parallelizing
K-means
with Hadoop/Mahout for
Big Data Analytics
A Thesis Submitted for the Degree of
Master of Philosophy
By
Jianbin Cui
Department of Electronic and Computer Engineering
College of Engineering, Design and Physical Sciences
Brunel University, UK
i
Abstract
The rapid development of Internet and cloud computing technologies has led to explosive generation and processing of huge amounts of data. The ever increasing data volumes bring great values to societies, but in the meantime bring forward a number of challenges. Data mining techniques have been widely used in decision analysis in financial, medical, management, business and many other fields. However, how to analyse and mine valuable information from the massive data has become a crucial problem as the traditional methods are hardly to achieve high scalability in data processing.
Recently, MapReduce has emerged into a major programming model in dealing with big data analytics. Apache Hadoop, which is an open-source implementation of MapReduce, has been widely taken up by the community. Hadoop facilitates the utilization of a large number of inexpensive commodity computers. In addition, Hadoop provides support in dealing with faults which is especially useful for long running jobs. Mahout is a new open-source project of Apache, providing a number of machine learning and data mining algorithms based on the Hadoop platform.
As a machine learning technique, K-means has been widely used in data analytics through clustering. However, K-means experiences high overhead in computation when the size of data to be analysed is large. This thesis parallelizes K-means using the MapReduce model and implements a parallel K-means with Mahout on the Hadoop platform. The parallel K-means reduces the computation time significantly in comparison with the standard K-means in dealing with a large data set. In addition, this thesis further evaluates the impact of Hadoop parameters on the performance of the Hadoop framework.
DECLARATION
The work in this thesis is based upon the research carried out at the Department of Electronic and Computer Engineering, Brunel University. Except where specific reference has been made to the work of others, this thesis is the result of my own work. No part of this thesis has been submitted elsewhere for any other degree or qualification.
iii
ACKNOWLEDGEMENTS
I would like to express my sincere gratitude and appreciation to my supervisors Professor Maozhen.Li and Dr. Hongying Meng for their support, encouragement, guidance and patience during the research period. I am deeply grateful of their help in the completion of this thesis. Their valuable guidance and suggestion help me through the hardest times.
I would like to thank my family members and my friends. Without their help and trust, I will not finish the work successfully. I am also deeply indebted to all the colleagues in university for their direct or indirect help to me.
Table of Content
DECLARATION ... i
Chapter 1 Introduction ... 1
1.1 Background ... 1
1.2 Cloud Computing and Data Mining ... 4
1.3 Major Contributions ... 8
1.4 Thesis Structure ... 9
Chapter 2 A Review on Hadoop/MapReduce ... 10
2.1 Hadoop Overview ... 10
2.1.1 Hadoop History ... 10
2.1.2 Hadoop Advantages ... 10
2.1.3 Hadoop Subprojects ... 11
2.2 MapReduce Programming Model... 12
2.2.1 MapReduce Logical Model... 12
2.2.2 MapReduce Execution Flow ... 13
2.2.3 MapReduce Fault-tolerant Mechanism ... 15
2.3 HDFS Mechanism ... 16
2.3.1 HDFS Features and Limitations... 16
2.3.2 HDFS Related Concepts ... 17
2.3.3 HDFS Framework ... 18
2.4 Mahout Algorithm Library ... 21
2.4.1 Introduction ... 21
2.4.2 Taste ... 22
2.4.3 Mahout Algorithm ... 23
2.5 Summary ... 24
Chapter 3 The Parallel Strategy of K-means Algorithm ... 25
3.1 Clustering Analysis ... 25
3.2 K-means Algorithm Descriptions ... 26
3.3 K-means Algorithm Parallel Strategy ... 30
3.3.1 Mahout Data Model ... 30
v
3.4 Summary ... 45
Chapter 4 Experimentation and Evaluation ... 46
4.1 Building experimental platform ... 46
4.1.1 Software Environment ... 46
4.1.2 Set up Hadoop Platform ... 47
4.2 Experimental Studies ... 48
4.2.1 Efficiency of K-means Algorithm in Serial and Parallel Environment ... 48
4.2.2 Optimization of Hadoop Parameter ... 56
4.3 Summary ... 61
Chapter 5 Conclusions and Future Work ... 62
5.1 Conclusions ... 62
5.2 Future Work ... 62
List of Figures
Figure 2.1: Data flow diagram of WordCount ... 13
Figure 2.2: MapReduce program execution flow ... 14
Figure 2.3: HDFS internal framework ... 19
Figure 2.4: Core components of Taste ... 22
Figure 3.1: Result of first clustering ... 28
Figure 3.2: Result of second clustering ... 29
Figure 3.3: Comparison between Euclidean Distance and Manhattan Distance ... 33
Figure 3.4: Flow chart of once iteration ... 41
Figure 4.1: Hadoop platform working status ... 47
Figure 4.2: Nodes working status ... 48
Figure 4.3: Output folder ... 50
Figure 4.4: Result demonstration ... 51
Figure 4.5: Result folder ... 52
Figure 4.6: Weka working status ... 53
Figure 4.7: Result of parallel environment ... 54
Figure 4.8: Efficiency between single node and serial environment ... 55
Figure 4.9: The impacts of io.sort.factor ... 59
Figure 4.10: The impacts of number of reduce tasks... 60
vii
List of Tables
Table 2.1: Mahout algorithm library... 23
Table 3.1: Orange Vectors ... 35
Table 3.2: The number of words ... 37
Table 4.1: Environmental configuration of experiment ... 46
Table 4.2: Data information ... 49
Table 4.3: Experimental results ... 54
Chapter 1
Introduction
1.1 Background
With the rapid development of mobile Internet and e-commerce, the Internet has entered a new era. The amount of data generated has expanded sharply. For example, New York Stock Exchange generates 1TB of transactions daily, Facebook stores around 10 billion photos and the storage capacity is about 1PB, the Large Hadron Collider near Geneva, Switzerland produces about 15 PB of data annually [1]. Some Internet service providers face enormous challenges. The traditional data processing and the analysis framework are incapable of storing the large-scale data efficiently and supporting the high throughput literacy tasks. According to an investigation from IDC, the global amount of digital data doubles every two years, the amount of data had reached 1.8 ZB at the end of 2011 [2]. The transformation of information usage patterns for business and personal user has far exceeded the limits of the existing system platforms. The amount of data processed is overwhelming for enterprise and individual users.
Large amounts of data could be produced due to the application of measurement techniques and equipment in the science and engineering exploration, which would lead to huge challenges for processing large-scale massive data. For scientists and engineers, it is necessary to analyse the massive data in order to discover some useful information, but it is very difficult [3]. Due to the rapid development of genetics, people already have the conditions for conducting the exploration of hidden inheritance. However, it is a challenge to sort the genetic data, match and further mine the useful information. In the field of medical research, scientists have collected a plenty of diagnostic records of patients, physiological information and medical test
2
data in order to extract the useful information. In the field of meteorological research, the researchers have collected the meteorological environmental information of recent hundreds years. However, due to the lack of massive data processing technology, it is difficult to analyse the massive meteorological data. In the era of artificial intelligence, it is required that the machine has the ability to store the large-scale experience and knowledge, then extract the knowledge for learning and logical reasoning from the data and provide the expected feedback. The same problem exists in the field of humanities, such as huge amount of data is produced in the social network involving interpersonal and social relations.
With the increasing popularity of the sensor, the way to collect the information has become more diversified. The variety of sensors used by Real-time monitoring and network traffic monitoring system will generate different types of data [4]. Besides, the streaming data now also exists in different fields, such as the communication data in communication fields, the transactions in retail fields, the stock prices and transactions in financial sector. The streaming data is orderly and changing rapidly, which result in higher demand for response speed when processing and analyzing of streaming data.
The reasonable usage of massive data has become a popular and practical research. The data that we studied is called 'Big Data' and has three features: volume, velocity and variety. The information of the plentiful, complex structure data has many differences with the data in common databases. This series of development increase the difficulty of using data mining technology. The large-scale computing ability becomes an important external demand for the data mining technology to effectively complete the job. Traditionally, enterprises will attempt to use the high-performance computer or large-scale computing equipment to calculate the data, but it will greatly increase the cost of implementation. In order to adapt the current trends, cloud computing is presented to the stage of computer science and application, it not only leads a big change of information usage patterns, but also proposes a new way for data mining. Cloud computing is a new platform which focuses on big data and
distributed parallel processing, developed rapidly in recent years and achieved initial success in business. In the era of cloud computing, the traditional clustering algorithms can be redesign and implement using cloud computing platform in order to reduce the time and space complexity and efficiently solve the bottleneck problems in the storage and computing of big data [5].
Although the big data has features of being giant and chaotic, after professional process, it is able to get in-depth information with more decision-making power. Clustering is dividing a data set into a number of clusters or classes, and make the data objects in the same cluster have high similarity. The data objects in the different clusters are not similar. Because of the huge amount of data, especially in the Internet field, using traditional clustering algorithms to analysis big data will cost numerous time and memory space while unable to meet the request of real-time response. Hadoop is an open-source cloud computing platform with excellent data storage and computing performance to overcome the traditional bottleneck when processing big data. Currently, Hadoop is the preferred way to analyse big data. Meanwhile, Mahout is one of Hadoop subprojects, which is designed and implemented based on Hadoop platform. It focuses on the algorithms of data mining and machine learning, which is a perfect choice to be studied as a clustering algorithm in the cloud platform.
In recent years, data mining has aroused great concern of the information industry, which is mainly due to large amounts of data generated every day and converted into useful information and knowledge pressingly. The acquired information and knowledge can be used for market analysis, fraud checking, customer retention, product control and many other aspects of scientific inquiry [6].
Data mining is the basis of artificial intelligence, machine learning, pattern recognition, statistical, database, visualization technology. It can highly automatically analyse the data of enterprise, make inductive reasoning, and then mine potential models to help decision-makers to adjust marketing strategy in order to reduce the risk and make the correct decisions. Data mining tasks including cluster analysis, classification analysis, correlation analysis and anomaly analysis.
4
The data mining development has been through the following stages: The first stage is e-mail. This stage can be considered as from the beginning of the 1970s, the average annual growth of communication traffic increased several times. The second stage is information release. Since 1995, the information release system with web technology as the representative explosively grew up and became the major Internet applications. The third stage is e-commerce. E-commerce is regarded as a sign of The Times, which is because the main commercial application of Internet is e-commerce. In the era of e-commerce, more transactions were completed via the Internet in order to make the transactions easier, the information also showed explosive growth. The fourth stage is full e-commerce. With the occurrence of SaaS (Software as a Service) pattern, software has access to the Internet, extend the e-commerce chain, and then form a new pattern concept called 'full e-commerce'. Nowadays, increasing enterprises are using data mining to preferably grasp the market and user behaviour so that their sales performance can be improved. The typical examples such as Amazon and other e-commerce websites increase sale performance through personalized recommendations. Bank conducts customer management and risk assessment by establishing data analysis models. With the advent of era of big data, data mining will certainly show an unprecedented vitality [7].
1.2 Cloud Computing and Data Mining
Cloud computing is the development of parallel computing, distributed computing and grid computing. It is a result of mixing evolution and sublimation some concepts which included virtualization, utility computing, IaaS (Infrastructure as a Service), PaaS (Platform as a Service) and SaaS (Software as a Service). In technical aspect it has a higher level of maturity, and is actively promoted by some large companies. Therefore, cloud computing developed extremely fast once proposed. Google, Amazon, IBM, Microsoft, Yahoo and some other companies are the cloud computing technology leaders and guiders.
distributed in a large cluster including more than 200 sites and 1 million servers as well as the number of its server infrastructures are increasing promptly. Some of the successful applications are using cloud computing technology, such as Google earth, map, Gmail, Docs. Their data will be stored in a location on the Internet, and the user can use any device to connect to the Internet, which is a very convenient way to access and share the data. Currently, Google has opened its cloud computing facility to third-parties. Users can run large parallel application by using Google App Engine [8]. In 2004, it had published three papers to demonstrate the results of its cloud computing: GFS [9], MapReduce [10], Bigtable [11], and then opened programming courses in some universities in United States and China to lecture how to develop cloud computing. Thereafter, there are numerous followers. The most popular open-source project is Hadoop. Apache Hadoop is an open-source project on cloud computing, which allows distributed processing big data by using MapReduce computing model on a large number of cheap clusters. Transformation has been made from relying on expensive hardware into using distributed storage and parallel computing on cheap nodes to obtain high availability. Furthermore, Hadoop can detect and solve the node failures problem in order to provide high availability services in the case of individual nodes failed in the cluster. MapReduce model depends on Hadoop Distributed File System (HDFS) which support the local storage and computing of cluster nodes. Apache Mahout is an open-source algorithm library in data mining and machine learning fields, these algorithms are based on MapReduce programming model and HDFS.
Amazon developed Elastic Computing Cloud (EC2) and Simple Storage Service (S3) to provide computing and storage services to enterprises. It provides storage space, bandwidth, CPU resources and other rechargeable projects. Storage space and bandwidth charges by volume, users can store any type of file temporarily or permanently on S3 servers through the service interfaces which are provided by Amazon.
6
provide the users with a 'Ready to use' cloud computing platform. It is composed of a series of self-management and self-healing virtualization cloud computing software components, users in the different places in the world are able to easily use the distributed large-scale server computing nodes. Afterwards, IBM is in cooperation with 17 European organizations had presented a RESERVOIR cloud computing project to achieve the 'Resources and Services Virtualization without barriers', the EU provided 170 million Euro to sponsor the project. In August 2008, IBM announced that it would invest about $ 400 million to transform its cloud computing data centre which are located in North Carolina and Tokyo Japan, and invest $ 300 million to build 13 cloud computing centres in 10 countries in 2009.
In the cloud computing era, Microsoft also issued a cloud computing system named 'Windows Azure' in October 2008, which focuses on developing terminal products. Azure is based on Internet architecture to create new cloud computing platform, which is another important strategic product after the Microsoft Windows replaced DOS. The underlying of Windows Azure cloud computing platform is Microsoft Global Foundation Services System, which is composed of the fourth generation of data centres distributed around the world. Windows Azure cloud computing platform provides infrastructure that can be accessed via the Internet, including processors, storage devices and services, users and companies also can run their applications and store data on Microsoft cloud computing platform. Currently, Microsoft has configured 220 containerized data centres with 440,000 servers.
Hadoop is an open-source project from Apache Foundation which achieves Google's GFS and MapReduce. In 2004, Doug Cutting and Mike Cafarella realized Hadoop Distributed File System and MapReduce distributed computing framework as well as published the original version. In December 2005, Hadoop can stably run on a cluster of 20 nodes. In January 2006, Doug Cutting joined Yahoo, the same year in February, Apache Hadoop project officially supported HDFS and MapReduce independent development. Meanwhile, the new company named 'Cloudera' provides commercial support for Hadoop to help enterprises realizing the standardize installation and
volunteer to contribute the community. Hadoop provides a distributed system infrastructure for developers, users can develop distributed applications to leverage the function of clusters and achieve high-speed computing and storage even if they do not understand the underlying details of distributed system. Due to the prominent advantages of Hadoop, the Hadoop-based applications have been very abundant, especially in the Internet field.
In 1967, Q.J.Mac proposed K-means clustering algorithm which has become one of the most popular clustering algorithms currently [12]. After that, many researchers made plenty of improved algorithms to overcome the disadvantages of K-means algorithm. Aristidis Likas with his group proposed a global K-means algorithm, which firstly initiates all data as a cluster centre, then tried each data in the dataset as the cluster centre and calculate the error, and then choose the data with the smallest error as the new cluster centre [13]. The process is repeated until the K centres are found. This algorithm can overcome the uncertainty which is brought from the random selection k centres, but the algorithm process requires a large amount of computation and more time. It is therefore not suitable for large amounts of data clustering analysis. Steinbach and his group proposed bisecting K-means algorithm, which firstly randomly selects two points, execute basic K-means algorithm, and then calculates the squared error, find the cluster with larger squared error. Two initial centres are selected randomly. This procedure is performed until the K cluster centres are found. Dan Pelleg and his group proposed x-means algorithm [14]. Firstly, the user specified one range for the K value, the algorithm initialized K to the minimum value in the range, executing the basis K-means algorithm. Afterwards, each cluster is divided into two clusters. Bayesian Information Criterion (BIS) is used to compare the result after divided with the original result. If the value of BIS becomes bigger, then accept the new division. It will find the most suitable K value. The stand-alone version of the x-means algorithm had been implemented in open source data mining algorithm tools named 'Weka'.
8
already a number of studies regarding to clustering algorithms based on MapReduce framework. Meanwhile, there are studies of K-means algorithm based on large-scale TCPdump dataset [15], studies of Jarvis-Patrick algorithm parallel research based on clustering [16], studies of improved algorithm Cop-Kmeans base on MapReduce platform [17], studies of ISODATA algorithm base on remote sensing image dataset implemented on the MapReduce [18]. Besides, there are few studies of research and test clustering algorithm based on the Mahout algorithm [19]. These papers tested scalability of K-means clustering algorithm in dataset and the size of clusters based on the Mahout platform.
The conducted research indicated that clustering algorithm based on Hadoop platform has lower time and space complexity and good scalability. A number of research works are conducted on Hadoop-based clustering algorithm and testing, however, there are few parallel research and test based on the Mahout platform. It is necessary to use a series of outstanding Mahout-based data model to do further research and testing.
1.3 Major Contributions
This thesis aims to research data mining algorithms in Mahout subprojects based on Hadoop, including the following aspects:
1) Firstly, analysis is conducted on the MapReduce programming model and the mechanism of Hadoop distributed file system based on Hadoop distributed computing platform.
2) Secondly, discussion is synthetically carried out on clustering algorithms in data mining algorithms and analyses the K-means algorithm process.
3) Finally, the Mahout framework is studied including the data representation in Mahout. K-means algorithm is used as an example to understand how to implement data mining algorithms in parallel based on Hadoop platform. Experimental study has been carried out to investigate the impact of different factors on the parallel
computing. The working efficiency of K-means algorithm is compared between serial environment and parallel environment.
1.4 Thesis Structure
This thesis is divided into the following five parts:
The first chapter is the introduction which aims to introduce the background and significance of this topic. Meanwhile, it introduces the current development situation of cloud computing and data mining. In the end, it puts forward the main contents of research.
The second chapter aims to research and analyse Hadoop technology framework including the most significant two sub-projects, which are MapReduce programming framework and Hadoop distributed file system. The Mahout algorithm library is introduced, which realizes machine learning and data mining based on Hadoop platform.
The third chapter focuses on introducing the clustering analysis of data mining and describing the characteristics of K-means algorithm. Further research is conducted about the data representation and parallel implementation of K-means clustering algorithm in the Mahout framework.
In the fourth chapter, the Hadoop platform and experimental environment are built, using the Reuters news collection and some other dataset to do K-means algorithm experiments. Different amounts of data are adopted to run the K-means algorithm separately in serial and parallel models. The efficiency between the two results is compared.
In the fifth chapter, the main research achievements of the thesis are summarized. The insufficient during the research work is analysed. The prospect of further work in the future is proposed.
10
Chapter 2
A Review on Hadoop/MapReduce
2.1 Hadoop Overview
Hadoop is an open-source Cloud Computing platform in Apache Foundation, which is based on MapReduce computing model and HDFS distributed system [1]. The advantages of HDFS such as high fault tolerance, high scalability, et al., enable it to deploy Hadoop distributed system on a large number of cheap clusters. Meanwhile, MapReduce supports the users to develop parallel, distributed application, and they do not need to understand the underlying details. Then, users can deploy Hadoop framework to utilize the resource advantages of large-scale clusters, in order to solve the big data analysis problem which is difficult for the traditional high-performance single machine [20].
2.1.1 Hadoop History
Hadoop comes from the Apache Nutch, which is a project that began in 2002. It is one of the Apache Lucene subproject. In 2004, Google published a thesis named ‘MapReduce: Simplified Data Processing on Large Cluster’ in ‘Operation System Design and Implementation’ conference. After that, Doug Cutting, who began to try to program MapReduce framework and combine it with NDFS, to support the main algorithms of Nutch. Due to the advantages of NDFS and MapReduce, they were separated out in February 2006 and had become a complete and independent project called Hadoop [21].
2.1.2 Hadoop Advantages
are some main advantages including [22]:
High reliability: Hadoop has high bitwise storage and processing data ability.
High scalability: Hadoop distributes the data to the computers in the cluster, and completes the computing tasks. It is easily extended to thousands of nodes.
High efficiency: Hadoop could dynamically move data among nodes, and ensure each node’s dynamic equilibrium. So its processing speed is extremely fast.
High fault tolerance: Hadoop can automatically store multiple same copies of the data as well as automatically reassign the failed task.
2.1.3 Hadoop Subprojects
Hadoop has become a set including multiple subprojects. Although its core is HDFS and MapReduce, the Hive, Common, Avro, Chukwa et al. subprojects are also indispensable. They provide complementary services or provide a higher level service in the core layer.
Core/Common: From Hadoop 0.20 version, Hadoop Core changed the name to Common. Common is a tool to support Hadoop subprojects, including File System, RPC and Serialization library.
Avro: Avro is an efficient data serialization system that provides data persistence storage and remotes procedure call RPC.
Chukwa: Chukwa is an open-source data collection system that is used for monitoring and analysing large-scale distributed system data.
Hive: Hive is a data warehouse to provide data summary and query function which was first designed by Facebook.
HBase: HBase is an open-source, distributed, column-oriented store modelled after Big Table.
12
Pig: Pig is a kind of advanced streaming language based on MapReduce.
Mahout: Mahout is based on Hadoop platform and realizes a variety of machine learning and data mining algorithms library.
Then, my work focuses on the main components of Hadoop: MapReduce and HDFS.
2.2 MapReduce Programming Model
MapReduce is an easily programming model used for data processing with fast realization and strong scalability. It not only uses Ruby, Python, PHP, C++ and some other non-java language to write in Map or Reduce program, but also runs the same program in any Hadoop cluster synchronously. Therefore, the key advantage of MapReduce is processing the big data set.
2.2.1 MapReduce Logical Model
There are two stages (map and reduce) during the MapReduce working process. Map is separating a task into multiple tasks and Reduce is for collecting and analysing results [23]. Map stage has function: map () and Reduce stage has function: reduce (). Each function regards a key-value pair as input and output, in which ‘key’ means the byte offset in each data record in a data slice, and ‘value’ is the content of each row [24].
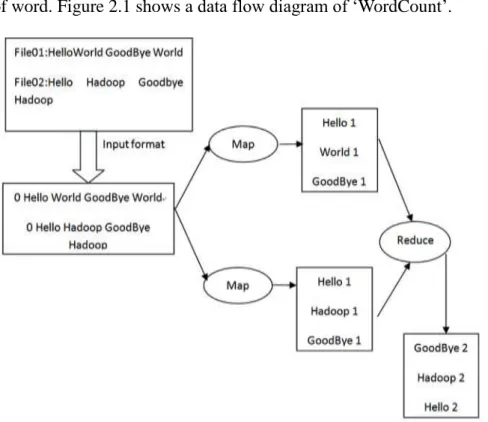
There is a basic requirement suitable for MapReduce processing tasks: Data sets can be processed into numerous small data sets, and every small data set can be processed completely in parallel. There is a ‘WordCount’ example to analyse the whole idea of the programming model.
Setting two input files:
File01: Hello World Goodbye World
File02: Hello Hadoop Goodbye Hadoop
the data is delivered to Map program. After the Map program reads the input, it cut out simple words and marks it for 1, and then transform the original form into <word, 1> form. Secondly, the data is delivered to reduce program, collecting the same key of value, and thus taking shape <word, list of 1> form. Finally, the added 1 value is the number of word. Figure 2.1 shows a data flow diagram of ‘WordCount’.
Figure 2.1: Data flow diagram of WordCount.
2.2.2 MapReduce Execution Flow
In MapReduce, the input file will be divided into several blocks by Map function. Assuming that the file is divided into M blocks, Map function will start M tasks. The results which include the value sets which have the same key will be sent to Reduce task [25]. Thus, N Reduce tasks start to process the results in parallel. MapReduce execution process is described as follow [26]:
MapReduce system will divide the input file into blocks, and then parallelly execute JobTracker and TaskTracker on Hadoop cluster. JobTracker is the main program responsible for distributing task to TaskTrackers dynamically according to the load of each node in cluster. TaskTracker will process both
14
Map and Reduce task.
Executing Map tasks. Map task will analyse a set of key-value pairs from the local file block. After the Map function finishes processing, it outputs a key-value pair of intermediate result which will be stored in the memory of each node.
The key-value pair in memory will eventually be written to local disk. According to the law of the function, different key values will be distributed into R sections. Meanwhile, each position information of intermediate result of Map task and partition information will be sent to the JobTracker.
Executing Reduce task. It will merge the intermediate results with the same key. According to the sections, the key-value pairs will be sent to relevant Reduce task. Finally, Reduce task outputs R files which are storing the results of Reduce task.
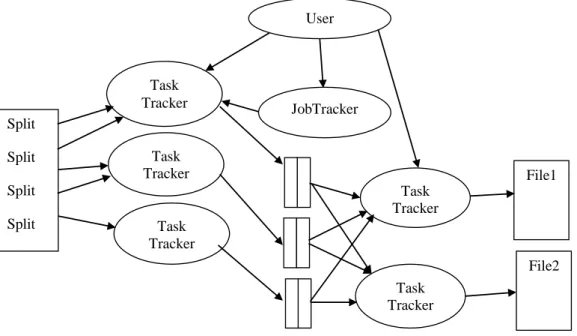
In the end, JobTracker notifies the user to return calling point. An example of MapReduce program execution flow is shown in Figure 2.2.
Figure 2.2: MapReduce program execution flow.
Split Split Split Split Split Task Tracker Task Tracker Task Tracker User program JobTracker Task Tracker Task Tracker File1 File2 Input Files Map Tasks Intermediate Files Reduce Task Output Files
2.2.3 MapReduce Fault-tolerant Mechanism
In the real environment, sometimes malfunction happens to the machine, e.g. the code fails or process crashes. The following will focus on analysing error handling mechanism.
o Hardware failure
From the perspective of MapReduce task execution, the hardware failure includes JobTracker and TaskTracker.
JobTracker failure is a single point failure, which is the most serious error. Up to now, the only way to avoid the failure is to create multiple spare JobTracker nodes. After the main JobTracker fails, the Leader election algorithm is used to choose a new JobTracker node. By contrast, the TaskTracker failure happens more than JobTracker. When the TaskTracker fails or runs slowly, TaskTracker will inefficiently send the heartbeat to JobTracker or even stop. If the JobTracker and the TaskTracker do not communicate for a specific time period, JobTracker will return to this task immediately. If this TaskTracker is still at the map stage, JobTracker will command another TaskTracker to re-perform this task; if this TaskTracker is at the Reduce stage, the JobTracker will command another TaskTracker to continue the Reduce task.
o Task failure
In practical task, MapReduce will encounter user code fault or processing crashes resulting in task failing. The fault code leads it to throw an exception during execution, and JVM process will automatically exit. Meanwhile, it will send an error message to TaskTracker and the error message is written to the log file. In the end, the TaskTracker will mark the task attempt fails. For the task failure caused by processing crashes, listener will find the process exit. At the moment, the task will be also marked as failed attempts by TaskTracker. Eventually, TaskTracker will apply to JobTracker for a new task.
16
2.3 HDFS Mechanism
HDFS (Hadoop Distributed File System) is a distributed file system designed to run on commodity hardware [27]. HDFS is highly fault-tolerant and is designed to be deployed on low-cost hardware. The following description will be divided into several aspects.
2.3.1 HDFS Features and Limitations
HDFS has the following features:
Processing large files
The large files mean the size of files over hundreds MB, even over hundreds TB.
Streaming Data Access
HDFS is designed based on ‘write once, read multiple’ task. It means one data set generated by the data source, will be copied and distributed to different nodes, then response to a variety of data analysis requests.
Running on a cluster of cheap commercial machines
Hadoop is designed to run on low requirement hardware. Therefore, it can run on inexpensive commodity hardware cluster.
Because of the above considerations, HDFS has some main limitations when processing certain issues including:
Unsuitable for low latency data access
HDFS is not suitable for processing some low delay application requests. It is specifically for processing big data analysis with high latency to generate great data throughput.
Unable to store a large number of small files efficiently
Hadoop needs NameNode to manage the metadata of file system to response to the requests from the client returning file location. Therefore, the limit of the quantity of
files is determined by NameNode.
Unable to support multi-user write and freely modify files
There is only one writer in a file in HDFS. Meanwhile, writing operation can only be completed at the end of the file, which is able to execute additional operations.
Although there are some existing problems, with the researchers’ efforts, HDFS will be more advanced and satisfy more application requirements in the future.
2.3.2 HDFS Related Concepts
This section introduces some concepts related to HDFS.
Data Blocks
HDFS block is an abstract concept, whose default size is 64MB. It is same with single file system, the file on HDFS is also divided into blocks for storage and it is a logical unit of a file storing process. Abstract block will bring lots of benefits. Firstly, arbitrary size of files could be stored Hadoop distributed file system. For example, it is impossible to store a 100 TB data for a single node. However, in Hadoop distributed file system, the file will be divided into many blocks and stored in the different machines in the cluster. Secondly, to simplify the storage subsystem, using abstract block as a unit of operating system. The size of block in Hadoop Distributed File System is fixed, thus facilitating the storage system managing especially for the metadata and file block can be stored separately. In addition, the blocks were used more conveniently to generate data copy from fault-tolerant in distributed system. In order to handle node failures in HDFS, the default file block will be set in three copies and stored on different nodes of the cluster. When a block is damaged, the system will get metadata information from NameNode, then read and store a copy on another machine [28].
NameNode and DataNode
There are two types of nodes in HDFS architecture. One is responsible for Master task that is NameNode, the other one is responsible for Slave task that is DataNode.
18
NameNode manages file system namespace, maintains the file directory tree of file system and the index directory. However, these is not permanently stored information, the NameNode will rebuild information dynamically when the system starts. DataNode is a worker node in file system to perform specific task: storing file blocks and called by client and NameNode. Meanwhile, it will regularly send the information of file block to NameNode by heartbeat.
2.3.3 HDFS Framework
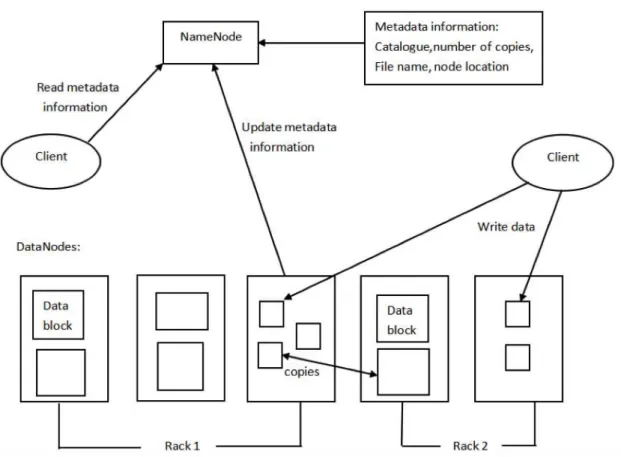
As shown in Figure 2.3, HDFS uses Master/Slave framework for file system management. An HDFS cluster consists of a NameNode and a number of DataNodes. NameNode is a central server responsible for managing namespace of file system and accessing from client. DataNode generally runs a single node process responsible for managing storage on this node. Internally, a file is divided into one or more databases that are stored on a set of data nodes. NameNode executes the namespace operation of file system, such as open, close, rename or directory, decides the mapping from data block to specific nodes. DataNode is responsible for processing the read/write requests from file system client. Creating, deleting and copying the data block under the control of the NameNode.
Figure 2.3: HDFS internal framework.
Storing and reading a copy of the policy
In HDFS, the key of reliability and performance is copy storage, optimizing the strategy of copy storage is the significant feature different from most of the other distributed file systems. HDFS uses rack-aware strategy to improve the data availability, reliability and network bandwidth utilization. Large HDFS instances are generally run on the clusters which are composed of computers from several racks. The computers in the different racks require communication through the switches. In most cases, the bandwidth of the two computers in the same rack is larger than the bandwidth of the two computers in the different racks.
On the other hand, HDFS tries to make the program read the nearest copy of the client in order to reduce the overall bandwidth consumption and reduce bandwidth-delay when it reads data. If there is a copy on the same rack, it will be read directly. If the HDFS cluster spans multiple data centres, the client will be the first attempt to read the copy from the local data centre.
20
Safe mode
After the NameNode start, it enters in a special state called safe mode, but it will not copy the data block. NameNode receives heartbeats and block status reports from all DataNodes. Block status report includes all the data blocks from the DataNode. Each data block has to specify the minimum number of copies. When NameNode testing confirms the copies of a data block reaching a minimum value, the data block will be considered as secure. After a certain percentage of the data block is detected in secure, NameNode will exit from safe mode state. After that, it will determine the data blocks did not reach the specified number, then copy these data blocks to the other DataNode.
File security
The importance of NameNode is outstanding; the client is not able to get the location of the file blocks without it. In practice, if the NameNode of the cluster fails, all the files in the entire file system will be lost, because the file blocks on DataNode cannot be used to reconstruct the file.
The first method to ensure the safety of NameNode in Hadoop is the backup of the metadata files which are persistently stored on NameNode, then dump to another file system which is synchronous operation. The usual implementation approach is dumping the metadata from Namenode to remote NFS file system. The second method is running on secondary NameNode in the system synchronously. The main role of this node is to periodically merge and edit the namespace mirror in the log in order to avoid editing log excessively. Running secondary NameNode requires a lot of CPU and memory to do the merge operation, so it needs to run on a separate machine. The merged namespace mirror will be stored on the secondary NameNode and will be used to make the bench after the NameNode crashed, so that the loss of files is minimized.
2.4 Mahout Algorithm Library
2.4.1 Introduction
Apache Mahout originates from 2008, when it was an Apache Lucene subproject. Apache Lucene is a well-known open source search engine, which implements advanced information retrieval, text mining functions. In the field of computer science, these concepts are similar with machine learning [29]. Therefore, the initial Apache Mahout was composed of machine learning algorithms. In a short time, Apache Mahout absorbed an open-source collaborative filtering algorithm project called ‘Taste’. After two years of development, Apache Mahout eventually became the top project of Apache. Apache Mahout aims to build a scalable machine learning algorithm library and the scalability for big data sets. Mahout algorithm runs based on Hadoop platform and realizes by the use of MapReduce Model. However, Mahout is also available on a single node or other non-Hadoop platforms, the non-distributed algorithms in Mahout core library also have perfect performance.
Apache Mahout is a new open-source project from Apache Software Foundation (ASF), which supports a variety of classical machine learning algorithm, in order to help researchers to develop more intelligent applications easily and quickly. Although plentiful techniques and algorithms have been achieved, there are some new algorithms being developed and tested. Mahout project currently includes the following four parts:
Clustering: Dividing the input data into multiple classes by similar objects.
Classification: Using the existing classification file classifier to classify the unclassified files.
Recommendation engine (collaborative filtering): Discovering the users’ behaviours and recommending the items that customs might be loved.
22
identify projects appeared at the same time.
2.4.2 Taste
Taste is the efficient implementation of a personalized recommendation engine which is Apache Mahout provided. The engine is based on java implementation with high scalability, while some recommendation algorithms in Mahout performed MapReduce programming model transformation. Therefore, it can use Hadoop distributed architecture to improve the performance of recommendation algorithm.
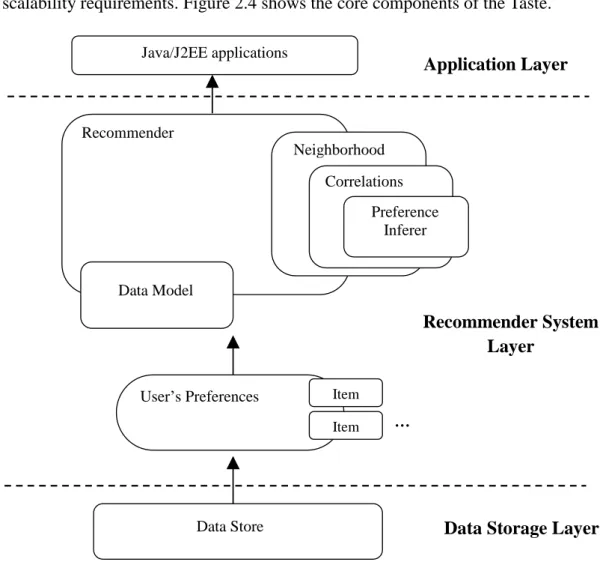
Taste is not only suitable for java applications, and also acting as a component of the internal server to provide the logic of recommendation using HTTP and Web Service. The Taste is designed so that it can meet the high performance, flexibility and scalability requirements. Figure 2.4 shows the core components of the Taste.
Figure 2.4: Core components of Taste.
Java/J2EE applications Recommender Neighborhood Correlations Preference Inferer Data Model
User’s Preferences Item
Item
Data Store
Application Layer
Recommender System Layer
Data Storage Layer
2.4.3 Mahout Algorithm
Table 2.1 shows parallelization strategy algorithm implemented in Mahout.
Table 2.1 Mahout algorithm library
Category Name Clustering Canopy Clustering K-means Clustering Fuzzy K-means Streaming K-means Spectral Clustering Classification Logistic Regression
Naive Bayes/Complementary Naive Bayes Random Forest
Hidden Markov Models Multilayer Perceptron
Collaborative Filtering
User-Based Collaborative Filtering Item-Based Collaborative Filtering
Matrix Factorization with ALS Matrix Factorization with ALS on Implicit
Feedback
Weighted Matrix Factorization, SVD++
Dimensionality Reduction
Singular Value Decomposition Stochastic SVD PCA(via Stochastic SVD)
24 Miscellaneous
RowSimilarityJob ConcatMatrices
Collocations
Sparse TF-IDF Vectors from Text XML Parsing
Email Archive Parsing Lucene Integration Evolutionary Processes
Topic Models Latent Dirichlet Allocation
Mahout transfers lots of algorithms which are previously used on the single machine to MapReduce mode by parallelization strategy. The advantage is to use these algorithms in Hadoop platform for machine learning and data mining tasks, in order to greatly improve the capability for processing big scale data sets.
2.5 Summary
This chapter introduces an overview of Hadoop framework, analyses the MapReduce programming model and the implementation mechanism of HDFS distributed file system. Moreover, it briefly introduces Mahout algorithm library which is one of Hadoop subprojects.
Chapter 3
The Parallel Strategy of K-means Algorithm
3.1 Clustering Analysis
Cluster analysis or clustering is the task of grouping a set of objects in such a way that objects in the same group (called a cluster) are more similar (in some sense or another) to each other than to those in other groups (clusters) [30]. Clustering is an unsupervised learning to divide some unmarked objects into several meaningful clusters. Moreover, in a cluster, it is unknown how many the target data sets exist classes, using distance metric for clustering all the objects, so that the distance in the same cluster is minimal as well as the distance in the different clusters is maximal. There are some main clustering algorithms including [31]:
o Division method
For a given data set consisting of N tuples or records, the Division method will construct K clusters (K≤N), and K clusters meet the following conditions: Firstly, each cluster contains at least one data object. Secondly, each data record only belongs to one cluster. For the given parameter K, the algorithm gives an initial division method, and then changes divisions by iteration ensuring that the improved division is better than the previous one. The typical algorithms are K-means algorithm and K-medoids algorithm.
o Hierarchy method
This method hierarchically decomposes the given data set until meeting certain condition. It includes the ‘bottom-up’ condensation method and the ‘top-down’ secession method. The typical algorithms contain Birch algorithm, Cure algorithm, Chameleon algorithm, et al.
26 o Density-based method
This method based on a variety of distance has fundamental difference with the other methods. In this method, as long as there is a density of point in the area larger than a certain threshold, it will be put in the similar clustering algorithm. The typical algorithms contain DBSCAN algorithm, OPTICS algorithm, et al.
o Grid-based algorithm
In this method, the first step is dividing the data space into limited number of grids, and in the meantime, each unit is regarded as a single object in all of the processing. The prominent advantage of the method is high processing rate, and normally it is independent from the number of records in target data set, but related to the number of units divided from data space. The typical algorithms are STING algorithm, Wave-Cluster algorithm, et al.
o Model-based algorithm
Model-based method is assuming a model for each cluster, and then finding data for the given model for optimal simulation. The given model probably is the density distribution function of data point in space. Generally, it includes statistics scheme and neural network scheme.
K-means algorithm is one of classical clustering analysis algorithms. The next two sections will focus on parallel strategy analysis and research of K-means algorithm based on Mahout framework.
3.2 K-means Algorithm Descriptions
K-means clustering is a method of vector quantization, originally from signal processing, which is popular for cluster analysis in data mining. K-means clustering aims to partitioning observations into k clusters in which each observation belongs to the cluster with the nearest mean, serving as a prototype of the cluster. This results in a partitioning of the data space into Voronoi cells [32]. According to the input parameter K, K-means divides N object sets into K clusters, in order to make the high
similarity within clusters and low similarity between the clusters. The similarity of cluster is the mean measurement of the objects in the cluster. K-means algorithm processes as follow: Firstly, it randomly selects K objects, and each object represents an initial cluster centre [33]. For each of the remaining objects, according to their distance from the clusters centre, it will be assigned to the most similar cluster. Afterwards, the new centre of each cluster is calculated. This process is repeated until the criterion function convergence happens. The Formula (3.1) shows the criterion function.
k i p ci p mi E 1 | |2 (3.1)In the formula, p is the certain point in space, demonstrating a given object; mi is the
mean value of cluster Ci (p and mi are multidimensional); E indicates the sum of
square error of all of the objects in the cluster. Namely, for each object in each cluster, calculating the square of its distance from the cluster centre, and thus summing the square values. K-means algorithm process is described as follow [34]:
(1)Establishing the initial division and obtaining K clusters according to the given K.
(2)Calculating the distance from each point to the cluster centre, adding it to the nearest cluster.
(3)Recalculating the centre of each cluster.
(4)Repeating process (2) and (3), until the centre of each cluster is maintained in an accuracy range or has reached the maximum number of iterations.
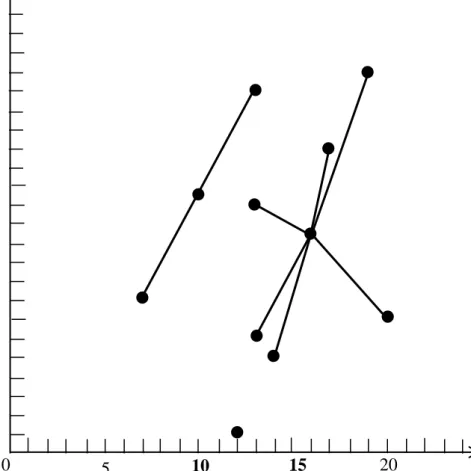
There is an example of which they are nine points and K is 3 to illustrate K-means algorithm. Before clustering, nine points in a two-dimensional plane were randomly selected, i.e. coordinates (7,8), (12,1), (13,6), (13,13), (13,19), (14,5), (17,16), (19,20), (20,7).
The first clustering
System randomly selects three points as cluster centre, assuming the points are (7, 8), (12, 1), (13, 6). Next, it will calculate the distance from each point to each cluster
28
centre; the point will belong to the nearest cluster centre. After calculation, point (7, 8), point (13, 19) are in cluster A, point (12, 1) is in cluster B, point (13, 6), point(13, 13), point(14, 5), point(17, 16), point(19, 20), point(20, 7) are in cluster C. The Figure 3.1 shows the results.
Figure 3.1: Result of first clustering.
When the cluster centre has been updated, the new cluster centre value is the average of all members of the cluster. The new cluster centre of cluster A is (10.0, 13.5), the new cluster centre of cluster B is (12.0, 1.0), the new cluster centre of cluster C is (16.0, 11.2).
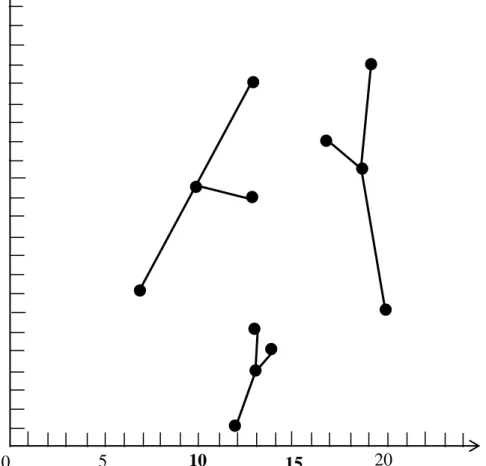
The second clustering
According to the previous generation of the cluster centre, the distance from each point to each centre is recalculated and clustering is repeated. The new results are point (7, 8), point (13, 13), point (13, 19) constitute new cluster A, point (12, 1), point
20 15 10 5 20 15 10 5 0
(13, 6), point (14, 5) constitute new cluster B, point (17, 16), point (19, 20), point (20, 7) constitute new cluster C. The new cluster centre of cluster A is point (11.0, 13.3), the new cluster centre of cluster B is point (13.0, 4.0), and new cluster centre of cluster C is point (18.7, 14.3). Figure 3.2 shows the result.
Figure 3.2: Result of second clustering
After the clustering operation had been repeated, the clustering results were found no change and were able to meet the convergence conditions. Thus, the clustering finished.
The above example illustrates that K-means algorithm has numerous advantages. The principle of K-means algorithm is relatively easy to be achieved with high efficiency of execution and scalability for big data. However, the disadvantages of K-means algorithm are also obvious. Firstly, it requires the user to confirm the number of clusters before executing cluster, but they usually find an optimal value of K through
20 15 10 5 20 15 10 5 0
30
several experiments. Secondly, due to the algorithm randomly selects the initial cluster centres at the beginning, the algorithm has poor tolerance of noise and isolated points. Noise is the incorrect data in the cluster; isolated point is the data which is far away from other data points with low similarity. At the beginning, if the isolated point or noise is selected as the cluster centre, there will be a problem during the clustering process. The way to solve the problem and optimize the execution process is to quickly choose the K value and initial cluster centre.
3.3 K-means Algorithm Parallel Strategy
This section presents the design strategy in parallelization of K-means. It first introduces Mahout data model.
3.3.1 Mahout Data Model
Mahout data model is discussed from the aspects of vector representation, similarity calculation, converting data to vector and converting text to vector.
3.3.1.1 Vector Representation
The object of Mahout clustering algorithm is represented as the simple data model: Vector. On the basis of the vector data description, it easily calculates the similarity of two objects. Vector is a complex object that each domain is a floating-point number (double). Some of the values of vector are very dense, each domain has its value; some of the values of vector are sparse, there are probably only some domains having their values. Due to the different data contents of vector in specific applications, Mahout supports plenty of implementations [35].
DenseVector.
For DenseVector, the implementation is a floating-point array. All domains in vector will be stored, suitable for storing dense vectors. This vector representation is highly efficient when most of the vectors have their valid value. It allows quick access to the
value of vector in any dimension and sequentially to traverse all dimensions of vectors.
RandomAccessSparseVector
The implementation is HashMap based on floating-point. The key is int type and value is double type. The value of dimension will be stored when it is not zero. When some dimensions of a vector are nonzero, using RandomAccessSparseVector to present vector have higher memory efficiency than using DenseVector, but the speed of accessing dimension value and sequentially traversing all dimensions of vectors are slower.
SequentialAccessSparseVector
The implementation is a parallel array, int type and floating-type separately presents the dimension and dimension values of the stored vector. It also only stores the nonzero value of vector. Thus, it combines the advantages of the previous two vectors, but the disadvantages are the poor speed of random inserting and selecting.
Based on the above three vectors, Mahout algorithm is able to be achieved by following the data characteristics and data access methods. If the algorithm for vector value has plentiful random inserting and updating, it should choose DenseVector or RandomAccessSparseVector to present vector; if most of them are sequential access, SequentialAccessSparseVector would show better performance.
3.3.1.2 Similarity Calculation
Clustering is a data object divided into numerous clusters, which aims to make the objects in the same cluster with high similarity as well as the objects in the different clusters with high distinction. Mahout algorithm represents the object as a simple model called vector. Actually, similarity calculation is to calculate the distance between two vectors, the smaller distance means higher similarity. There are some calculation distance methods shown as follow:
32
Euclidean Distance
Euclidean Distance is one of the most simple distance measuring methods. It measures the absolute distance of each point in an n-dimensional space. Assuming x, y are two points in an n-dimensional space, the Formula (3.2) shows the Euclidean Distance.
n
i xi yi y x d 1 2 , (3.2)Mahout uses a class called ‘EuclideanDistanceMeasure’ to calculate the distance.
Squared Euclidean Distance
This value of distance is the square of return value of Euclidean Distance. Formula (3.3) shows the distance n-dimensional space.
2 1 ,
n i xi yi y x d (3.3)Mahout uses a class called ‘SquaredEuclideanDistanceMeasure’ to calculate the distance.
Manhattan Distance
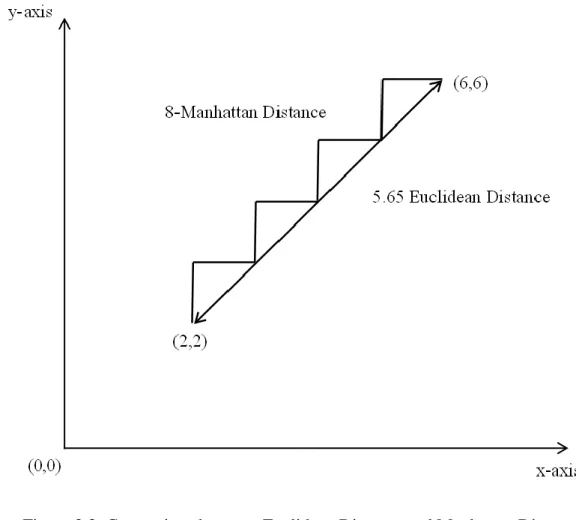
Manhattan Distance is from the distance among city districts. Unlike Euclidean Distance, it is the summation of the distance among the multiple dimensions. Figure 3.3 indicates that the distance of two points in XY plane calculated through Manhattan Distance and Euclidean Distance.
Figure 3.3: Comparison between Euclidean Distance and Manhattan Distance.
In Figure 3.3, the result of Manhattan Distance is 8 and the result of Euclidean Distance is 5.65 between point (2, 2) and point (6, 6). Mahout uses a class called ‘ManhattanDistanceMeasure’ to calculate the distance. The Formula (3.4) shows the Manhattan Distance.
, 1| i| n i xi y y x d
(3.4) Cosine DistanceCosine Distance regards the points as vectors, that there is a small angle between two vectors. It calculates the cosine of the angle, the bigger value of cosine means the smaller angle, and the smaller value of cosine means the bigger angle. The Cosine Distance formula (3.5) of two n-dimensional vectors is shown.
n i n i i n i i i y x y x y x y x y x d 1 1 2 2 1 * || |||| || * cos , (3.5)34
Mahout uses a class called ‘CosineDistanceMeasure’ to calculate the distance.
Tanimoto Distance
In some applications, it considers not only the vector angle problem, but also the useful information contained on the length of the vector. For example, assuming there are three vectors(X(20,20), Y(40,40), Z(50,50))in plane space. Although any two vectors cosine is 0, vector Y and vector Z are closer. Cosine Distance only considers the angle and ignores the length; Euclidean Distance only considers the length and ignores the angle. Therefore, in this condition both of them are invalid. Tanimoto Distance is also regarded as generalized Jaccard Distance, simultaneously reflects the impact of angle and distance. The Tanimoto Distance formula (3.6) is shown.
n i n i n i i i i i n i i i y x y x y x xy y x y x y x d 1 1 1 2 2 1 || || || || * , (3.6) Weighted DistanceMahout provides WeightedDistanceMeasure class using Euclidean Distance and Manhattan Distance. Because of the importance of different dimensions of a vector are different, the different dimensions need to be distinguished. According to the requirements, Weighted Distance will give specific weighting factors to specific dimension, in order to influence the measurement results. For example, when calculating the distance between two points on a plane, the X-direction and Y-direction can be imparted weighting factor 1 and 2. The value of Y-direction obviously has greater effect on distance.
3.3.1.3 Converting Data to Vector
For object clustering, firstly it needs to be converted to a vector. The dimension vector size will depend on how many features the object has.
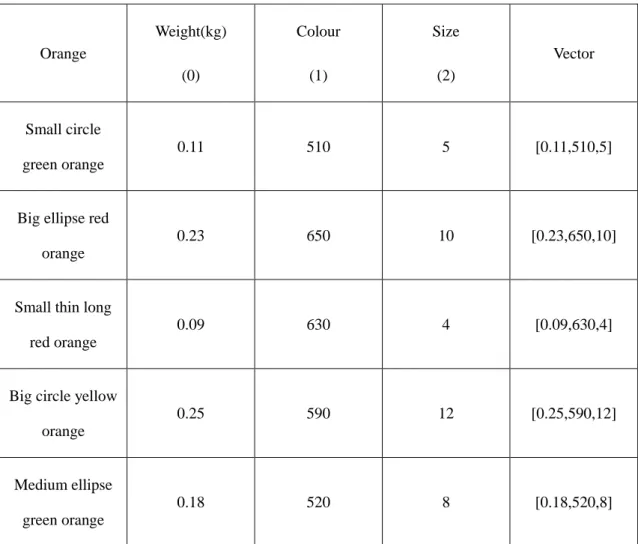
For example, if there is an orange dataset, the feature includes the weight, colour and size. Firstly, converting the features to dimensions, assuming weight is 0, colour is 1
and size is 2. Secondly, quantize each dimension. For the weight, it is assigned grams or kilograms to measure; for size, it is assigned centimetres for the diameter of oranges to measure. For colour, the best method to represent it is using wavelength of colours. It will be shown the different colours accurately. Table 3.1 described some oranges vectors.
Table 3.1: Orange vectors.
Orange Weight(kg) (0) Colour (1) Size (2) Vector Small circle green orange 0.11 510 5 [0.11,510,5]
Big ellipse red orange
0.23 650 10 [0.23,650,10]
Small thin long red orange
0.09 630 4 [0.09,630,4]
Big circle yellow orange
0.25 590 12 [0.25,590,12]
Medium ellipse green orange
0.18 520 8 [0.18,520,8]
36
1 public static List<Vector>creatOrangeVector(){
2 List<Vector>oranges= new ArrayList<Vector>();
3 NamedVector orange=new NamedVector(new DenseVector(new double[] {0.11,510,5}),);
4 oranges.add(orange);
5 orange=new NamedVector(new DenseVector(new double[]{0.23,650,10}),);
6 oranges.add(orange);
7 orange=new NamedVector(new DenseVector(new double[]{0.09,630,4}),);
8 orange.add(orange);
9 orange=new NamedVector(new DenseVector(new double[]{0.25,590,12}),);
10 orange.add(orange);
11 orange=new NamedVector(new DenseVector(new double[]{0.18,520,8}),);
12 orange.add(orange);
13 return oranges;
}
3.3.1.4 Converting Text to Vector
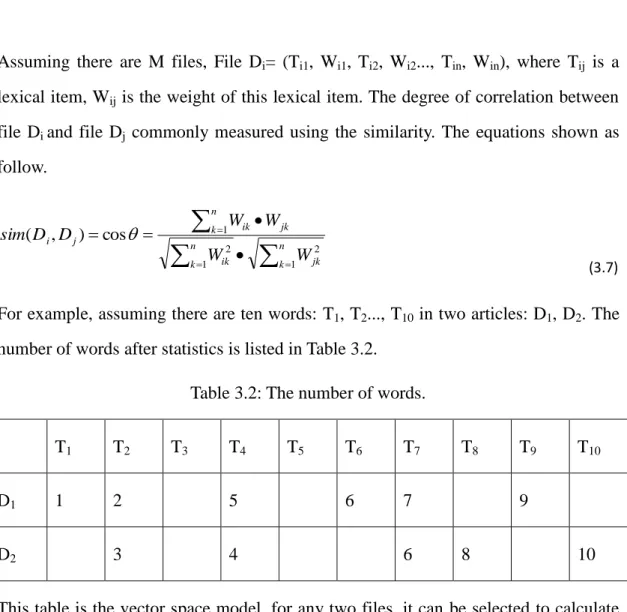
With the development of the information age, the number of text files increase rapidly. Generally, the useful information should be extracted from massive text data. During the text data pre-processing, it is a vital step to convert high-dimensional text data to vector. Vector Space Model (VSM) is an algebraic model for representing text documents (and any objects, in general) as vectors of identifiers, such as, for example, index terms. It is used in information filtering, information retrieval, indexing and relevancy rankings. It is the most common similarity calculation model. Its basic concept is converting text to vector by calculating the similarity to compare texts [36].
Assuming there are M files, File Di= (Ti1, Wi1, Ti2, Wi2..., Tin, Win), where Tij is a
lexical item, Wij is the weight of this lexical item. The degree of correlation between
file Di and file Dj commonly measured using the similarity. The equations shown as
follow.
n k jk n k ik n k ik jk j i W W W W D D sim 1 2 1 2 1 cos ) , ( (3.7)For example, assuming there are ten words: T1, T2..., T10 in two articles: D1, D2. The
number of words after statistics is listed in Table 3.2.
Table 3.2: The number of words.
T1 T2 T3 T4 T5 T6 T7 T8 T9 T10
D1 1 2 5 6 7 9
D2 3 4 6 8 10
This table is the vector space model, for any two files, it can be selected to calculate the cosine of the two vectors when it wants to calculate their similarity. Assuming in the file D1, there are ten words and each word appears a certain amount of times,
represented as a1, a2..., a10; and in the file D2, there are ten words and each word is
appeared b1,b2...,b10. Then the cosine value of D1 and D2 can be shown as follow:
324 . 0 15 14 68 10 4 3 9 2 1 6 7 4 5 3 2 || |||| || cos 2 2 2 2 2 2 2 10 2 2 2 1 2 10 2 2 2 1 10 10 2 2 1 1 2 1 2 1 b b b a a a b a b a b a d d d dT (3.8)
If cosine value is 1, then the two files are completely same. If cosine value is 0, then the two files are completely different. Overall, the increasing cosine value in [0, 1] results in higher similarity of two files. After calculation, the cosine of two articles is approximately 0.324.
38
similarity of files. However, when the number of a keyword analogously occurs in two articles which have a greater gap of length, it will reduce the accuracy of the results. For example, if a word is appeared 100 times in both file D1 and file D2, it has
the same importance from the view of word frequency. However, if it considers another factor that the keyword of file D1 is 1,000 and the keyword of file D2 is
10,000, the importance of this keyword is different in file D1 and file D2. Therefore,
the occurrence frequency of a word in a file is regarded as the weight of the word, is called term frequency (TF). This method is to process word-counting, using keywords divided by the total number of the keywords in the file. Therefore, for the word Ti in a
particular file, the word frequency is shown.
k kj ij ij n n TF (3.9)Where, nij is the number of the word appearing in the file Dj, while the denominator is
the sum of all words in the file nij.
If it only distinguishes the file using word frequency, it will encounter another problem. There are lots of common words such as you, me in an article with high occurrence. Regardless of using which kind of distance to measure the similarity of two articles, these words usually give some negative impact to the result. TF-IDF (Term Frequency-Inverse Document Frequency) technology can be used to sort out this problem. Actually, TF-IDF is TF*IDF, TF is word frequency representing the frequency of words in the document and IDF is inverse document frequency whose main idea is that if the document contains fewer words, the IDF will be bigger, it indicates that this word has a good ability to distinguish categories [37].
TF-IDF is a statistical method for evaluating the importance of a word or phrase in a file in a file set or corpus. The importance of this word or phrase proportionally increases with the increasing number of appearances in the file, but it inversely proportional decreases with the frequency of appearances in the corpus. The main idea of TF-IDF is that if the TF of a word or phrase in an article is higher and rarely appears in the other articles, then it is believed that the word or phrase has a good
ability to distinguish categories and is suitable for classification [38]. Actually, TF-IDF means TF*IDF, that TF means term frequency which is the frequency of the word in a file and IDF means inverse document freque