>
Distribution Annual Planning Report
2015
DISCLAIMER
Essential Energy is registered as a Distribution Network Service Provider. This Distribution Annual Planning Report (DAPR) 2015 has been prepared and published by Essential Energy under clause 5.12.2 and 5.13.2 of the National Electricity Rules to notify Registered Participants and Interested Parties of the results of the distribution network annual planning review and should only be used for those purposes.
This document does not purport to contain all of the information that a prospective investor or participant or potential participant in the National Electricity Market, or any other person or interested parties may require. In preparing this document it is not possible nor is it intended for Essential Energy to have regard to the investment objectives, financial situation and particular needs of each person who reads or uses this document.
In all cases, anyone proposing to rely on or use the information in this document should independently verify and check the accuracy, completeness, reliability and suitability of that information for their own purposes.
Accordingly, Essential Energy makes no representations or warranty as to the accuracy, reliability, completeness or suitability for particular purposes of the information in this document. Persons reading or utilising this document acknowledge that Essential Energy and their employees, agents and consultants shall have no liability (including liability to any person by reason of negligence or negligent misstatement) for any statements, opinions, information or matter (expressed or implied) arising out of, contained in or derived from, or for any omissions from, the information in this document, except in so far as liability under any New South Wales and Commonwealth statute cannot be excluded.
Contact
For all enquiries regarding the Distribution Annual Planning Report 2015 and for making written submissions contact: Essential Energy DM Coordinator PO Box 5730 Port Macquarie NSW 2444 Email: [email protected]
CONTENTS
EXECUTIVE SUMMARY ... 6
1 INTRODUCTION ... 7
1.1 About Essential Energy ... 7
1.1.1 Our Objectives ... 7
1.1.2 Our Vision ... 8
1.1.3 Operating Environment ... 8
1.1.4 Essential Energy statistics ... 9
1.2 Essential Energy’s Network ... 9
1.2.1 Number and Types of Distribution Assets ... 11
1.3 Annual Planning Review ... 12
1.3.1 Network planning process... 13
1.4 Significant changes from previous DAPR ... 14
1.4.1 Analysis and explanation of forecast changes ... 14
1.4.2 Analysis and explantion of changes in other information ... 14
2 FORECASTS for the FORWARD PLANNING PERIOD ... 15
2.1 Load Forecasting Strategy ... 15
2.2 Load Forecasting Methodology and Process ... 16
2.2.1 Sources of load forecast input information ... 17
2.2.2 Assumptions applied to load forecasts ... 18
2.3 North Coast ... 19
2.3.1 Terranora Supply Area ... 19
2.3.2 Lismore Supply Area ... 22
2.3.3 Casino Supply Area ... 26
2.3.4 Grafton Supply Area ... 27
2.3.5 Coffs Harbour Supply Area ... 30
2.3.6 Nambucca Heads Supply Area ... 33
2.3.7 Kempsey Supply Area ... 34
2.3.8 Port Macquarie Supply Area ... 37
2.3.9 Herons Creek Supply Area ... 40
2.3.10 Taree Supply Area ... 41
2.3.11 Stroud Supply Area ... 44
2.3.12 Hawks Nest Supply Area ... 47
2.4 Northern Region ... 48
2.4.1 Armidale Supply Area ... 48
2.4.2 Glen Innes Supply Area ... 51
2.4.3 Inverell Supply Area ... 53
2.4.4 Tenterfield Supply Area ... 55
2.4.5 Waggamba (Ergon) Supply Area ... 56
2.4.6 Moree Supply Area ... 57
2.4.7 Narrabri Supply Area ... 59
2.4.8 Gunnedah Supply Area ... 61
2.4.9 Tamworth Supply Area ... 62
2.4.10 Beryl Supply Area ... 65
2.4.11 Wellington Supply Area ... 68
2.4.12 Dubbo Supply Area ... 69
2.4.13 Nyngan Supply Area ... 73
2.4.14 Broken Hill Supply Area ... 75
2.5 South East Region ... 77
2.5.1 Bathurst Supply Area ... 77
2.5.2 Oberon Supply Area ... 80
2.5.3 Orange Supply Area ... 81
2.6.1 Parkes Supply Area ... 108
2.6.2 Forbes Supply Area ... 110
2.6.3 Cowra Supply Area ... 111
2.6.4 Temora Supply Area ... 114
2.6.5 Wagga North Supply Area ... 117
2.6.6 Wagga Wagga (Copland St) Supply Area ... 120
2.6.7 Morven Supply Area ... 122
2.6.8 Albury Supply Area ... 123
2.6.9 Finley Supply Area ... 125
2.6.10 Deniliquin Supply Area ... 127
2.6.11 Coleambally Supply Area... 128
2.6.12 Darlington Point Supply Area ... 130
2.6.13 Griffith Supply Area ... 131
2.6.14 Yanco Supply Area ... 134
2.6.15 Buronga Supply Area ... 137
2.7 Future Connection Points ... 139
2.8 Transmission – Distribution Connection Point Load Forecast ... 140
2.8.1 Transmission - Distribution Connection Point load forecast – North ... 140
2.8.2 Transmission - Distribution Connection Point load forecast – Central ... 141
2.8.3 Transmission - Distribution Connection Point load forecast – South and Far West ... 142
2.9 Forecast of Reliability Target Performance ... 143
3 IDENTIFIED SYSTEM LIMITATIONS ... 144
3.1 Subtransmission Feeder Limitations ... 145
3.2 Subtransmission and Zone Substation Limitations ... 147
3.3 Primary Distribution Feeder Limitations ... 148
4 NETWORK INVESTMENTS ... 151
4.1 Regulatory Test / RIT-Ds completed or in progress... 151
4.2 Potential RIT-Ds for identified system limitations... 151
4.3 Commited Investments ... 151
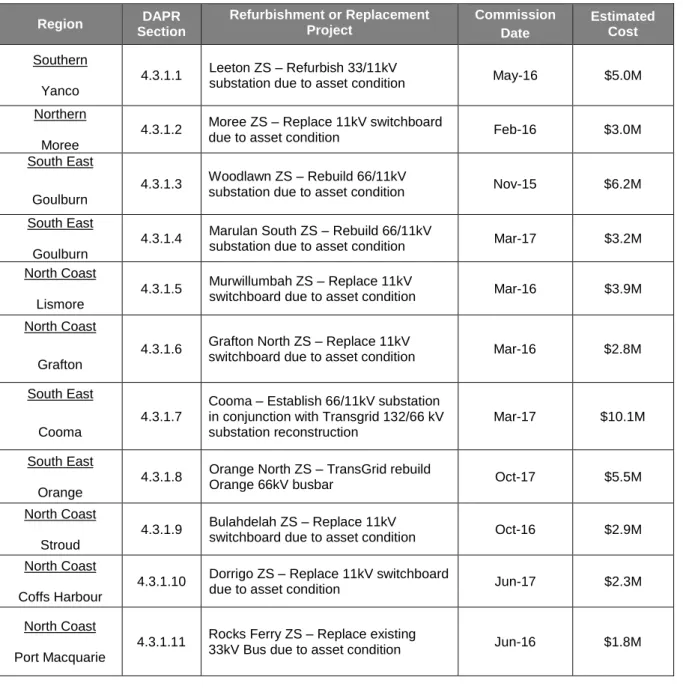
4.3.1 Refurbishment and replacement investments ... 151
4.3.2 Urgent and unforseen investments ... 155
5 JOINT PLANNING ... 156
5.1 Results of Joint Planning with the TNSP TransGrid in 2015 ... 156
5.1.1 Summary of the process and methodology... 156
5.1.2 Investments jointly planned in 2015 ... 157
5.1.3 Additional Information ... 157
5.2 Results of Joint Planning with the TNSP Powerlink in 2015 ... 157
5.2.1 Summary of the process and methodology... 157
5.2.2 Investments jointly planned in 2015 ... 157
5.2.3 Additional Information ... 157
5.3 Results of Joint Planning with the DNSP Energex in 2015 ... 157
5.3.1 Summary of the process and methodology... 157
5.3.2 Investments jointly planned in 2015 ... 158
5.3.3 Additional Information ... 158
5.4 Results of Joint Planning with the DNSP Ergon in 2015 ... 158
5.4.1 Summary of the process and methodology... 158
5.4.2 Investments jointly planned in 2015 ... 158
5.4.3 Additional Information ... 158
5.5 Results of Joint Planning with the DNSP Ausgrid in 2015 ... 158
5.5.1 Summary of the process and methodology... 158
5.5.2 Investments jointly planned in 2015 ... 158
5.5.3 Additional Information ... 158
5.6 Results of Joint Planning with the DNSP Endeavour Energy in 2015 ... 158
5.6.1 Summary of the process and methodology... 158
5.6.2 Investments jointly planned in 2015 ... 158
5.6.3 Additional Information ... 159
5.7 Results of Joint Planning with the DNSP ActewAGL in 2015 ... 159
5.7.1 Summary of the process and methodology... 159
5.7.2 Investments jointly planned in 2015 ... 159
5.7.3 Additional Information ... 159
5.8 Results of Joint Planning with the DNSP Powercor in 2015 ... 159
5.8.1 Summary of the process and methodology... 159
6.1 Reliability Performance ... 160
6.1.1 Performance against Feeder Category Standards ... 160
6.1.2 Performance against Individual Feeder Standards ... 160
6.2 Quality of Supply Performance ... 161
7 ASSET MANAGEMENT ... 164
7.1 Essential Energy’s asset management approach ... 164
7.1.1 Introduction ... 164
7.1.2 Asset Management Plans ... 164
7.1.3 Network Planning Strategy ... 165
7.1.4 Distribution Growth Strategy ... 165
7.1.5 Reliability Strategy ... 165
7.1.6 Power Quality Strategy ... 166
7.1.7 Bushfire Prevention Strategy ... 167
7.1.8 Environmental Management Strategy ... 167
7.1.9 Refurbishment Strategy ... 167
7.1.10 Maintenance Strategy ... 168
7.1.11 Network Operating Strategy ... 168
7.1.12 Asset Disposal Strategy ... 168
7.1.13 Delivering the Network Management Strategies ... 169
7.2 Treatment of Distribution Losses ... 169
7.3 Asset issues impacting identified system limitations... 169
7.4 Obtaining further information on the asset management strategy and methodology ... 170
8 DEMAND MANAGEMENT ... 171
8.1 Demand management activities in the preceding year ... 171
8.2 Plans for demand management and embedded generation ... 173
8.3 Issues arising from applications to connect embedded generation ... 174
8.4 Embedded Generation Connection Details ... 175
9 INVESTMENTS in METERING and INFORMATION TECHNOLOGY ... 176
9.1 Metering ... 176
9.2 Information Technology ... 177
10 REGIONAL DEVELOPMENT PLANS... 181
EXECUTIVE SUMMARY
Since 1 January 2013, the National Electricity Rules (NER) have stated that all Distribution Network Service Providers (DNSPs) operating in the national electricity market are required to:
conduct an annual planning review and publish a Distribution Annual Planning Report
(DAPR);
conduct economic assessments of potential project options under a new regulatory
investment test for distribution (RIT-D), and
implement a Demand Side Engagement Strategy to consult with and engage
non-network providers in the development and evaluation of potential solutions to identified network needs.
The annual planning review includes the planning for all assets and activities carried out by Essential Energy that would materially affect the performance of its network. This includes planning activities associated with replacement and refurbishment of assets and negotiated services.
The objective of the annual planning review is to identify possible future issues that could negatively affect the performance of the distribution network to enable DNSPs to plan for and adequately address such issues in a timely manner. The outcome of the annual planning review is the Distribution Annual Planning Report (DAPR).
Essential Energy is required to prepare and publish a Distribution Annual Planning Report that is compliant with the requirements of the National Electricity Rules (Section 5.13.2 and Schedule 5.8) to:
provide transparency to Essential Energy’s decision making processes and provide a
level playing field for all regions in the national electricity market in terms of attracting investment and promoting efficient decisions;
set out the results of Essential Energy’s annual planning review, including joint planning,
covering a minimum five year forward planning period for distribution assets;
inform registered participants and interested parties on the annual planning review
outcomes - report on capacity and load forecasts for sub-transmission lines, zone substations and transmission-distribution connection points, plus, where they have been identified, any 11kV primary distribution feeders which were overloaded or forecast to be overloaded within the next two years;
provide information on Essential Energy's demand management activities and actions
taken to promote non-network initiatives each year; and plans for demand management and embedded generation over the forward planning period; and
assist non-network providers, Transmission Network Service Providers (TNSPs),
DNSPs, and connection applicants to make efficient investment decisions. The DAPR covers a minimum five year forward planning period for distribution network assets.
1
INTRODUCTION
1.1
About Essential Energy
Essential Energy is a State Owned Corporation (SOC) responsible for building, operating and maintaining Australia’s largest electricity network and delivering safe, reliable energy supplies to more than 820,000 customers.
Spanning 95 per cent of New South Wales, the company’s distribution area covers diverse terrain including humid coastal environments in the north coast, semi-arid desert in the far west, alpine peaks in the south and a grain belt that crosses central NSW from north to south.
Essential Energy is responsible for building and maintaining almost 200,000 kilometres of powerlines, around 1.4 million power poles, over 136,000 distribution substations and 333 zone substations that span a diverse geographical area.
Essential Water, an operating division of Essential Energy, delivers water services to more than 10,000 customers in Broken Hill, Menindee, Sunset Strip and Silverton and sewerage services to around 9,500 customers in Broken Hill.
Funding of the electricity distribution network is through a five-yearly distribution network revenue determination made by the Australian Energy Regulator (AER) in accordance with the National Electricity Law and National Electricity Rules economic regulatory framework.
In early 2015, Essential Energy consolidated its regions from four to three. Essential Energy’s business purpose is to be of service to our communities by efficiently distributing electricity to our customers in a way that is safe, reliable and sustainable.
1.1.1
Our Objectives
Essential Energy’s principal objectives, stated in Section 6B of the Energy Services Corporations Act 1995 No. 95 are:
(a) to be a successful business and, to this end:
to operate at least as efficiently as any comparable businesses,
to maximise the net worth of the State’s investment in it,
to exhibit a sense of social responsibility by having regard to the interests of the community in which it operates,
(b) to protect the environment by conducting its operations in compliance with the principles of ecologically sustainable development contained in section 6 (2) of the Protection of the Environment Administration Act 1991,
(c) to exhibit a sense of responsibility towards regional development and decentralisation in the way in which it operates,
(d) to operate efficient, safe and reliable facilities for the distribution of electricity and other forms of energy,
Essential Energy also has an objective to improve value for money and reduce price pressures for electricity users, through adopting measures to enhance efficiency and productivity and ensure an appropriate and cost-effective investment program.
1.1.2
Our Vision
The Essential Energy vision is to be of service to our communities by efficiently distributing electricity to our customers in a way that is safe, reliable and sustainable.
Essential Energy aims to achieve balanced commercial outcomes supporting the long term sustainability of electricity distribution in regional NSW.
Our Principal Activities
A leading provider of essential services
Operating under a decentralised regional management structure, with a recent
consolidation from four to three regional management teams responding quickly and effectively to local needs and priorities
Providing essential energy services to more than 820,000 homes and businesses across
rural and regional NSW, and water services to over 10,000 homes and businesses in Far West NSW
Maintaining almost 200,000 kilometres of power lines, around 1.4 million power poles
and over 136,000 distribution substations across a diverse geographical area
Investing in network upgrades to meet changing population and energy demands, renew
ageing assets and ensure the continued delivery of safe, reliable and affordable essential services
Transforming the electricity network through a focus on cost effective alternatives to
improve reliability, support the growth of renewable energy and make energy efficiency simpler for customers.
1.1.3
Operating Environment
Essential Energy is regulated by statutory and legislative requirements including work health and safety (WH&S), environmental, competition, industrial, consumer protection and information laws, the
National Electricity Rules, the NSW Electricity Supply Act, the Energy Services Corporations Act, and a NSW Distribution Network Service Provider licence. Essential Energy ensures compliance with these laws and regulations through its internal codes and policies and a common control framework. It comprises plans, policies, procedures, delegations, instruction and training, audits of compliance, and risk management.
Essential Energy is subject to the National Electricity Law (NEL) and National Electricity Rules (NER) which regulate the National Electricity Market. As a NSW Statutory State Owned Corporation and NSW Energy Services Corporation, Essential Energy is generally subject to most of the statutory and other legal requirements as other businesses. Essential Energy operates in the National Electricity Market (NEM) as a Distribution Network Service Provider (DNSP). Essential Energy is also required to follow government and regulatory direction. Locally the NSW Government Industry and Investment NSW department (IIN - Legislative framework) mandates the Network Design, Reliability and Performance Licence Conditions. The Independent Pricing and Regulatory Tribunal (IPART - Electricity) is responsible for administering licensing within the NSW energy industry and monitoring compliance with licence requirements. The Australian Energy Regulator (AER) regulates the transmission and distribution sectors of the National Electricity Market under the National Electricity Laws and National Electricity Rules.
1.1.4
Essential Energy statistics
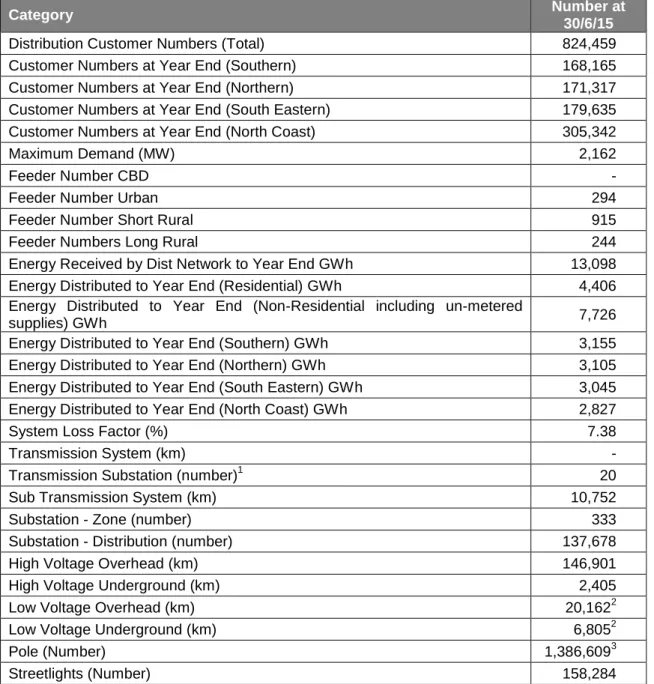
Table 1 - Essential Energy Statistics for the 2014/15 Financial Year
Category Number at
30/6/15
Distribution Customer Numbers (Total) 824,459
Customer Numbers at Year End (Southern) 168,165
Customer Numbers at Year End (Northern) 171,317
Customer Numbers at Year End (South Eastern) 179,635
Customer Numbers at Year End (North Coast) 305,342
Maximum Demand (MW) 2,162
Feeder Number CBD -
Feeder Number Urban 294
Feeder Number Short Rural 915
Feeder Numbers Long Rural 244
Energy Received by Dist Network to Year End GWh 13,098
Energy Distributed to Year End (Residential) GWh 4,406
Energy Distributed to Year End (Non-Residential including un-metered
supplies) GWh 7,726
Energy Distributed to Year End (Southern) GWh 3,155
Energy Distributed to Year End (Northern) GWh 3,105
Energy Distributed to Year End (South Eastern) GWh 3,045
Energy Distributed to Year End (North Coast) GWh 2,827
System Loss Factor (%) 7.38
Transmission System (km) -
Transmission Substation (number)1 20
Sub Transmission System (km) 10,752
Substation - Zone (number) 333
Substation - Distribution (number) 137,678
High Voltage Overhead (km) 146,901
High Voltage Underground (km) 2,405
Low Voltage Overhead (km) 20,1622
Low Voltage Underground (km) 6,8052
Pole (Number) 1,386,6093
Streetlights (Number) 158,284
1.2
Essential Energy’s Network
Essential Energy’s network is unique in terms of the geographic area it covers, the terrain it traverses, the vegetation that grows within it and the diversity of weather that impacts it. The scale of
Network Service Provider in Australia. Its core business is the distribution of electricity to customers in a specified geographical boundary of New South Wales and authorised supply areas of Queensland and Victoria.
It is important to understand the scale of assets Essential Energy must manage, and acknowledge that the majority of costs associated with electricity distribution are not driven by the number of customers or their demand on the network. Rather, network costs are driven by the number of assets required to deliver electricity to each customer. Whether there are 50 customers connected to one pole or 50 poles connecting one customer, each asset needs to be inspected, safely maintained, and replaced at the end of its life.
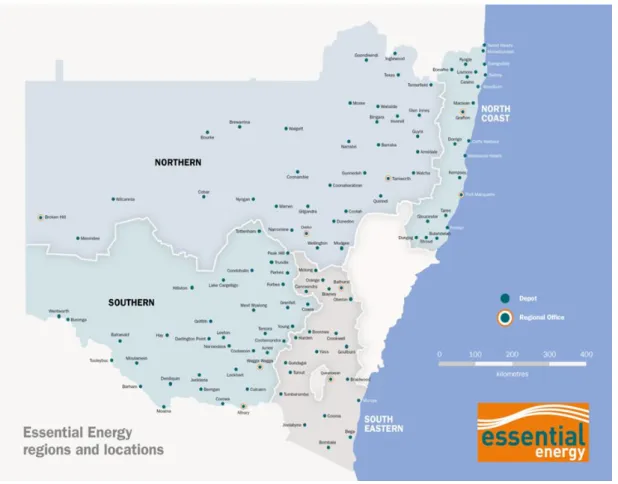
Essential Energy’s franchise area, as shown in Figure 1, covers approximately 737,000 km², or 95 per cent of New South Wales, with over 820,000 network customers. The electricity distribution network is one component of an integrated system by which electricity is generated, transmitted and then distributed to customers. The network has a large number of asset types across different voltage levels, and customers can be connected at any voltage level from 132kV down to low voltage (400/230 volts) depending on their power needs.
Electrical loads on the network range from large single customers, such as gold and coal mines, cotton gins, abattoirs, feedlots, irrigation pumps, shopping complexes, to urban commercial and residential centres, as well as rural farms, villages and remote Single Wire Earth Return (SWER) connected customers.
Figure 2 - The consolidation of Essential Energy’s regions occurred on 6 October 2015.
1.2.1
Number and Types of Distribution Assets
Essential Energy’s network consists of almost 200,000 kilometres of subtransmission, high voltage distribution, low voltage distribution power lines, and around 1.4 million poles. This network of “wires” is predominantly an overhead system that traverses terrain varying from coastal, alpine and mountainous in the east to the open plains in the west, and is exposed to a variety of extreme climatic conditions.
The majority of the rural distribution network is radial in nature with most parts only able to be supplied from one source. There is little opportunity for interconnection with other circuits for security and continuation of supply when performing maintenance activities or in the event of unplanned outages. This is equally true of the radial 132 kV and 66 kV subtransmission networks.
Due to the low customer densities found throughout the rural network, capital expenditure cannot generally be justified to improve this situation. Essential Energy is however committed to continually reviewing the reliability of its network in all parts of its supply area with a view to utilising available technologies and appropriate practices to provide the maximum reliability and security of supply possible within these constraints.
Table 2 - Network Assets at 30 June 2015
ASSETS
Circuit kilometres Transformers
Overhead lines Underground
cables Number Nominal capacity (MVA) 220kV 3.0 - - - 132kV 2081.6 9.8 80 3117.5 110kV 21.0 - 3 300.0 66kV 7607.5 33.1 401 5496.6 33kV 5335.2 46.9 1513 1612.0 22kV 42433.5 317.2 34287 2443.1 11kV and below 70423.3 2062.9 91621 6990.2
SWER (all voltages) 29686.9 38.9 8689 141.7
Low voltages4 26069.0 6217.1 - -
Total network 183661.0 8725.9 136594 20101.15
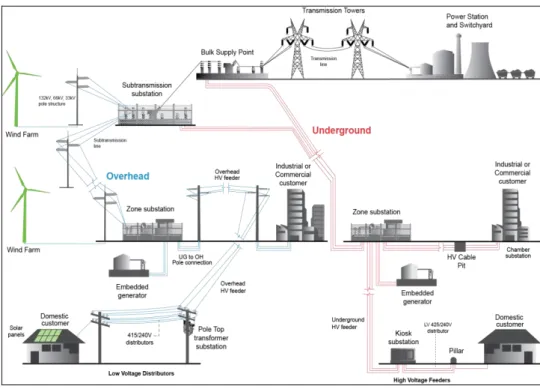
Figure 3 - Typical components of Essential Energy's electricity network
1.3
Annual Planning Review
The NER require that the Annual Planning Review includes the planning for all assets and activities carried out by Essential Energy that would materially affect the performance of its network. This includes planning activities associated with replacement and refurbishment of assets and negotiated services. The objective of the Annual Planning Review is to identify possible future issues that could adversely impact the performance of the distribution network to enable DNSPs to plan for and
4 Includes services
adequately address such issues in a timely manner. The outcome of the Annual Planning Review is the Distribution Annual Planning Report (DAPR).
This Distribution Annual Planning Report provides information to Registered Participants and interested parties on the nature and location of emerging constraints on Essential Energy’s subtransmission and 11kV distribution network assets, commonly referred to as the Distribution Network. The timely identification and publication of emerging network constraints allows the market to identify potential non-network solutions and Essential Energy to develop and implement appropriate and timely solutions to them.
1.3.1
Network planning process
The planning and development process for the distribution network is carried out in accordance with the National Electricity Rules (NER) Chapter 5 Part B Planning and Expansion.
Essential Energy carries out network planning at both a strategic and project level. The processes used for each of these levels of network planning are set out in the Essential Energy “Subtransmission and Distribution Network Planning Criteria and Guidelines” stored in Essential
Energy’s Business Management System. The Essential Energy investment governance process ensures continuous review and assurance that capital prudence and efficiency are being achieved, as well as being consistently and seamlessly aligned with longer term strategic planning.
The Essential Energy network planning process is designed to identify the most efficient ways of ensuring the network business meets its network performance obligations. Significant emphasis is placed on the planning and project identification stage, assessing customer supply needs, identifying and selecting the optimal solution to meet those needs, and provide the most pragmatically prudent and efficient outcome.
All relevant potential credible options, including non-network and operational alternatives are considered in determining how to best meet network performance obligations and the objectives of the National Electricity Law.
There is a robust selection process based on Present Value of Cost options analyses together with a range of sensitivity analyses that explicitly trade off alternative investment options using quantified estimates for credible option costs and market benefits, against business performance targets, to identify the optimum portfolio of projects that minimises the cost of achieving desired performance. In accordance with NER obligations and statutory requirements, network augmentation and demand management options are assessed impartially, using a consistent cost effectiveness review process. Demand management options are evaluated on the extent to which they can avoid or defer the need for network augmentation.
This allows various combinations of demand management and deferred augmentation projects to be assessed. The requirement to consider demand management and non-network option solutions to address identified network needs is included in Chapter 5 Part B Network Planning and Expansion section of the NER.
The first stage of the network planning process involves the gathering of all data required to inform the investment process. This includes historical and existing peak demands, the preparation of a range of seasonal demand forecasts, examining network capacity limits, assessing asset condition, forecasting new customer connections (including new or augmented ‘spot’ loads and/or embedded
When emerging network limitations are identified, a range of feasible options including both network and non-network solutions are developed to address the network need and to ensure continuing compliance. A rigorous review then selects the most economic option (or options). Each network capital investment is required to be consistent with Essential Energy’s longer term network plans and standards whilst being compliant with the National Electricity Law objective.
This Distribution Annual Planning Report seeks to inform stakeholders and provides advice on emerging network limitations and network adequacy. It also provides details of the expected time required to allow appropriate corrective network augmentation, non-network alternatives or modifications to connection facilities.
The Essential Energy network planning approach is outlined in its Network Management Plan and is
consistent with the principles of the NSW Government Total Asset Management framework.
Essential Energy is required to comply with mandatory service standards in accordance with the
Reliability and Performance Licence Conditions for Electricity Distributors (July 2014), imposed by the NSW Minister for Energy. These Licence Conditions facilitate the delivery of a safe and reliable supply of electricity.
This document provides information for locations where investment is required to address network limitations due to forecast demand and other prudent inseparable considerations.
1.4
Significant changes from previous DAPR
The majority of the 2015 DAPR consists of only minor changes, though there has been a major focus placed on redeveloping the forecasting process to use a nationally consistent methodology. The new methodology is explained in detail in Section 2.2.
1.4.1
Analysis and explanation of forecast changes
Overall network load is expected to increase at a steady rate, however as to be expected, the recorded demand has allowed for refinement of the previous forecasts over the next five years. At the subtransmission and zone substation level, forecasts have also been adjusted to account for expected load transfers for new and decommissioned sites.
There have been a number of changes to Essential Energy’s network including the addition of new zone substations and subtransmission lines, these may affect the recorded loads on the existing system based on various load transfers.
The methodology used to generate Zone Substation forecasts has seen substantial change toa more
complex, repeatable process, closely aligned with the AEMO connection point forecasting methodology. This change in methodology is detailed in Section 2.2, and is evident with minor variations in Subtransmission Substation (STS) and Zone Substation (ZS) forecasts compared to previous years.
1.4.2
Analysis and explantion of changes in other information
There are some minor variations in this document attributed to equipment classifications. These changes enable the published data to align with the annual Regulatory Information Notice.
2
FORECASTS for the FORWARD PLANNING PERIOD
This section provides a detailed assessment of the current peak demand forecast process.
The peak demand forecasts provide Essential Energy with the basis for identifying network limitations, identifying and evaluating the credible network and non-network options to address those limitations and (if applicable) commencing the RIT-D process. It also feeds into the strategic asset management plan which documents the capital and operating investment expected to be required for the forward planning period.
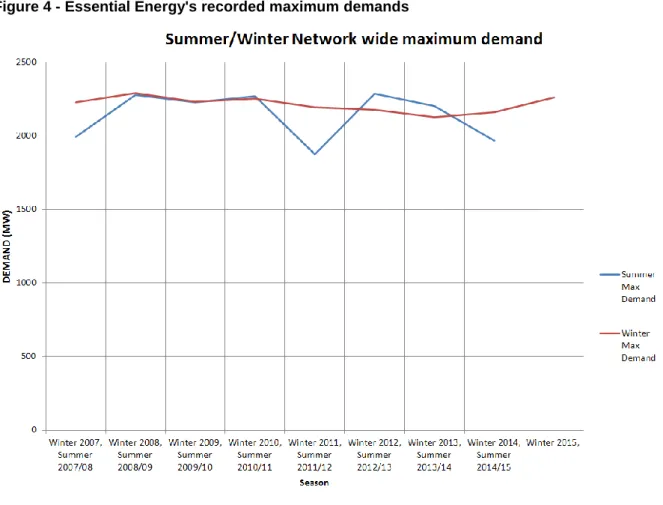
Essential Energy’s Network System peak demand for the 2015 Winter peaked at 2,259 megawatts (MW) at 6:30 pm (EDST) on Thursday 16 July 2015.
Figure 4 - Essential Energy's recorded maximum demands
2.1
Load Forecasting Strategy
A primary driver in the development of the network and the identification of specific projects is the forecast of electricity demand and energy. The spatial demand forecast is a critical process which supports planning, development of the capital program and the regulatory submission.
(such as minimal weather correction and reconciliation between top-down and bottom up forecasts) which required a high level of subjectivity to a more complex, repeatable process, closely aligned with the AEMO connection point forecasting methodology.
2.2
Load Forecasting Methodology and Process
The forecasting methodology has been developed and refined using two main vision items as the driving force, these items are:
That the demand forecasting process undertaken is commensurate with the benefits the
forecast provides
That all demand forecasts are auditable and repeatable.
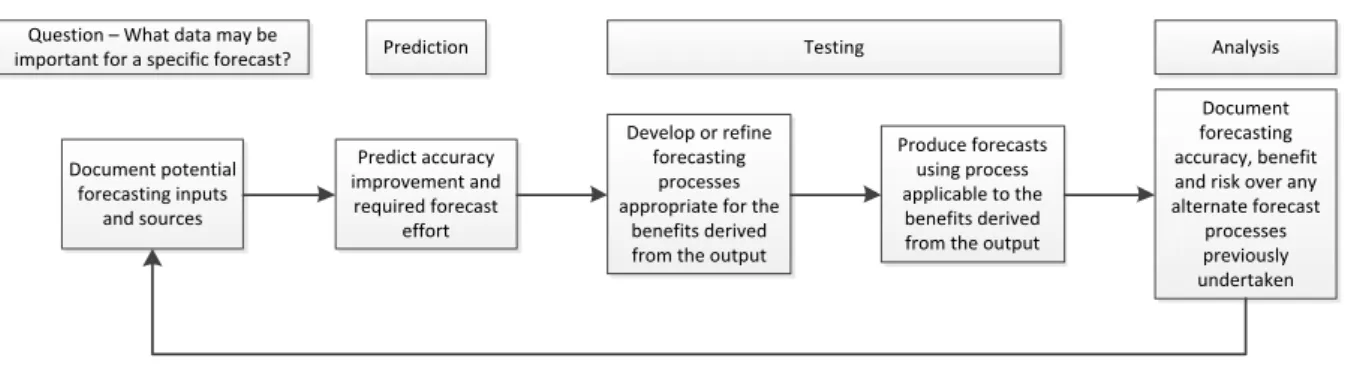
Essential Energy has developed a methodology which provides for the establishment of the building blocks required to achieve this vision, this methodology is summarised in Figure 5.
Figure 5 - Forecasting Methodology
Develop or refine forecasting
processes appropriate for the
benefits derived from the output Predict accuracy improvement and required forecast effort Document potential forecasting inputs and sources Produce forecasts using process applicable to the benefits derived from the output
Document forecasting accuracy, benefit and risk over any alternate forecast
processes previously undertaken Question – What data may be
important for a specific forecast? Prediction Testing Analysis
As shown in Figure 5, Essential Energy’s methodology calls for continuous improvement in the forecasting process specific to the site in question and dependant on the predicted cost/benefit, as an example some sites may have poor input data and hence poor forecasting accuracy, however if no benefits can be identified from improving the forecast then the cost to improve the process cannot be justified and the forecast inaccuracy specific to the site in question will remain, alternatively high benefits (such as capital deferral) would justify substantial forecasting effort and the appropriate level of expense and rigour.
To assist in the network planning process and to identify regional growth patterns, several levels of forecast are used by Essential Energy:
Overall Essential Energy network forecast
Regional TransGrid and Powerlink connection point forecast
Subtransmission feeder forecast
Zone Substation forecasts
Local distribution feeder forecasts as necessary.
The base forecasting process used by Essential Energy is fundamentally the same as AEMO’s published Connection Point Forecasting Methodology6.
At a high level, the process consists of:
Data collection and collation
To cater for regional and local needs, a forecast of the demand at each zone substation is developed based on historical demands and information provided by major customers. Account is taken of load diversity between connection points. Embedded generation is recognised and included in the forecast where it offers firm capacity at the time of demand
Outlier removal / Data preparation
In order to ensure only system normal conditions are evaluated, this may include the removal of large customers, etc
Temperature correction (or normalisation)
In order to provide a reference set of conditions from which each year can be compared (with a probability of exceedance of 50 per cent)
Repeat for each season over the time periods available
The forecast covers both summer and winter demands and uses data going back to 2004 where possible
Determine the most applicable growth rate based on known variables
Growth rates can be applied using residential growth rates or similar
Calculate forecast load
The forecast extends over a planning horizon of five to ten years
Apply any post model adjustments
Where there is known potential for the connection of major spot load developments such as mining loads and major subdivisions, the forecast takes into account any reasonably firm step load increases in the medium term. Where the impacts of government policy decisions of technological developments can be determined, Essential Energy endeavours to include an appropriate adjustment factor
Reconciliation of forecasts
Calculation to ensure the forecast aligns with previously developed forecasts for upstream and downstream network components
2.2.1
Sources of load forecast input information
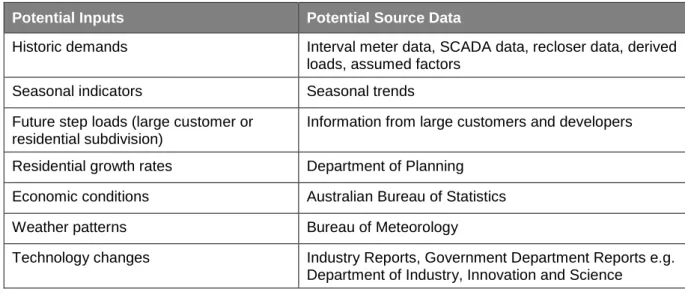
Potential inputs to an individual forecast and the applicable source data may include:
Table 3 – Potential sources of load forecast input information
Potential Inputs Potential Source Data
Historic demands Interval meter data, SCADA data, recloser data, derived
loads, assumed factors
Seasonal indicators Seasonal trends
Potential Inputs Potential Source Data
Generation Interval meter data, Bureau of Meteorology, customer
information
Individual customer demands Interval meter data
Regulatory variation AER documentation, MEPS reports, other government
initiatives
Distribution changes Network information (planning, operations, load control)
Distribution programs Network program information (planning, load control)
Tariff changes Network Tariff information
2.2.2
Assumptions applied to load forecasts
Numerous assumptions are required in order to streamline the forecasting process. Some of these include:
All large customers, embedded generations are recorded appropriately
Historic demand data used for summer forecasts comprise the high temperature days
from months November to March inclusive while winter forecasts consider the low temperature days from months May to September
All load information is actual (i.e. no erroneous readings, metering drift, etc)
All switching events are recorded or easily detected in analysis
All temperature related data is actual
The selected temperate sites are the best currently available to Essential Energy for
representation of the conditions at the load sites
All historic network changes have been accounted for
Information provided by large load customers and developers will come to fruition
Subtransmission Feeder forecasts are a special case, using a proportion of the Bulk
Supply point forecast rather than an actual forecast, hence subtransmission forecasts may not reconcile to Zone Substation forecasts
Site forecasts are performed individually; consequently there may be deviations to
2.3
North Coast
2.3.1
Terranora Supply Area
2.3.1.1
Description of Terranora area
The Terranora subtransmission substation is owned by Essential Energy and is supplied from the Queensland transmission system via 2 x 110kV lines that are jointly owned by Essential Energy and Powerlink.
A high voltage direct current transmission network is connected between Mullumbimby and Terranora (via Bungalora) which allows supply to be either injected into the Lismore area from Terranora or injected into the Terranora area from Lismore.
Population growth in the Tweed Shire is one of the highest in regional NSW and is expected to remain above the state average.
TERRANORA – Identified System Limitations
SYSTEM LIMITATION Refer to DAPR
Section Nil
2.3.1.2
Subtransmission feeder load forecast
Line Rating Line Rating MVA 15/16 16/17 17/18 18/19 19/20 MVA 2016 2017 2018 2019 2020 757 110 Powerlink Mudgeeraba 275/110kV STS Terranora 110/66kV STS 106 39.3 39.8 39.8 40.3 40.3 126 40.3 40.8 40.8 41.3 41.3 758 110 Powerlink Mudgeeraba 275/110kV STS Terranora 110/66kV STS 106 39.3 39.8 39.8 40.3 40.3 126 40.3 40.8 40.8 41.3 41.3 9501 66 Terranora 110/66kV STS Cudgen ZS 59 20.0 20.3 20.3 20.5 20.5 66 21.1 21.3 21.3 21.6 21.6 9502 66 Terranora 110/66kV STS Murwillumbah ZS 61 8.9 9.0 9.0 9.1 9.1 68 9.3 9.4 9.4 9.5 9.5 9503 66 Terranora 110/66kV STS Banora Pt ZS 59 26.5 26.8 26.8 27.2 27.2 66 26.3 26.6 26.6 27.0 27.0 9504 66 Terranora 110/66kV STS Condong Sw Stn 61 7.7 7.8 7.8 7.9 7.9 68 8.0 8.1 8.1 8.2 8.2
9505 66 Cudgen ZS Banora Point ZS 53 2.1 2.2 2.2 2.2 2.2 59 1.2 1.2 1.2 1.2 1.2
9508 66 Terranora 110/66kV STS Tweed Heads ZS 41 13.1 13.3 13.3 13.5 13.5 46 11.9 12.0 12.0 12.2 12.2
9510 66 Banora Point ZS Tweed Heads South
ZS 49 16.1 16.3 16.3 16.5 16.5 55 13.4 13.6 13.6 13.7 13.7
9514 66 Condong Sw Stn Murwillumbah ZS 61 7.8 7.9 7.9 8.0 8.0 68 8.1 8.2 8.2 8.3 8.3
9516 66 Tweed Head South ZS Tweed Heads ZS 49 3.9 4.0 4.0 4.0 4.0 55 1.2 1.2 1.2 1.2 1.2
9406 33 Cudgen ZS Casuarina Sw Stn 19 9.4 9.5 9.7 9.8 9.9 21 10.5 10.6 10.6 10.7 10.7
Line Forecast MVA Line Forecast MVA
Summer
Feeder # Feeder
Voltage kV Feeder Origin Feeder Destination
2.3.1.3
STS and ZS load forecast
SUMMER Terranora Supply Area POE50 Indicative Demand Forecast
Tx.1 Tx.2 Tx.3 15/16 16/17 17/18 18/19 19/20 Banora Point 66/11 24/30 24/30 33 0.99 12.1 11.7 11.4 11.2 10.9 4.24 3 Cudgen 11kV 66/33/11 70/40/30 70/40/30 33 1.00 11.5 11.7 11.8 11.9 12.0 3.10 7 Cudgen 33kV 66/33/11 70/40/30 70/40/30 44 0.99 9.3 9.3 9.4 9.4 9.4 0.00 7 Hastings Point 33/11 15 15/18 16.5 0.98 9.4 9.5 9.7 9.8 9.9 3.58 5 Murwillumbah 66/11 15/20/25 15/20/25 27.5 0.94 15.7 15.6 15.5 15.4 15.3 5.96 8 Terranora 110/66kV 110/66 70/100 70/100 70/100 220 1.00 82.5 82.3 82.1 82.0 81.8 0.00 6 Terranora 11kV 66/11 24/30 24/30 33 0.98 4.4 4.3 4.3 4.2 4.2 2.32 3 Tweed Heads 66/33 25 25 27.5 0.95 17.3 17.1 16.9 16.7 16.5 1.03 31
Tweed Heads South 66/11 20/30 20/30 33 0.97 15.1 15.0 14.9 14.9 14.8 3.88 51
WINTER Terranora Supply Area POE50 Indicative Demand Forecast
Tx.1 Tx.2 Tx.3 2016 2017 2018 2019 2020 Banora Point 66/11 24/30 24/30 36 1.00 12.5 12.2 12.0 11.7 11.5 4.24 6 Cudgen 11kV 66/33/11 70/40/30 70/40/30 36 1.00 12.3 12.4 12.4 12.5 12.5 3.10 5 Cudgen 33kV 66/33/11 70/40/30 70/40/30 48 1.00 10.6 10.6 10.6 10.5 10.5 0.00 2 Hastings Point 33/11 15 15/18 18 0.99 10.5 10.6 10.6 10.7 10.7 3.58 6 Murwillumbah 66/11 15/20/25 15/20/25 30 0.97 16.0 15.8 15.6 15.4 15.3 5.96 7 Terranora 110/66kV 110/66 70/100 70/100 70/100 240 0.99 72.9 72.9 72.9 72.9 72.9 0.00 4 Terranora 11kV 66/11 24/30 24/30 36 1.00 5.7 5.6 5.5 5.4 5.3 2.32 6 Tweed Heads 66/33 25 25 30 0.96 14.3 14.2 14.1 14.0 14.0 1.03 3
Tweed Heads South 66/11 20/30 20/30 36 0.99 14.3 14.5 14.7 14.9 15.1 3.88 80 Embedded Solar PV (MVA) 95% Peak Load Exceeded (Hrs)
Substation kV Transformer Rating (MVA)
Firm Dynamic Rating (MVA) Forecast PF
Forecast (MVA) Embedded
Solar PV (MVA) 95% Peak Load Exceeded (Hrs) Substation kV
Transformer Rating (MVA) Dynamic Firm
Rating (MVA)
Forecast PF
2.3.1.4
Subtransmission Single Line Diagram of Terranora area
3 3 /1 1 kV E ss e ntial E ne rg y Zone Su bsta tions E ss e ntial E ne rg y Tra ns miss ion & Sub -t ra ns miss ion Line sTWEED
T we ed H eads Ba n o ra P o in t M u rwil lu mbah C u d g en TE RRA NORA M u d g eer ab a (Q ld ) E n er g ex 3 3 kV K ir ra n .o . Po we rl in k E ss en ti al E n er g y -Q ld bo rd er d o u b le -ci rcu it 110kV H ast in g s Po in t 1 1 0 /6 6 /1 1 kV 6 6 /3 3 /1 1 kV D ir ect Li n k (M u llu mbi mby ) (n o te 3) 6 6 /1 1 kV C o n d o n g Sw St n T we ed H eads So u th G C on do n g C o -ge n er at io n e 66kV 110kV 33kV 757 9501 9505 9510 9516 9508 9502 9409 9406 9504 9514 9407 758 9503 E n er g y o wn s th e NSW si d e o f do u bl e ci rcu it ( 7 5 7 ,7 5 8 ), k o wn s th e Q LD si d e ta ke b ack u p su p p ly f ro m E n er g y at t h ei r K ir ra n d u ri n g co n ti n g en ci es o n t h ei r st em k is p ri va tel y o wn ed (n o te 1 ) (n o te 2) 6 6 kV Sw it ch in g St at io n n ver ter Bu n g al o ra 99012.3.2
Lismore Supply Area
2.3.2.1
Description of Lismore area
The Lismore 132/66kV subtransmission substation is owned by Essential Energy. It receives its supply via three Essential Energy 132kV lines from the TransGrid 330/132kV subtransmission substation at Lismore.
A high voltage direct current transmission network is connected between Mullumbimby and Terranora (via Bungalora) which allows supply to be either injected into the Lismore area from Terranora or injected into the Terranora area from Lismore.
LISMORE – Identified System Limitations
SYSTEM LIMITATION Refer to DAPR
Section Nil
2.3.2.2
Subtransmission feeder load forecast
Line Rating Line Rating MVA 15/16 16/17 17/18 18/19 19/20 MVA 2016 2017 2018 2019 20209U8 132 TransGrid Lismore
330/132 STS Lismore 132/66kV STS 183 44.2 44.2 45.0 45.0 45.0 214 47.4 47.4 47.7 47.7 48.1
9U9 132 TransGrid Lismore
330/132 STS Lismore 132/66kV STS 128 40.9 40.9 41.6 41.6 41.6 143 43.9 43.9 44.2 44.2 44.5
9W1 132 TransGrid Lismore
330/132 STS Lismore 132/66kV STS 128 37.8 37.8 38.5 38.5 38.5 143 40.6 40.6 40.9 40.9 41.2
9G2 132 Ballina ZS Lennox Head ZS 124 9.7 9.7 9.9 9.9 9.9 139 9.5 9.5 9.5 9.5 9.6
9G3 132 Lennox Head ZS Suffolk Park ZS 124 13.0 13.0 13.3 13.3 13.3 139 13.8 13.8 13.9 13.9 14.0
9G4 132 Suffolk Park ZS Ewingsdale ZS 124 18.2 18.2 18.5 18.5 18.5 139 19.9 19.9 20.1 20.1 20.2
9G5 132 Ewingsdale ZS Mullumbimby ZS 122 31.7 31.7 32.3 32.3 32.3 137 37.8 37.8 38.1 38.1 38.4
9U6 132 Lismore 132/66kV STS Mullumbimby ZS 107 20.0 20.0 20.3 20.3 20.3 123 24.2 24.2 24.4 24.4 24.6
9U7 132 Lismore 132/66kV STS Dunoon ZS 107 22.6 22.6 23.0 23.0 23.0 123 27.0 27.0 27.2 27.2 27.4
9U7/1 132 Dunoon ZS Mullumbimby ZS 107 17.4 17.4 17.7 17.7 17.7 123 21.3 21.3 21.5 21.5 21.6
892 66 Lismore 132/66kV STS Woodburn ZS 11 5.5 5.5 5.5 5.5 5.5 19 6.1 6.1 6.1 6.1 6.1
893 66 Lismore 132/66kV STS Casino ZS 38 0.0 0.0 0.0 0.0 0.0 43 0.0 0.0 0.0 0.0 0.0
894:LME 66 Lismore 132/66kV STS Kyogle ZS 11 7.1 7.1 7.1 7.1 7.1 19 6.4 6.3 6.2 6.2 6.1
0897:LME 66 Lismore 132/66kV STS Alstonville ZS 62 15.5 15.5 15.8 15.8 15.8 69 17.7 17.7 17.8 17.8 18.0
8502 66 Lismore East ZS Alstonville ZS 62 8.2 8.2 8.4 8.4 8.4 69 9.9 9.9 10.0 10.0 10.1
8503 66 Ballina ZS Alstonville ZS 62 7.2 7.2 7.3 7.3 7.3 69 7.9 7.9 7.9 7.9 8.0
8507 66 Alstonville ZS Ballina ZS 61 8.3 8.3 8.5 8.5 8.5 68 9.2 9.2 9.2 9.2 9.3
8510 66 Lismore Sw Stn East Lismore ZS 61 18.7 18.7 19.0 19.0 19.0 68 21.1 21.1 21.3 21.3 21.5
8511 66 Lismore 132/66kV STS Lismore Sw Stn 62 16.4 16.4 16.7 16.7 16.7 69 17.5 17.5 17.7 17.7 17.8
8512 66 Lismore Sw Stn Lismore University ZS 54 8.0 8.0 8.0 8.0 8.0 54 6.9 6.8 6.7 6.6 6.5
8513 66 Lismore Sw Stn Lismore University ZS 54 8.0 8.0 8.0 8.0 8.0 54 6.9 6.8 6.7 6.6 6.5
8514 66 Lismore 132/66kV STS South Lismore ZS 68 11.6 11.4 11.2 11.0 10.8 68 8.0 7.9 7.7 7.6 7.6
8515 66 Lismore 132/66kV STS South Lismore ZS 68 11.5 11.3 11.1 10.9 10.7 68 7.9 7.8 7.6 7.5 7.5
8516 66 Lismore 132/66kV STS Lismore Sw Stn 62 16.3 16.3 16.6 16.6 16.6 69 17.4 17.4 17.6 17.6 17.7
Line Forecast MVA Line Forecast MVA
Summer
Feeder # Feeder
Voltage kV Feeder Origin Feeder Destination
Winter
2.3.2.3
STS and ZS load forecast
SUMMER Lismore Supply Area POE50 Indicative Demand Forecast
Tx.1 Tx.2 Tx.3 15/16 16/17 17/18 18/19 19/20 Alstonville 66/11 20 16/20 22 0.99 8.4 8.2 8.1 8.1 8.0 4.03 2 Ballina 66/11 30 30 33 0.98 23.0 23.2 23.3 23.4 23.5 6.53 4 Ballina 132kV 132/66 75/112 0 1.00 9.1 9.1 9.2 9.2 9.3 0.00 1 Dunoon 132/11 10 10 11 0.98 5.3 5.2 5.2 5.1 5.1 2.15 8 Ewingsdale 132/11 30/45 30/45 49.5 0.97 13.1 13.1 13.1 13.1 13.1 4.02 16 Kyogle 66/11 8/10 8/10 11 0.93 7.1 7.1 7.1 7.1 7.1 1.88 3 Lennox Head 132/11 16 16 17.6 1.00 3.6 3.6 3.5 3.5 3.5 1.93 6 Lismore 132/66kV 132/66 80/120 80/120 80/120 264 0.96 71.5 71.5 71.5 71.5 71.5 0.00 3 Lismore East 66/11 15/19/23 15/20/25 25.3 0.97 10.8 10.7 10.6 10.5 10.4 3.70 2 Lismore South 66/11 15/19/25 15/19/23 20/25 52.8 0.92 23.2 22.8 22.4 22.1 21.7 3.10 6 Lismore Uni 66/11 20/30 20/30 33 0.98 15.9 15.9 16.0 16.0 16.0 2.70 6 Mullumbimby 132/11 16 10 11 0.99 5.8 5.7 5.6 5.6 5.5 2.90 3 Suffolk Park 132/11 30 0 0.99 8.7 8.7 8.7 8.7 8.7 2.68 7 Woodburn 66/11 8/10 8/10 11 0.95 5.5 5.5 5.5 5.5 5.5 2.09 5
WINTER Lismore Supply Area POE50 Indicative Demand Forecast
Tx.1 Tx.2 Tx.3 2016 2017 2018 2019 2020 Alstonville 66/11 20 16/20 24 1.00 10.5 10.4 10.4 10.3 10.3 4.03 4 Ballina 66/11 30 30 36 0.99 23.0 23.0 23.0 23.0 23.1 6.53 7 Ballina 132kV 132/66 75/112 0 0.99 11.6 11.5 11.5 11.6 11.6 0.00 4 Dunoon 132/11 10 10 12 1.00 6.2 6.3 6.3 6.3 6.3 2.15 9 Ewingsdale 132/11 30/45 30/45 54 0.99 13.9 13.9 13.9 13.9 13.9 4.02 5 Kyogle 66/11 8/10 8/10 12 0.98 6.4 6.3 6.2 6.2 6.1 1.88 2 Lennox Head 132/11 16 16 19.2 1.00 5.3 5.2 5.2 5.1 5.1 1.93 3 Lismore 132/66kV 132/66 80/120 80/120 80/120 288 0.96 68.7 68.7 68.7 68.7 68.7 0.00 2 Lismore East 66/11 15/19/23 15/20/25 27.6 0.99 11.4 11.2 11.1 10.9 10.8 3.70 3 Lismore South 66/11 15/19/25 15/19/23 20/25 57.6 0.93 16.0 15.7 15.5 15.3 15.1 3.10 8 Lismore Uni 66/11 20/30 20/30 36 0.99 13.8 13.5 13.4 13.2 13.1 2.70 5 Mullumbimby 132/11 16 10 12 1.00 7.4 7.2 7.1 6.9 6.8 2.90 5 Suffolk Park 132/11 30 0 1.00 10.4 10.4 10.4 10.4 10.4 2.68 9 Woodburn 66/11 8/10 8/10 12 0.98 6.1 6.1 6.1 6.1 6.1 2.09 1 Embedded Solar PV (MVA) 95% Peak Load Exceeded (Hrs) Substation kV
Transformer Rating (MVA)
Firm Dynamic Rating (MVA) Forecast PF
Forecast (MVA) Embedded
Solar PV (MVA) 95% Peak Load Exceeded (Hrs)
Substation kV Transformer Rating (MVA)
Firm Dynamic Rating (MVA) Forecast PF Forecast (MVA)
2.3.2.4
Subtransmission Single Line Diagram of Lismore area
LI
SMOR
E
AND
CAS
IN
O
E win g sd al e M al la n g an ee K yo g le CA SIN O Li smo re St h Li sm o re E ast Alst o n vi lle Ba lli n a W o o d b u rn R app vi lle L IS MO RE Koo lk h an B ro adw at er Mi ll C o -ge n er at io n D u n o o n M u llu mbi mby G Len n o x H ead n .o Li smo re Un i Li smo re Sw St n D ir ect Li n k (Bu n g al o ra ) 3 2 kV Grid Su bs C o ff s H ar b o u r K o o lk h an E ss e ntial E ne rg y Zone Subs tat ions e at o r 132kV Tra ns miss ion & Sub -t ra ns miss ion Line s E ss enti a l E ner gy 330kV T ra ns G ri d 132kV 66kV 33kV 1 3 2 /6 6 /1 1 kV 1 3 2 /6 6 kV 1 3 2 /1 1 kV 1 3 2 /6 6 /3 3 /1 1 kV 6 6 /1 1 kV 6 6 kV Sw it ch in g St at io n 3 3 /1 1 kV No tes 1) D ir ect lin k is p ri va tel y o wn ed 9 G3 8503 8507 8502 0 8 9 7 :L M E 0892 0 8 9 4 :L M E 9 U6 6501 0893 8510 8516 9 U7 8401 (n o te 1 ) 8511 0 8 9 2 /1 9 W 1 9 U8 9 U9 967 96L 89 g an ee or 8515 8514 Su ff o lk P ar k 9 G2 9 G4 9 G5 8512 8513 n .o n .o2.3.3
Casino Supply Area
2.3.3.1
Description of Casino area
The Casino area subtransmission system is supplied from the Essential Energy 132/66kV subtransmission substation at Casino which is teed off the TransGrid 132kV Tenterfield to Lismore line. On loss of the single 132/66kV transformer, 66kV supply reverts to Lismore 132/66kV substation via the Lismore – Casino 66kV line (0893).
CASINO – Identified System Limitations
SYSTEM LIMITATION Refer to DAPR
Section Nil
2.3.3.2
Subtransmission feeder load forecast
Line Rating Line Rating MVA 15/16 16/17 17/18 18/19 19/20 MVA 2016 2017 2018 2019 2020 96L 132 Transgrid Casino 132kV 96L Tee Casino ZS 140 25.8 25.8 25.8 25.8 25.8 157 22.4 22.4 22.4 22.4 22.4
6501 66 Casino ZS Rappville Tee 16 1.0 1.0 1.0 1.0 1.0 25 0.9 0.9 0.9 0.9 0.9
8401 33 Casino ZS Mallanganee ZS 4 3.3 3.3 3.3 3.3 3.3 6 3.0 3.0 3.0 3.0 3.0
8402 33 Mallanganee ZS Bonalbo ZS 4 2.0 2.0 2.0 2.0 2.0 6 1.8 1.8 1.8 1.8 1.8
8403 33 Bonalbo ZS Urbenville ZS 4 1.0 1.0 1.0 1.0 1.0 7 1.1 1.1 1.1 1.1 1.1
Line Forecast MVA Line Forecast MVA
Summer
Feeder # Feeder
Voltage kV Feeder Origin Feeder Destination
Winter
2.3.3.3
Subtransmission Substation and Zone Substation load forecast
SUMMER Casino Supply Area POE50 Indicative Demand Forecast
Tx.1 Tx.2 Tx.3 15/16 16/17 17/18 18/19 19/20 Bonalbo 33/11 3 2.5 2.75 0.90 0.7 0.7 0.7 0.7 0.7 0.18 6 Casino 132/66kV 132/66 35/45/60 0 0.97 25.8 25.6 25.3 25.0 24.8 0.00 6 Casino 66/11kV 66/11 20/30 20/30 33 0.98 24.0 24.8 24.7 24.5 24.3 3.60 7 Casino 66/33kV 66/33 8 3.5 3.85 0.97 2.7 2.7 2.7 2.7 2.6 0.00 7 Mallanganee 33/11 5/8 2.5 2.75 0.98 1.1 1.1 1.1 1.1 1.1 0.24 4 Rappville 66/11 5/6.25 5 5.5 0.96 0.8 0.7 0.7 0.6 0.6 0.17 1 Urbenville 33/11 8 2.5 2.75 0.96 0.7 0.7 0.7 0.7 0.7 0.18 7
WINTER Casino Supply Area POE50 Indicative Demand Forecast
Tx.1 Tx.2 Tx.3 2016 2017 2018 2019 2020 Bonalbo 33/11 3 2.5 3 0.90 0.6 0.6 0.6 0.6 0.6 0.18 7 Casino 132/66kV 132/66 35/45/60 0 1.00 20.5 20.4 20.4 20.3 20.3 0.00 12 Casino 66/11kV 66/11 20/30 20/30 36 1.00 18.5 19.4 19.3 19.3 19.2 3.60 8 Casino 66/33kV 66/33 8 3.5 4.2 0.99 2.8 2.8 2.8 2.8 2.8 0.00 16 Mallanganee 33/11 5/8 2.5 3 1.00 1.2 1.2 1.2 1.2 1.2 0.24 21 Rappville 66/11 5/6.25 5 6 0.98 0.9 0.9 0.9 0.9 0.9 0.17 9 Urbenville 33/11 8 2.5 3 0.99 0.8 0.8 0.8 0.8 0.8 0.18 3 Embedded Solar PV (MVA) 95% Peak Load Exceeded (Hrs) Substation kV
Transformer Rating (MVA)
Firm Dynamic Rating (MVA) Forecast PF
Forecast (MVA) Embedded
Solar PV (MVA) 95% Peak Load Exceeded (Hrs)
Substation kV Transformer Rating (MVA)
Firm Dynamic Rating (MVA) Forecast PF Forecast (MVA)
2.3.4
Grafton Supply Area
2.3.4.1
Description of Grafton area
The Grafton area subtransmission system is supplied from the TransGrid 132/66kV subtransmission substation at Koolkhan.
GRAFTON – Identified System Limitations
SYSTEM LIMITATION Refer to DAPR
Section Nil
2.3.4.2
Subtransmission feeder load forecast
Line Rating Line Rating MVA 15/16 16/17 17/18 18/19 19/20 MVA 2016 2017 2018 2019 2020 825 66 TransGrid Koolkhan 132/66kV STS Koolkhan ZS 62 17.9 17.9 17.9 17.9 17.9 69 16.4 16.4 16.4 16.4 16.4 826 66 TransGrid Koolkhan 132/66kV STS Grafton North ZS 61 14.6 14.6 14.6 14.6 14.6 68 13.0 13.0 13.0 13.0 13.0
6503 66 Grafton North ZS South Grafton ZS 14 9.5 9.5 9.5 9.5 9.5 21 7.6 7.6 7.6 7.6 7.6
6504 66 Five Mile Sw Stn South Grafton ZS 61 4.1 4.1 4.1 4.1 4.1 68 3.3 3.3 3.3 3.3 3.3
6505 66 Koolkhan SS Grafton ZS 52 15.9 15.9 15.9 15.9 15.9 58 14.1 14.1 14.1 14.1 14.1
6506 66 Shannon Creek ZS Nymboida ZS 14 0.3 0.3 0.3 0.3 0.3 21 0.4 0.4 0.4 0.4 0.4
6508 66 Maclean ZS Yamba ZS 28 9.3 9.3 9.2 9.2 9.2 32 10.2 10.1 10.1 10.0 10.0
6509 66 Shannon Creek ZS Five Mile Sw Stn 14 1.1 1.1 1.1 1.1 1.1 21 1.1 1.1 1.1 1.1 1.1
6510 66 Grafton North ZS Five Mile Sw Stn 15 5.2 5.2 5.2 5.2 5.2 25 4.1 4.1 4.1 4.1 4.1
896:MLN 66 TransGrid Koolkhan
132/66kV STS Maclean ZS 21 8.5 8.5 8.5 8.5 8.5 25 7.9 7.9 7.9 7.9 7.9
8G1 66 TransGrid Koolkhan
132/66kV STS Maclean ZS 68 10.9 10.9 10.9 10.9 10.9 68 10.0 10.0 10.0 10.0 10.0
6402 33 Maclean ZS Yamba Tee 8 0.4 0.4 0.4 0.4 0.4 9 0.3 0.3 0.3 0.3 0.3
6403 33 Yamba Tee Redcliff ZS 3 0.4 0.4 0.4 0.4 0.4 5 0.4 0.4 0.4 0.4 0.4
6404 33 Yamba Tee Yamba ZS 10 0.0 0.0 0.0 0.0 0.0 12 0.0 0.0 0.0 0.0 0.0
Line Forecast MVA Line Forecast MVA
Summer
Feeder # Feeder
Voltage kV Feeder Origin Feeder Destination
2.3.4.3
STS and ZS load forecast
SUMMER Grafton Supply Area POE50 Indicative Demand Forecast
Tx.1 Tx.2 Tx.3 15/16 16/17 17/18 18/19 19/20 Grafton North 66/11 24/30 15/20/25 27.5 0.98 16.3 16.2 16.2 16.1 16.1 2.80 6 Grafton South 66/11 15/19/25 15/19/24.5 26.95 0.94 17.6 17.6 17.6 17.7 17.7 3.68 3 Koolkhan 11kV 66/11 7.5/10 0 0.99 2.6 2.6 2.6 2.6 2.6 0.55 1 Maclean 66/11kV 66/11 16 16 17.6 1.00 7.5 7.5 7.5 7.5 7.5 2.23 2 Maclean 66/33kV 66/33 8/10 0 0.95 0.4 0.4 0.4 0.4 0.4 0.00 3 Nymboida 66/11 0.6 0.6 0.66 0.98 0.4 0.4 0.3 0.3 0.3 0.13 5 Redcliff 33/11 0.5 0.5 0.55 0.95 0.4 0.4 0.4 0.4 0.4 0.08 3 Yamba 66/11 20/30 15/19/23 25.3 1.00 9.3 9.3 9.2 9.2 9.2 2.49 3
WINTER Grafton Supply Area POE50 Indicative Demand Forecast
Tx.1 Tx.2 Tx.3 2016 2017 2018 2019 2020 Grafton North 66/11 24/30 15/20/25 30 1.00 11.8 11.4 11.1 10.9 10.6 2.80 2 Grafton South 66/11 15/19/25 15/19/24.5 29.4 0.98 14.0 14.0 14.1 14.1 14.1 3.68 8 Koolkhan 11kV 66/11 7.5/10 0 0.99 2.4 2.4 2.4 2.4 2.4 0.55 1 Maclean 66/11kV 66/11 16 16 19.2 0.99 8.1 8.2 8.3 8.5 8.6 2.23 2 Maclean 66/33kV 66/33 8/10 0 0.95 0.3 0.3 0.3 0.3 0.3 0.00 2 Nymboida 66/11 0.6 0.6 0.72 0.95 0.5 0.5 0.5 0.5 0.5 0.13 Redcliff 33/11 0.5 0.5 0.6 0.95 0.3 0.3 0.3 0.3 0.3 0.08 2 Yamba 66/11 20/30 15/19/23 27.6 0.99 10.2 10.1 10.1 10.0 10.0 2.49 4 Embedded Solar PV (MVA) 95% Peak Load Exceeded (Hrs) Substation kV
Transformer Rating (MVA)
Firm Dynamic Rating (MVA) Forecast PF
Forecast (MVA) Embedded
Solar PV (MVA) 95% Peak Load Exceeded (Hrs) Substation kV
Transformer Rating (MVA)
Firm Dynamic Rating (MVA) Forecast PF Forecast (MVA)
2.3.4.4
Subtransmission Single Line Diagram of Grafton area
Ny mbo id a Gr af to n St h Gr af to n Nt h KOO L KHA N R ed cl if f M acl ean Y amba C o ff s H ar b o u r n .o . K o o lk h an Fi ve M ile (n o te 1 ) P A rmi d al e 6 kV Grid Su bs C o ff s H ar b o u r E ss e ntial E ne rg y Zone Su bsta tions G e 132kV Tra ns miss ion & Sub -t ra ns miss ion Line s E ss enti a l E ner gy 330kV T ra ns G ri d 33kV 66kV 6 6 /3 3 /1 1 kV 6 6 /1 1 kV 3 3 /1 1 kVGRAF
TON
0825 0 8 9 6 :M LN 0826 6510 6504 6503 6505 6508 6509 89 96H Li smo re 967 6402 6404 at io n 966 Li smo re C asi n o v ia R ap p vi lle No tes 1) Fi ve M ile is th ree p o le mou n ted 6 6 kV AB S’s . 6501 6403 G 6506 6 6 /1 1 /6 .6 kV Ny mbo id a H yd ro Gen er at io n S h an n on Ck 8 G1 n .o2.3.5
Coffs Harbour Supply Area
2.3.5.1
Description of Coffs Harbour area
The Coffs Harbour area subtransmission system is supplied from the TransGrid 330/132/66kV subtransmission substation at Coffs Harbour (Karangi). The Dorrigo substation is normally connected via the Essential Energy 132kV tee line from the TransGrid 132kV transmission line between Armidale and Coffs Harbour with back up from the 66kV system. Boambee South is an Essential Energy 132/66/11kV substation that is supplied by the TransGrid 132kV transmission network between Kempsey and Coffs Harbour.
COFFS HARBOUR – Identified System Limitations
SYSTEM LIMITATION Refer to DAPR
Section Nil
2.3.5.2
Subtransmission feeder load forecast
Line Rating
Line Rating
MVA 15/16 16/17 17/18 18/19 19/20 MVA 2016 2017 2018 2019 2020
96C/2(D) 132 TransGrid 96C Armidale Coffs
Harbour Dorrigo Tee Dorrigo ZS 122 2.1 2.1 2.1 2.1 2.1 137 2.6 2.6 2.6 2.6 2.6
702 66 Boambee South 132/66kV STS Sawtell ZS 61 7.5 7.6 7.8 7.9 8.1 68 7.9 8.0 8.1 8.2 8.2
705 66 TransGrid Coffs Harbour
132/66 kV STS South Coffs ZS 52 13.6 13.8 13.8 13.8 13.9 58 13.0 13.0 13.0 13.0 13.2 706 66 TransGrid Coffs Harbour
132/66 kV STS South Coffs ZS 52 15.4 15.7 15.7 15.7 15.7 58 14.7 14.7 14.7 14.7 15.0
7501 66 Nana Glen ZS Woolgoolga ZS 29 5.1 5.2 5.2 5.2 5.2 33 4.8 4.8 4.8 4.8 4.9
7502 66 Nana Glen ZS Ulong ZS 9 0.6 0.6 0.6 0.6 0.6 15 0.6 0.6 0.6 0.6 0.6
7503 66 Ulong ZS Dorrigo ZS 9 0.0 0.0 0.0 0.0 0.0 15 0.0 0.0 0.0 0.0 0.0
7509 66 Moonee ZS Woolgoolga ZS 30 8.2 8.4 8.5 8.7 8.8 36 10.0 9.9 9.9 9.9 9.8
7510 66 North Coffs ZS Moonee ZS 61 6.6 6.7 6.7 6.7 6.7 68 6.3 6.3 6.3 6.3 6.4
703:NGN 66 TransGrid Coffs Harbour
132/66 kV STS Nana Glen ZS 62 8.3 8.4 8.4 8.4 8.5 69 7.9 7.9 7.9 7.9 8.1
711:CHN 66 TransGrid Coffs Harbour
132/66 kV STS North Coffs ZS 62 16.7 17.0 17.0 17.0 17.0 69 15.9 15.9 15.9 15.9 16.2
87C 66 North Coffs ZS South Coffs ZS 68 10.4 10.6 10.6 10.6 10.6 68 9.9 9.9 9.9 9.9 10.1
Line Forecast MVA Line Forecast MVA
Summer
Feeder # Feeder
Voltage kV Feeder Origin Feeder Destination
2.3.5.3
STS and ZS load forecast
SUMMER Coffs Harbour Supply Area POE50 Indicative Demand Forecast
Tx.1 Tx.2 Tx.3 15/16 16/17 17/18 18/19 19/20
Boambee South 11kV 132/66/11 60/30/30 33 0.99 8.0 8.2 8.4 8.5 8.7 2.00 42 Boambee South 66kV 132/66/11 60/30/30 33 0.99 7.1 7.2 7.2 7.3 7.3 0.00 3 Coffs Harbour North 66/11 15/19/23 15/20/25 15/19/23 50.6 1.00 21.5 21.4 21.3 21.3 21.2 3.18 2 Coffs Harbour South 66/11 20/30 20/30 33 0.96 21.2 20.9 20.7 20.5 20.3 2.30 10
Dorrigo 132/11, 66/11 10 5 5.5 0.95 2.1 2.1 2.1 2.1 2.1 0.68 11 Moonee 66/11 10/16 10/16 17.6 0.98 3.6 3.6 3.6 3.6 3.6 1.30 5 Nana Glen 66/11 5/6.25 8 6.875 0.95 2.7 2.7 2.7 2.6 2.6 0.84 1 Sawtell 66/11 15/19/25 15/19/25 27.5 1.00 7.5 7.6 7.8 7.9 8.1 1.65 3 Ulong 66/11.4 1 0 0.71 0.3 0.3 0.3 0.3 0.3 0.10 8 Woolgoolga 66/11 20/30 20/30 33 1.00 8.2 8.4 8.5 8.7 8.8 3.01 3
WINTER Coffs Harbour Supply Area POE50 Indicative Demand Forecast
Tx.1 Tx.2 Tx.3 2016 2017 2018 2019 2020
Boambee South 11kV 132/66/11 60/30/30 36 1.00 9.8 9.8 9.8 9.8 9.8 2.00 4 Boambee South 66kV 132/66/11 60/30/30 36 1.00 7.7 7.7 7.7 7.7 7.8 0.00 4 Coffs Harbour North 66/11 15/19/23 15/20/25 15/19/23 55.2 1.00 20.1 20.1 20.1 20.1 20.1 3.18 6 Coffs Harbour South 66/11 20/30 20/30 36 0.99 16.7 16.7 16.7 16.7 16.7 2.30 9
Dorrigo 132/11, 66/11 10 5 6 0.95 2.6 2.6 2.6 2.6 2.6 0.68 9 Moonee 66/11 10/16 10/16 19.2 0.99 4.4 4.3 4.2 4.2 4.1 1.30 3 Nana Glen 66/11 5/6.25 8 7.5 0.95 2.4 2.3 2.3 2.2 2.2 0.84 6 Sawtell 66/11 15/19/25 15/19/25 30 1.00 7.9 8.0 8.1 8.2 8.2 1.65 5 Ulong 66/11.4 1 0 0.89 0.3 0.3 0.3 0.3 0.3 0.10 3 Woolgoolga 66/11 20/30 20/30 36 1.00 10.0 9.9 9.9 9.9 9.8 3.01 7 Embedded Solar PV (MVA) 95% Peak Load Exceeded (Hrs) Substation kV
Transformer Rating (MVA)
Firm Dynamic Rating (MVA) Forecast PF
Forecast (MVA) Embedded
Solar PV (MVA) 95% Peak Load Exceeded (Hrs)
Substation kV Transformer Rating (MVA)
Firm Dynamic Rating (MVA) Forecast PF Forecast (MVA)
2.3.5.4
Subtransmission Single Line Diagram of Coffs Harbour area
1 3 2 /6 6 kV 66 /11k V Tra ns Grid Su bsta tions E ss e ntial E ne rg y Zone Su bsta tions Tra ns miss ion & Sub -t ra ns . Line sCOF
FS
HA
RBOU
R
AND
NAMB
UCC
A
HEA
DS
3 3 0 /1 3 2 /6 6 kV 1 3 2 /6 6 /1 1 kV 1 3 2 /1 1 kV W o o lgo o lga Sawt el l R al ei g h C o ff s H ar b o u r So u th C o ff s H ar b o u r No rt h Ul o n g Na n a Gl en D o rr ig o Na mbu cca H eads C OFFS HA RB O UR Ko o lkh an A rmi d al e n .o . NAMBUC C A HE A DS do u bl e-ci rc u it M o o n ee Li smo re Bo ambee So u th M ack sv ill e do u bl e-ci rc u it 7501 7 0 3 :NG N 7502 7503 9 6 C /1 (A ) 9 6 C /2 (D) 9 6 C /1 (C ) 7509 7510 7 1 1 :C H N 706 705 9 W3 9 W8 9 W2 9 W7 9W6 9 W5 751 702 87 89 96H Ke mp sey 13 2k V E ss enti a l E ner gy 3 3 0 kV T ra ns G ri d 6 6 kV 1 3 2 kV 87C2.3.6
Nambucca Heads Supply Area
2.3.6.1
Description of Nambucca Heads area
The Nambucca Heads area subtransmission system is supplied from the TransGrid 132kV transmission network. Nambucca Heads is a 66/11kV substation supplied via a 66kV line from TransGrid’s Nambucca 132/66kV substation, while Raleigh and Macksville are 132/11kV substations supplied from the TransGrid 132kV transmission network between Kempsey and Coffs Harbour.
NAMBUCCA HEADS – Identified System Limitations
SYSTEM LIMITATION Refer to DAPR
Section Nil
2.3.6.2
Subtransmission feeder load forecast
Line Rating Line Rating MVA 15/16 16/17 17/18 18/19 19/20 MVA 2016 2017 2018 2019 2020 751 66 TransGrid Nambucca 132/66 kV STS Nambucca ZS 15 5.9 5.7 5.6 5.5 5.5 25 7.6 7.4 7.2 7.1 6.9
Line Forecast MVA Line Forecast MVA
Summer
Feeder # Feeder
Voltage kV Feeder Origin Feeder Destination
Winter
2.3.6.3
STS and ZS load forecast
SUMMER Nambucca Heads Supply Area POE50 Indicative Demand Forecast
Tx.1 Tx.2 Tx.3 15/16 16/17 17/18 18/19 19/20
Macksville 132/11 24/30 24/30 33 0.97 8.3 8.2 8.2 8.2 8.2 2.45 7
Nambucca Heads 66/11 15/19/23 17/22/24 25.3 0.99 5.9 5.7 5.6 5.5 5.5 1.78 1
Raleigh 132/11 30 30 33 0.97 8.7 8.8 8.9 8.9 9.0 2.83 3
WINTER Nambucca Heads Supply Area POE50 Indicative Demand Forecast
Tx.1 Tx.2 Tx.3 2016 2017 2018 2019 2020 Macksville 132/11 24/30 24/30 36 0.99 9.8 9.8 9.8 9.9 9.9 2.45 10 Nambucca Heads 66/11 15/19/23 17/22/24 27.6 1.00 7.6 7.4 7.2 7.1 6.9 1.78 13 Raleigh 132/11 30 30 36 0.99 9.6 9.5 9.4 9.4 9.3 2.83 7 Embedded Solar PV (MVA) 95% Peak Load Exceeded (Hrs)
Substation kV Transformer Rating (MVA)
Firm Dynamic Rating (MVA) Forecast PF
Forecast (MVA) Embedded
Solar PV (MVA) 95% Peak Load Exceeded (Hrs) Substation kV
Transformer Rating (MVA)
Firm Dynamic Rating (MVA) Forecast PF Forecast (MVA)

![5 Methyl 2 morpholino 3 p tolyl 8,9,10,11 tetrahydro 2 benzothieno[2′,3′:6,5]pyrido[4,3 d]pyrimidin 4(3H) one](data:image/gif;base64,R0lGODlhAQABAIAAAP///wAAACH5BAEAAAAALAAAAAABAAEAAAICRAEAOw==)