Profiling Finnish Technology Incubators: Common Elements and Particular Features
Authors:
Ulla Hytti (Finland)
Organisation: Turku School of Economics and Business Administration Katja Mäki (Finland)
Profiling Finnish Technology Incubators: Common Elements and Particular Features
Executive Summary
This paper examines the differences between the Finnish technology incubators and the differences between the incubators in the incubatees’ perceptions of and satisfaction with the incubator. Third, it explores the connection between the different types of incubators and the satisfaction of the incubatees. Based on our study, the reasons for joining and the successful factors in the incubators are perceived very differently in the different incubators. Interestingly, overall customer satisfaction may be created through different incubation practices. However, customer satisfaction is best created through the provision of financial services and financing but the firms will perceive the role of the incubator to be crucial in the business development only if it focuses holistically and intensely the business development and offers related services (e.g. sales and marketing) with a hands on approach.
Introduction
Promoting entrepreneurship and growth of companies is one of the most important aims for the industrial and entrepreneurship policies in the European Union. There are several instruments that aim at fostering entrepreneurship and growth. In this paper we will focus on the technology incubators. The task for the incubators is to complement the existing resources of the incubatees: human resources (by developing the existing resources through training or by assisting in recruiting), social resources (by facilitating access to networks within the incubator/science park or to external networks), financial resources (information about and contacts to financiers), physical resources (premises, machines, etc.), technological resources (access to technology) and organisational resources (counselling, consulting and mentoring). (Sijde, 2002)
The term “technology incubator” can be used to refer to several different types of organisations that aim at assisting entrepreneurs or aspiring entrepreneurs to commercialise their idea and to set up a company. In this study we use the term technology incubator to refer to organisations that provide business services to new technology-based firms (NTBFs). These services are produced by the incubator management or purchased from the incubator network service providers. The aim of this paper is to investigate the common elements for the Finnish technology incubators as well as to identify some of the key differences between them and to provide explanations for the identified differences. Consequently, we will increase knowledge about the incubation processes and activity within the Finnish technology incubators. This will facilitate international benchmarking and learning from the Finnish cases.
The study has been conducted in relation to a development programme for 14 Finnish technology incubators out of the 23 incubators represented by the Finnish Science Park Association.
A typology for incubators
There are many initiatives to support incubation. Many of them have been ad hoc since there have been very few models or best practice methods available to be used as a reference. Consequently, different approaches to incubating high-tech firms prevail. It is possibly to identify different facets of incubators to explain in a structured way the richness and complexity of incubation activity. According to Surlemont et al (2002) the facets include: What kind of support is provided to the incubatees; the extent to which the incubator is real or virtual; what type of financial backers support the incubators; how are they paid for their services; what type of actors are involved in the incubation; what type of entrepreneurs are targeted; which stages of development they focus on; and how specialised they are. Grimaldi and Grandi (2005) have also aimed at
articulating the differentiating characteristics for incubators and these include institutional mission, industrial sector, location, market, origin of ideas, phase of intervention, incubation period, sources of revenue, services offered and management teams. These lists are not exhaustive but the idea is not to create one but to demonstrate that through the combinations of different characteristics it is possible to create typologies or profiles for incubators that are largely different from one another. For example, Grimaldi and Grandi (2005) identify at the other end of the spectrum “public incubators” while at the other end they identify “private incubators”, and “university incubators” somewhere in the middle between the two. Therefore, it is not possible to treat incubators as a homogeneous concept. In this paper, we will apply these previous studies to characterise the types or variations of technology incubators in Finland. We will assess the success of the different kind of incubators from the point of view of incubatees. The results are preliminary and reflect the state-of-art situation when conducting the study (2004). Currently, there has been an intense development programme targeted at the incubators and the practices in the individual incubators have changed. It is also important to bear in mind that even though the success from the point of view of incabatees is one important measure of functionality of different incubating models, it does not give us information of the connection of particular features of the incubators and actual effects on the incubated firms. In the follow up study, we will aim to investigate not only the customer satisfaction but also e.g. development and growth of the firms after the incubation phase.
Data
The study is part of a larger study investigating the ex ante conditions for a national incubator development programmei and the research data consists of two data sets. The first data set has been collected by a phone survey in June–July 2004, October 2004 and January–February 2005 to the incubator firms in the Finnish technology incubators. Out of the 23 incubators represented by the Finnish Science Park Association 13 incubators were included in the study. Altogether 193 responses were received representing an average response rate of 83 % per incubator. Only the high-technology companies which had a valid incubation contract or were entitled to business development services provided by the incubators were included in the analysis which amounted to 131 firms in our data. The second set consists of interviews with incubator managers. The research team carried out interviews for the incubator managers in 131 incubators (1–4 interviewees per incubator) during the summer and the autumn 2004.
Analysis
In this paper we will examine first the differences between the Finnish technology incubators and, second, the differences between the incubators in the incubatees’ perceptions of and satisfaction with the incubator. Third, we will try to explore also the connection between the different types of incubators and the satisfaction of the incubatees. The differences between the Finnish technology incubators are examined by qualitative analysis of the interviews with the incubator managers and other information (Internet-pages and other documents). The differences between the incubators in the incubatees’ satisfaction with the incubator are examined by quantitative analysis of the survey data. In the beginning of the quantitative analysis, the dependent variables indicating incubatees’ satisfaction were cross-tabulated with the incubator variable. There were some continuous dependent variables which were analysed with non-parametric mean comparison test (Kruskal Wallis Test) with the incubator as a grouping variable. Six of the smallest incubators (under five firms) were combined for the quantitative analysis for practical reasons, even though they were not similar in terms of operational attributes. In case there were differences in
incubatees’ satisfaction between different incubators, a logistic regression analysis was conducted in order to examine whether the difference persists when firm characteristics are taken into
consideration. In addition to incubator variable, the independent variables in the logistic
regression model were firm age, size (number of entrepreneurs and employees), industry, focus of firm (R&D; production and commercialization of R&D results, starting sales, growth orientation based on respondents subjective evaluation), growth by employees2, location of customers (international markets vs. national or regional markets) as well as funding (the amount of acquired allowances, loans, equity capital).
In the paper, we will report the differences between incubators evident both in cross-tabulation and logistic regression analysis. There are some limitations in the analysis of the quantitative data. The sample is relatively small resulting to zero cells in cross-tabulation and thus confusion on the interpretation of the logistic regression parameters. In addition, as the number of firms in several incubators is small, the reliable statistical comparison of the incubators becomes
challenging. The analysis is, however, conducted in the light of the large body of qualitative information acquired by interviews, observation and existing materials (e.g. the applications of the incubators for the development programme and science parks and incubators marketing materials etc), which guides us in the interpretation. In the paper, we will present the cross-tabulation frequencies concerning the dependent variables that were explained with the incubator-variable also in logistic regression. In several cases there were also other statistically significant explanatory factors for the dependent variable, but for simplicity, in this paper we’ll concentrate on the differences we were able to find between the incubators. Since the study is so far
confidential we do not identify the incubators by their real names but with letters (A-H).
Results
The differences and similarities in the Finnish technology incubators
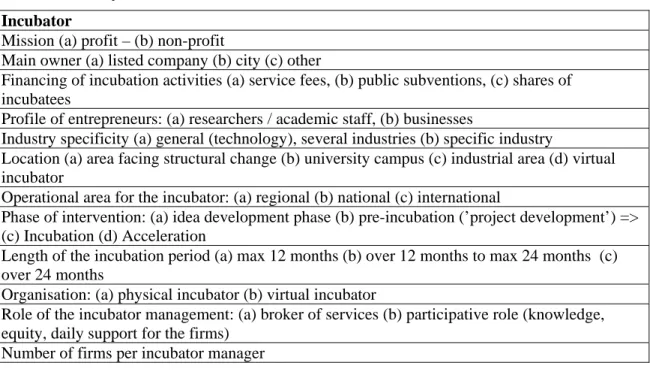
Based on the interviews carried with the incubators, we have gathered information on the following characteristics of incubators (Table 1) (see also Grimaldi – Grandi, 2005, Chan – Lau, 2005, Surlemont, 2002). These factors have been found in the different international studies to create differences between the incubators although their main objective – to accelerate the development of firms – remains the same.
Table 1 Summary table of the characteristics of incubators Incubator
Mission (a) profit – (b) non-profit
Main owner (a) listed company (b) city (c) other
Financing of incubation activities (a) service fees, (b) public subventions, (c) shares of incubatees
Profile of entrepreneurs: (a) researchers / academic staff, (b) businesses
Industry specificity (a) general (technology), several industries (b) specific industry
Location (a) area facing structural change (b) university campus (c) industrial area (d) virtual incubator
Operational area for the incubator: (a) regional (b) national (c) international
Phase of intervention: (a) idea development phase (b) pre-incubation (’project development’) => (c) Incubation (d) Acceleration
Length of the incubation period (a) max 12 months (b) over 12 months to max 24 months (c) over 24 months
Organisation: (a) physical incubator (b) virtual incubator
Role of the incubator management: (a) broker of services (b) participative role (knowledge, equity, daily support for the firms)
Number of firms per incubator manager
2 We have developed elsewhere absolute fast growth indicator for measuring growth of new technology
At the time of the interviews (2004), the common institutional mission for the incubators was to be non-profit. Only one of the incubators was partly organised for profit although some of its services are non-profit. This non-profit aim is also reflected in the financial backers for the incubators. The majority of Finnish technology incubators (in our data, 8/13) are owned by cities and municipalities. This is also connected to the operational area for the incubator – most act to achieve the aims of regional and/or local policy and therefore aim to boost the economic development of the region. From the other point of view, this might be a constraint in terms of the national (or European) innovation policy. The regional and municipal owners might not offer their full support for the incubators for example in terms of more active networking between the incubators if it meant that the firms are created outside of the region.
The aim to act for the benefit of the region on the other hand is connected to the choice of industry, i.e. most incubators also address all technology sectors or are focused to serve several industries whilst only few offer industry-specific services (biotechnology, healthcare, business services). The choice of industries reflects the regions where the incubators are located.
At the time of the interviews – in the beginning of the development programme - all of the incubators are focused on idea development phase and incubation phase. At the point of interviews, only few incubators focused specifically pre-incubation phase and/or growth acceleration phase. This has however changed through the development programme for the incubators. Currently, most incubators focus also services in the pre-incubation and the joint development of internationalisation programme for the most potential firms is under way. Consequently, the Finnish technology incubators are able to offer a fairly holistic service programme to target all the phases from development to pre-incubation to incubation and internationalisation. At the same time the incubators have aimed to develop their services to meet the needs of their most attractive firms (growth-oriented firms with a strong potential for VC funding) but still they all serve also firms with more modest goals and ambitions (e.g. service firms).
At the time of the interviews the length of the incubation period varied also to a great deal – from just one year to 3 years. Besides the length of the incubation period, one of the major differences is spatial organisation of the incubator activities: physical vs. virtual incubator. Although there has been a tendency towards a more homogeneous offering of services and more homogeneous operational models, this is also the difference that will exist between the incubators in the future. This is partly influenced by the financiers of the incubators (in the regional incubators, the municipalities will finance only incubatees located in their municipality) and by the belief system of the incubator management.
The general policy aim for the incubators is to a) increase the number of incubatees and b) to improve their quality in terms of growth, internationalisation etc. It should be noted that the incubators are located in very different regions (university vs. industrial regions, economic activity) which forms the operational context for the incubators. This has an important bearing on the types and nature – and even number of firms that the incubator manages to attract (also Grimaldi – Grandi, 2005).
One of the most interesting difference with regard to the incubators was on the ownership policy. Based on a US study, a trend gaining in popularity is to make equity investments or receive royalty payments from tenant firms (Lewis, 2001). In Finland, the financing of incubation activities is mainly through public subventions and to a lesser extent through service fees. Only few Finnish incubators currently take shares of the firms. In the similar fashion, in some of the incubators the incubator managers are represented in the incubator boards while in others this is not the policy. In our interpretation these differences are derived from the different views of the role of the incubator management in relation to the firms. Most incubators describe their role as facilitators who leave the decision-making, risk-taking and eventually profits for the firms. In this sense the Finnish incubators typically represent the not-for-profit organisations and only a few
share characteristics with the for-profit organisations. In the future, the financing of incubation activities might change also in Finland towards the direction of service fees. In this model, it would be the firms that will be subsidised, not the incubators.
Based on our study it seems that the incubator management share a different philosophy in terms of the practices they force on the firms: Some of the incubators put pressure on the firms through monthly meetings where they will set targets for the coming month and assess the process taken since the last meeting (a proactive approach). In other incubators such tight practices are not taken but the incubatees are assumed to contact the incubator when necessary (a reactive approach).
The differences and similarities in the Finnish technology incubators
When analysing the responses of the incubator firms we could identify both similarities and differences in their perceptions. When the firm characteristics were taken into account, there were no differences between the different incubators in the following aspects:
- overall satisfaction with the incubator
- satisfaction with the activities of incubator managers and staff
Overall satisfaction with the incubator was measured as a grade for the incubator. The average grade was 8- (on a scale from 4-10) and 19 % of all the firms graded the incubator with 10 while 12 % gave the incubator 6 or less. This result suggests that overall customer satisfaction in the incubator context can be created through highly different incubators. Satisfaction with the activities of incubator staff was measured as grades for certain aspects related to incubation process: consideration of customers’ needs (sum variable); communication, availability and information (sum variable); mediation of consultancy and expert services and organisation of training (sum variable) as well as organisation of common social occasions. Some differences in the individual aspects could be found in the preliminary analysis: considerations for customers needs’ and communication, availability and information, but only the difference in
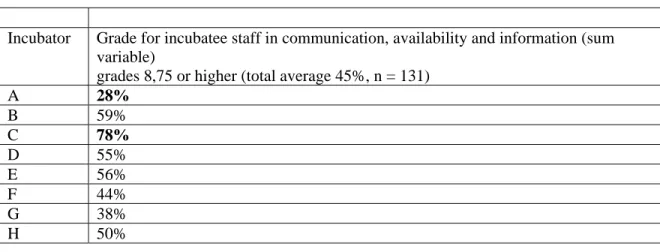
communication, availability and information remained in logistic regression analysis where grades of 8,75 or higher were compared to lower grades (Table 2).
Table 2 Incubatee satisfaction with the activities of incubator staff: communication, availability and information
Incubator Grade for incubatee staff in communication, availability and information (sum variable)
grades 8,75 or higher (total average 45%, n = 131)
A 28% B 59% C 78% D 55% E 56% F 44% G 38% H 50%
These results suggest that even though there are some differences in the satisfaction they are not very dramatic. The satisfaction with incubator management seems to be lower if the number of firms per incubator manager exceeds 20 firms (incubator A). The interesting finding is that the spatial organisation (virtual vs. physical incubator) does not seem to be related to the satisfaction with the communication and other aspects of the incubator management. For example in the virtual incubator (C) the satisfaction is the greatest in the observed incubators.
In the following aspects differences between the different incubators were identified: - reasons for locating in the incubator
- satisfaction with incubator support services and business development services - views on value added gained from the incubator
- views on incubator’s role in setting up the firm - views on incubator’s role in the firm development
We examined the successful factors in the incubator from the point of view of incubatees as well as value added incubatees perceive to receive from the incubator. In order to accurately interpret these satisfaction indicators, it is important to investigate whether there are differences in the incubatees’ needs for the incubator. These issues were surveyed as open ended questions3 and the answers were classified as follows (Table 3).
Table 3 Incubatees’ perceptions of reasons for joining an incubator, successful factors in the incubator and value added in the incubator
N = 130
Networks and contacts Premi
ses an
d
related se
rvices
Support services Business development ser
ic
es
Location Im
age and
atmosphere Incubator organisation
Other Do not know
Reasons for joining an incubator 42 % 45 % 27 % 72 % 8 % 15 % 8 % 12 % 0 % Successful factors in the incubator 31 % 27 % 16 % 65 % 10 % 7 % 21 % 9 % 8 % Value added in the incubator 15% 16% 22% 53% 1% 10% 7% 2% 20%
The firm representatives emphasised business development services as a reason for joining an incubator and as a successful factor as well as value added firms get from the incubator.Business development services were emphasized in some incubators more than others as a reason for joining an incubator as well as successful factors (Table 4).
Table 4 Reasons for joining an incubator, successful factors in the incubator and value added in the incubator that differ among the incubators
Reasons for joining an incubator Successful factors in the incubator Value added in the incubator Premises and related services Support services Business development services Premises and related services Support services Business development services Premises and related services Support services Business development services A 80% 50% 41% 32% 50% 18% B 29% 12% 82% 18% 82% 12% C 0% 22% 89% 0% 89% 0% D 18% 0% 100% 0% 82% 0% E 89% 56% 78% 11% 33% 44%
3 “Please mention three most important reasons for operating in the incubator”; “Please mention three
especially successful factors in the incubator”; “What is the value added the incubator gives for the firm that the firm can not get anywhere else?”
F 0% 6% 88% 0% 75% 0%
G 25% 13% 100% 13% 100% 0%
H 38% 13% 89% 13% 56% 44%
The role of business development services was less frequently important in A (even though these services are important also in A). In order to examine which particular business development services play the most important role, we checked whether the differences are due to differences in these particular business development services (Table 5).
Table 5 Reasons for joining an incubator and successful factors in the incubator that differ among the incubators (financial services, start up services)
Reasons for joining an incubator: Business development services
Successful factors in the incubator:
Business development services Financial services and
consultation as well as financing (average 42%)
Start up services and consultation (average 18%)
Financial services and
consultation as well as financing (average 22%) A 21% 2% 11% B 65% 24% 41% C 22% 22% 11% D 64% 36% 18% E 33% 22% 0% F 50% 19% 38% G 75% 50% 50% H 56% 19% 19%
In B, D and G the business development services as a reason for joining an incubator consisted of financial services and consultation as well as financing more frequently than on the average and in D and G also the role of start up services and consultation was emphasized. In B and G and also in F financial services and consultation as well as financing were also the source for satisfaction with business development services more frequently.
Although we have a lot of data of the incubators, we cannot really reliably explain all the
differences as the differences seem to be created through rather implicit practices. For example, in incubator B there is a counselling team that consists of e.g. financiers that makes the decisions of accepting the firms in the incubators. So, our guess is that this participative role acts towards the positive attitude towards the incubatees while they seek financing from these institutions. The incubators B and D have taken what we have previously labelled the proactive approach to incubation. It is in these incubators where the incubatees also emphasise the role of start up services as a reason for joining the incubator.
Three other themes which were emphasized by the incubatees were networks and contacts, premises and related services as well as support services. Previously, in the literature the linkages and networks have been emphasised as one of the most important benefits science parks can offer for new technology based firms (Guy 1996; Massey et al. 1992; Quintas 1996) and it seems that incubatees expect to gain linkages also when joining an incubator. There were no differences between incubators in the terms of networks and contacts as a reason for joining an incubator, successful factors in the incubator or as a value added in the incubator.
The role of premises and related services as well as support services was emphasized in A and E. From the outset these incubators are highly different: A operates in a big city and E on a smaller city. In the incubator A, the role of premises is easy to explain by the economic environment: in
the larger cities, the location and for example proximity to university, research labs and other technology firms becomes crucial. In the smaller cities, distances are short in any case so the location is not automatically a benefit or a constraint in the networking. Premises and related services as well as support services do not play role in C or F, as they operate as virtual incubators. Their role is below average also in B, D and G.
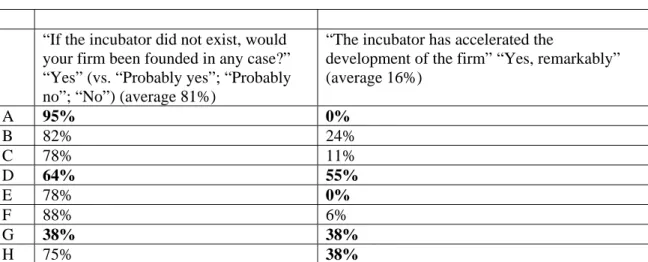
Views on incubator’s role in setting up the firm were examined by asking: “If the incubator did not exist, would your firm been founded in any case?” Our analysis showed that there was more uncertainty about the establishment of the firm without the incubator in D and G while in A nearly all the firms believed to have set up the firm even without the incubator. (Table 6)
Table 6 Role of incubator in the firm establishment and business development
“If the incubator did not exist, would your firm been founded in any case?” “Yes” (vs. “Probably yes”; “Probably no”; “No”) (average 81%)
“The incubator has accelerated the
development of the firm” “Yes, remarkably” (average 16%) A 95% 0% B 82% 24% C 78% 11% D 64% 55% E 78% 0% F 88% 6% G 38% 38% H 75% 38%
Views on incubator’s role in the firm development were examined by asking: “How would you consider the following statement: “The incubator has accelerated the development of the firm”. On the basis of our analysis the incubator has accelerated the firm development remarkably in D as well as in G and the smallest incubators examined together. These results suggest that in the smaller economic areas, the incubator may have a positive role even in the firm establishment. Secondly, the results suggest that the focus on the premises (Table 4) is not linked to the
perceptions of the firms on the important role of the incubator on the firm development (Table 6). Finally, we try to investigate and explore if the incubator characteristics (Table 1) and the
previously presented results of customer needs and satisfaction are related and how. It should be noted that this exploration is preliminary and needs to be elaborated further. In addition as a consequence of the development programme the incubator practices have become more homogenous it will be interesting to investigate if such differences in the incubatee needs and satisfaction persist in the follow-up survey to the incubatees.
Table 7 Connections between incubator characteristics and customer needs and satisfaction with the incubator
Particular features
Incubator characteristics Customer needs and satisfaction
Are these issues related? A The incubator is large and
situated in a large city in the proximity of universities and research institutes as it is located in a university campus. It is a
-Emphasis on premises and related services as well as
support services, the latter also as a source of
satisfaction
In large cities, the suitable premises and location may become a critical factor in the business development.
non-profit organization but owned by a listed firm and focuses technology firms in general. The incubator is organized as a physical
incubator, and represents one of the oldest incubators in the study. The number of firms per manager is the biggest in the study.
-Grade for incubatee staff in communication, availability and information less
frequently excellent
-Incubatees are not in opinion that incubator has had an effect in firm establishment or that it would have accelerated the firm development remarkably
Therefore, the strong focus on the premises is connected to the location and context for the incubator.
B The incubator is large and situated in a large city in the proximity of universities and research institutes as it is located near a university campus. It is a non-profit organization and owned by the city. It focuses both technology firms in general and certain industries. The incubator is organized as a physical incubator.
-Emphasis on business development services,
especially funding related services and consultation as well as financing, also as a source of satisfaction
Despite the somewhat similar characteristics as in A, the incubator B has chosen a different approach and focus on the financing and financial services.
C The incubator is small and is situated in a mid-size city in the proximity of a university as it is located on the university campus. It is a non-profit organization owned by a listed firm. It focuses technology firms in general. The incubator is organized as a virtual incubator.
-Emphasis on business development services in general
-Grade for incubatee staff in communication, availability and information most
frequently excellent
The organizational form of the incubator (virtual and physical) does not constrain good
communication between the incubator and its incubatees.
D The incubator is small and is situated in a mid-size city in the proximity of a university. It is a non-profit organization owned by the city. It focuses technology firms in general. The incubator is organized a physical incubator; the incubator management applies a proactive approach to in the business development and guidance for the incubatees.
-Emphasis on business development services,
especially funding related services and consultation as well as financing but also firm start-up services and consultation
-Incubatees are more frequently in opinion that incubator has had an effect in firm establishment and most frequently that it would have accelerated the firm
development remarkably
The proactive approach to incubation seems to be connected to
perceptions of the role of the incubator in the firm establishment and the firm development.
E The incubator is small and is situated in a mid-size city in the proximity of a university. It is a non-profit organization owned by the city. It focuses technology firms in general. The incubator is
-Emphasis on premises and related services as well as
support services, the former
are also emphasized as value added
-Incubatees are not in opinion
The focus on premises is not enough to create enough value added for the firms.
organized a physical incubator. that incubator would have accelerated the firm development remarkably F The incubator is small and is
situated in a mid-size city in the proximity of a university. It is a non-profit organization owned by a listed firm. It focuses technology firms in general. The incubator is organized a virtual incubator, and represents one of the oldest incubators in the study.
-Emphasis on business development services,
financial services and consultation as well as financing as a source of satisfaction
-Incubatees are very seldom
in opinion that incubator would have accelerated the firm development remarkably
The connection is similar as in the incubator B. The emphasis on financial services is not enough to create perceptions that the incubators has had an important value added in the firm development. G The incubator is small and is
situated in a small city in the proximity of a university. It is a non-profit, private firm. It focuses technology firms in general. The incubator is organized as a physical and virtual incubator. the incubator management applies a proactive approach to in the business development and guidance for the incubatees.
-Emphasis on business development services,
especially funding related services and consultation as well as financing and firm founding related services and consultation, the former also as a source of satisfaction -Incubatees sharemost
frequently the opinion that incubator has had an effect in firm establishment and also more frequently that it had accelerated the firm development remarkably
The connection between business development services is somewhat similar as in the incubators B, F and in addition firm founding related services and consultation play a significant role. The proactive approach to incubation seems to be connected to perceptions of the role of the
incubator in the firm establishment and the firm development. H Other small incubators together -Emphasis on business
development services,
however, more than average premises and relaed services as a value added
-Incubatees are more frequently in opinion that incubator would have accelerated the firm development remarkably
The small incubators investigated operate in highly different regions and ways, therefore, it is difficult to identify a relation between the incubator characteristics and customer
satisfaction, other than the small size.
Summary and conclusions
The paper contributes to increasing knowledge about the actual incubation activity and processes (following suggestions by Hackett – Dilts 2004); i.e. what is actually done in the technology incubators in Finland and how the firms operating in the incubators perceive the incubators. The focus is on similarities as well as on the differences across the Finnish technology incubators as well as on the possible connections between the incubator characteristics and the incubatee needs and satisfaction.
The results suggest that the incubators already share or are moving towards a common view and similar incubation process in general. They are however different in terms of operationalising this process through a physical incubator space or operating as a virtual incubator. They also operate
in highly different regions in terms of economic activity which frame the operational context for their operations.
Customer satisfaction in the incubator context can be created through highly different incubators. To achieve high customer satisfaction we cannot offer any best practice models how to organise the incubator. Only the big number of firms per incubator manager seems to limit the possibilities of effective incubation from the point of view of incubatees. Based on our study it seems that expectations are created in the beginning of the service process: If the incubator operates through a physical incubator, it underlines and focuses on the premises. In the most active economic areas, the access to suitable premises might be also an important bottleneck in the business start-up so their importance in the satisfaction is also higher. However, the premises alone are not an important factor for the incubatees in their perceptions of the role of the incubator in the firm development. While financial services and financing are an important factor in the start up and business development process, and the satisfaction with the incubator increases with these services, it seems that even the financial services are still not enough to influence the firm perceptions of the role of the incubator in the establishment or development of the firm.
As a consequence, based on our study, if the incubator wants to create and sustain a high-level of customer satisfaction it should focus strongly on the business development services including financial services. The logic behind our finding could be the same as in the old story about fishing and the hungry men. If you give fish to the hungry men, they will not be hungry for a few days but if you teach them how to fish, they will not be hungry for the rest of their lives. So, if you provide the incubatees with an easy access to financing, they will be satisfied and happy for a few months or years but for the long term survival and satisfaction, they will need to learn how to generate income financing, i.e. be successful in their marketing and sales efforts.
References
Chan, K.F. & Lau, T. 2005. Assessing technology incubator programs in the science park: the good, the bad and the ugly. Technovation: 25, 1215-1228.
Grimaldi, Rosa – Grandi, Alessandro (2005) Business incubators and new venture creation: an assessment of incubating models. Technovation, Vol. Vol. 25, No. 2, 111-121. Guy, K. (1996) Designing a Science Park Evaluation. In: The Science Park Evaluation
Handbook, 8–28, ed. by K. Guy. Technopolis, Brighton.
Lewis, David A. (2001) Does Technology Incubation Work? A Critical Review. Rutgers
University, Reviews of Economic Development Literature and Practice, No, 11. Mäki, Katja - Hytti, Ulla (2005) Uusien teknologiayritysten kasvu: Hautomoiden rooli kasvun
edistämisessä. In: Kasvun olemus ja reitit – fokuksessa suomalaiset pk-yritykset,
Ed. by Jarna Heinonen. Turku School of Economics
Massey, D. – Quintas, P. & Wield, D. (1992) High-tech Fantasies. Science Parks in Society, Science and Space. Routledge, London and New York.
Quintas, P. (1996) Evaluating Science Park Linkages. In: The Science Park Evaluation Handbook, 98–111, ed. by K. Guy. Technopolis, Brighton.
Surlemont, Bernard – Nlemvo, Frédéric – Pirnay, Fabrice (2002) Facts of technology incubation.
International journal of Entrepreneurship and Innovation, Vol. 3, No. 4, 237-243.
Appendixes
Description of the incubatees investigated, n = 131
The number of employees grown by minimum of 2 employees between 2002-2004 7 %; Turnover grown by min. of 150 000 € 2002–2004 4 %.
Growth
Customers mainly on the international markets 43 %; customers on the national markets at most 46 %; customers on the regional or local markets at most 12 %.
Location of customers
R&D 21 %; productation and commercialization of R&D results 53 %; starting sales 42%; growth 57 % (more than one options possible)
Focus of the firm
No innovation 35 %; new product or service 31%; product or service improvement, organisation or process innovation 28 %; only inventions 7 %
Innovations
ICT 47 %; life sciences 9 %; other technology 21 %; high-tech services or services for the high-tech firms 22 %.
Industry
86 months 2 months
9,00 months 20 months
Duration of the incubation period
7 years 0 years
2 years 1,99 years
Activity with the current business idea
100 000 € 0 persons 3 persons 2 years Mode 0 € 0 persons 0 persons 0 years Min 3 000 000 € 308 252 € Turnover 2004 40,75 persons 3,1 persons Number of employees 2004 10 persons 2,6 persons Number of entrepreneurs 2004 40 years 3,08 years Age Max Average Characteristic
i
For further information on the development programme, please refer to http://www.sitra.fi/eng/index.asp?DirID=875&DocID=4026