Building Information Modeling Based Integration and Visualization
for Facilities Management
Yoosef Asen
A Thesis
in
The Department
of
Building, Civil and Environmental Engineering
Presented in Partial Fulfillment of the Requirements
for the Degree of Master of Applied Science (Building Engineering)
at
Concordia University
Montreal, Quebec, Canada
June 2012
CONCORDIA UNIVERSITY
Department of Building, Civil and Environmental Engineering
This is to certify that the thesis prepared By: Yoosef Asen
Entitled: Building Information Modeling Based Integration and Visualization for Facilities Management
and submitted in partial fulfillment of the requirement for the degree of Master of Applied Science (Building Engineering)
complied with the regulations of the University and meets with the accepted standards with respect to originality and quality.
Signed by the final examining committee:
Dr. Radu Zmeureanu Chair Dr. Amin Hammad Supervisor
Dr. Ali Akgunduz Examiner External (to program) Dr. Zhenhua Zhu Examiner
iii
ABSTRACT
Building Information Modeling Based Integration and Visualization for Facilities Management
Yoosef Asen
Facilities managers need to identify and understand deterioration/failure causes-effect patterns in order to prepare preventive maintenance plans. However, this task is difficult because of the complex interaction between different building components and their operational conditions. In spite of the availability of advanced Computerized Maintenance Management Systems (CMMSs), these systems focus on the data management aspects (i.e. asset inventory, work orders and resource management) and lack the functions necessary to analyze the collected data in order to identify deterioration/failure patterns. Standardization based on Building Information Modeling (BIM) provides new opportunities to improve the efficiency of Facilities Management (FM) by sharing and exchanging building information between different applications throughout the lifecycle of the facilities. This research proposes the integration of FM related data from different sources such as CMMS and BIM through adding the CMMS inspection and maintenance data to the BIM database. This integration, in addition to defined logical and spatial relationships between components and spaces, is used to find the cause-effect relationships through a BIM-based visual analytics. This method facilitates heuristic problem solving and helps to increase the quality of O&M phase. It is
iv
also proposed to integrate CMMS, BIM, video, and Real Time Location System (RTLS) data using Augmented Reality (AR) techniques to visualize construction and renovation operations and to retrieve information about the time, space, and related activities to visualize construction and renovation operations. Several case studies are implemented and tested to show the feasibility of the proposed methods.
v
ACKNOWLEDGEMENT
My greatest gratitude and sincere appreciation goes to my supervisor, Dr. Amin Hammad for his enthusiastic encouragement, close supervision, and guidance. His advice and criticism helped me to make this research possible. It was my honor working and learning from him. I would like to thank Mr. Peter Bolla, Associate Vice-President for Facilities Management, Mr. Yves Gilbert, Engineering & Building Perform Director, and Mr. Steven Truchon, at the Facilities Management department of Concordia University for the feedback on this research and for providing us with the data and CAD files of the Genomics research center. I also would like to thank Mr. Marty Chobot, Vice-President of Product Management and Strategic Alliances and Mr. Drew Easley, Technical Support Specialist at FM:Systems for providing us with the FM:Interact CMMS and technical support, Mr. Nicholas Nisbet and Mr. Thomas Liebich, at AEC3 company, for BIMServices and IFC technical support, respectively, and Mr. John Sullivan, Business Development Manager, at Autodesk for providing us with the Revit 2011 COBIE add-in application. I would like to thank Mr. Ali Motamedi for his help in addition to friendly guidance during my research. I am also thankful of Dr. Cheng Zhang, Mr. JunYu Jian, and Mr. Shayan Setayeshgar for their help in the case studies.
vi
DEDICATION
To my father, mother, sister, and brothers who made all of this possible, for their endless encouragement and support.
vii
TABLE OF CONTENTS
LIST OF FIGURES x
LIST OF TABLES xiii
LIST OF ABREVIATIONS xiv
CHAPTER 1 INTRODUCTION 1
1.1 General 1
1.2 Research Objectives 4
1.3 Thesis Organization 4
CHAPTER 2 LITERATURE REVIEW 6
2.1 Introduction 6
2.2 Building Information Modeling (BIM) 6
2.2.1 Industry Foundation Classes (IFC) 11
2.2.2 Construction-Operations Building Information Exchange (COBIE) 14
2.3 Facilities Management (FM) 18
2.3.1 FM Tools 21
2.4 BIM for FM 22
2.4.1 Current Status of BIM Implementation in FM 22
2.5 Integration and Visualization of FM Data 22
viii
2.5.2 IBM Intelligent Building Management Solution 31
2.6 Augmented Reality (AR) and Data Fusion in Construction 33 2.6.1 Location Tracking Using Ultra Wideband (UWB) Technology 34
2.7 Databases 35
2.8 Summary 36
CHAPTER 3 VISUAL ANALYTICS IN FM 37
3.1 Introduction 37
3.2 Proposed Method for Visual Analytics in FM 38
3.2.1 Standardized Data Integration and New Attributes Definition (step 1) 39 3.2.2 Logical and Spatial Relationships Definition (step 2) 44 3.2.3 Cause-Effect Relationships and Queries Definition (step 3) 46
3.2.4 Visualization (step 4) 51
3.2.5 Visual Analytics Procedure in BIM Tools for FM 58
3.3 Case Study 61
3.3.1 Introduction 61
3.3.2 Software Used in the Case Study 61
3.3.3 Implementation 62
3.4 Summary and Conclusions 72
CHAPTER 4 AUGMENTED REALITY BASED VISUALIZATION OF CONSTRUCTION
ix
4.1 Introduction 75
4.2 Proposed Method for AR-Based Construction and Renovation Operations
Visualization 75
4.3 Case Studies 80
4.3.1 Introduction 80
4.3.2 Visualizing Construction and Renovation Operations Using AR 80
4.4 Summary and Conclusions 87
CHAPTER 5 CONCLUSIONS AND FUTURE WORK 88
5.1 Summary of Research 88
5.2 Conclusions 89
5.3 Limitations and Future Work 90
REFERENCES 93 Appendix A –2D Drawing of Genomics Research Center Mechanical Room 103
Appendix B –BIM Services 104
Appendix C –COBIE 105
Appendix D – Inventory of Air Conditioning and Refrigeration Equipment of Genomics
research center 114
x
LIST OF FIGURES
Figure 2-1 (a) Document Centric vs. (b) Information Centric Approaches
(Sjogren and Kvarsvik, 2007) 8
Figure 2-2 Geometric Model vs. Data Model (Khemlani, 2004) 10
Figure 2-3 Lifecycle Information View (NIBS, 2011) 10
Figure 2-4 IFC Schema Architecture (Buildingsmart-tech, 2011) 13
Figure 2-5 Commissioning Data of Genomics Research Center 16
Figure 2-6 COBIE Process Overview (WBDG, 2011) 17
Figure 2-7 COBIE2 Sixteen Worksheets (WBDG, 2011) 19
Figure 2-8 Transparency Method for the Objects that Have Reached the End of Their Life
Expectancy (Linnert et al., 2000) 27
Figure 2-9 Objects with Different Colors According to Their Ages (Linnert et al., 2000) 27 Figure 2-10 Conceptual Illustration of the Facility Maintenance and Management
Approach (Chen and Wang, 2009) 28
Figure 2-11 Connectivity Example between Two Building Service Elements
(Liebich, 2009) 31
Figure 2-12 Architectural Elements of the Solution (IBM, 2012) 33 Figure 2-13 One-to-Many Relationship Example (Microsoft, 2011) 36 Figure 3-1 (a) Current Practice of Using CMMS, (b) Using BIM-Compatible Tools
xi
Figure 3-2 Conceptual CMMS-BIM Integration for Cause-Effect Visualization 39 Figure 3-3 Current Status (a) and Expected Future (b) of Attributes in IFC, CMMS, and
BIM Tools 40
Figure 3-4 Conceptual COBIE-CMMS Integration Methods 41
Figure 3-5 BIM Model of the Mechanical Room of Genomics Research Center of
Concordia University with Related Pictures and Documents 43 Figure 3-6 Examples of Spatial and Logical Relationships between Components and Space 46
Figure 3-7 Relations between Tables in the Database 49
Figure 3-8 Query of Retrieving the Desired HVAC Components 51
Figure 3-9 Symbols Used to Show Maintenance and Repairs of Components
(Akcamete et al., 2010) 52
Figure 3-10 HVAC 3D components of One Floor during the Maintenance Phase 53
Figure 3-11 Color-Coded Scheme Method 53
Figure 3-12 Visualization of the Results of the Queries 56
Figure 3-13 Components Condition Visualization in 2008 (a), 2009 (b), and 2010 (c) 57 Figure 3-14 Steps of Integration and Visualization of FM Data 60 Figure 3-15 Revit Type Properties Window for Adding COBIE2 Data of a Chiller 63 Figure 3-16 New Properties Defined in FM:Interact for Mechanical Components 64 Figure 3-17 New Properties Defined in Revit for Mechanical Components 65
xii
Figure 3-18 Mapping Components’ Attributes Between FM:Interact and Revit 66
Figure 3-19 Configure Tab 68
Figure 3-20 Properties of a Mechanical Component in Navisworks 69
Figure 3-21 Rules Editor in Navisworks 70
Figure 3-22 Tasks with no Unique Names but Different Times 71 Figure 3-23 Unique Names for the Tasks and the Properties Values 71
Figure 4-1 Conceptual Framework for AR Data Fusion 77
Figure 4-2 Steps of the Proposed Approach for AR 80
Figure 4-3 FOV and Focal Length of a Camera (Adapted from Wikipedia, 2011) 80 Figure 4-4 The Default Revit Camera's Focal Length (Pacific, 2011) 81 Figure 4-5 Floor Plan of the Room and the Setting of the UWB System 82 Figure 4-6 Augmented Reality View of the Task of Shelves Installation 83 Figure 4-7 Floor Plan of the Construction Site and the Setting of the UWB System 84 Figure 4-8 Floor Plan Generated in Revit Showing the Installed Ducts 84
Figure 4-9 Revit Interface for Adding UWB Data 85
Figure 4-10 Augmenting the BIM Model with Picture of Workers and the Traces of
Their Movement 86
xiii
LIST OF TABLES
Table 2-1 BIM Tools Usable for Operation Phase in AECOO Industry 23 Table 2-2 Interrelationship among Various Building Components (Ahluwalia, 2008) 30 Table 3-1 Possible Causes of Heating/Cooling problem in a Space 47
xiv
LIST
OF
ABREVIATIONS
Abbreviation Description
3D Three-dimensional
4D Four-dimensional
AECOO Architecture, Engineering, Construction, Owners, and Operators
AHU Air Handling Unit
API Application Programming Interface BIM Building Information Model
CAD Computer-Aided Design
CMMS Computerized Maintenance Management System
COBIE Construction-Operations Building Information Exchange
FM Facilities Management
IAI International Alliance of Interoperability IDM Information Delivery Manual
HVAC Heating, Ventilation and Air Conditioning IFC Industry Foundation Classes
IFC-mBomb IFC Model Based Operation and Maintenance of Buildings
MM Maintenance and Management
xv
NIBS National Institute of Building Sciences
NBIMS National Building Information Model Standard O&M Operation and Maintenance
1
INTRODUCTION
CHAPTER 1
1.1 GENERAL
The Architecture, Engineering, Construction, Owners, and Operators (AECOO) industry is a fragmented industry which comprises different stakeholders and needs a lot of coordination between these parties. Accordingly, this issue has caused some barriers in communication between the parties which leads to a decreased efficiency. Building Information Modeling (BIM) as an emerging concept is expected to solve the lack of interoperability between software by sharing the information through the facilities lifecycle (Underwood and Isikdag, 2009). “A Building Information Model is a digital representation of physical and functional characteristics of a facility” (WBDG, 2011). Facilities managers need to identify and understand deterioration/failure cause-effect patterns in order to prepare preventive maintenance plans. However, this task is difficult because of the complex interaction between different building components and their operational conditions. In spite of the availability of advanced Computerized Maintenance Management Systems (CMMS), such as Maximo (Maximo, 2011) and FM:Interact (FMSystems, 2011), these systems focus on data management aspects (i.e. asset inventory, repair orders and recourse management) and lack the functions necessary to analyze the collected data in order to identify deterioration/failure patterns. Decisions on maintenance-related works usually are made based on various types of accumulated historical data, such as design drawings, inspection records, sensing data, etc. (Chen and Wang, 2009). Most of these data are text-based which makes it time-consuming and less intuitive for correlating information. Furthermore, inspection history data are not always
2
available for some components, which makes the above task even more difficult. According to Akcamete et al. (2009), storing the history of facilities’ changes is beneficial as facility managers can utilize the historical data of changes for prioritizing maintenance decisions.
Standardization based on BIM provides new opportunities to improve the efficiency of Facilities Management (FM) by sharing and exchanging building information between different applications throughout the lifecycle of the facilities. BIM 3D data can be used in the CMMS where the inspection and maintenance data can be added to the database. The integration of CMMS and BIM data can be used for visualization which can facilitate heuristic problem solving and provide an opportunity for visual analytics. Furthermore, Construction-Operations Building Information Exchange (COBIE) has been developed as another effort towards standardization of FM required data handover by the contractor to the owner at the end of commissioning phase (WBDG, 2011).
Several methods can be used to model the information of O&M processes and to monitor the execution progress of these processes. Among these methods, Building Information Modeling (BIM), video recording, and location tracking of construction resources have been extensively studied in recent Augmented Reality (AR) research. BIM allows to model the components of a building in 3D and to visualize the sequence of the construction processes by linking the schedule information to the 3D model, resulting in a 4D visual simulation (4D BIM, 2011). Video monitoring has been used to record and monitor construction activities for the purposes of claim resolution and for studying the overall performance of the construction project using time-lapse photography (Abeid and Arditi, 2002; Chae and Kano, 2007). Location tracking of construction resources has
3
been suggested as an effective method for progress monitoring (Navon and Sacks, 2007). More recently, location tracking of resources has been proposed by several researchers to capture deviations from the schedule or other changes in the project. Several technologies have been investigated for location tracking including the Global Positioning System (GPS) (Riaz et al., 2006), Radio Frequency Identification (RFID) (Chae and Yoshida, 2008), and Ultra-Wideband (UWB) Real Time Location Systems (RTLS) (Cho et al., 2010).
Each of the above automated methods (e.g. video and RTLS) can provide useful information about the construction processes and has certain advantages and disadvantages. Video monitoring provides a rich visual source of information that can be used by a human observer or can be automatically processed to extract features using video processing techniques (Chae and Kano, 2007). However, processing the video contents is complex and has several limitations (e.g. video occlusion) and does not identify individual workers captured in the video. RTLSs, on the other hand, can identify the individual construction resources (workers, equipment and materials) and their locations over time. However, they do not provide the contextual information about the actual work performed using these resources. Therefore, video and RTLS can also be integrated with BIM and be used to provide better understanding of the progress of construction and renovation operations.
4 1.2 RESEARCH OBJECTIVES
This research work elaborates on the usage of BIM as an emerging and beneficial technology in FM in order to improve the O&M in addition to construction and renovation operations of facilities in terms of cost, time, and quality.
The objectives of this research are: (1) to review current research on the application of BIM in FM and the current status in the practice; (2) to investigate the technical feasibility of integrating COBIE related data with CMMS and BIM; (3) to investigate the feasibility of integrating BIM with CMMS for BIM-based visual analytics to identify potential deterioration/failure and cause-effect relationships; and (4) to identify the potential benefits of integrating BIM, video monitoring, and RTLS in an AR application for visualizing construction and renovation operations.
1.3 THESIS ORGANIZATION
This study will be presented as follows:
Chapter 2 Literature Review: In this chapter, the applications of BIM technology in FM, specifically in terms of integration and visualization, are reviewed. COBIE as a new standard for data handover at commissioning phase and its benefits in comparison with the traditional way of handover is reviewed. Other topics such as Industry Foundation Classes (IFC), databases, and FM software interoperable with BIM are covered in this chapter. This chapter also covers the AR applications in the construction phase, in addition to location tracking using Ultra Wideband (UWB) technology.
5
Chapter 3 Visual Analytics in FM: In this chapter the procedure of integrating CMMS with BIM and then 4D simulator, is explained. This chapter also includes the method of using queries for visual analytics of cause-effect relationships between components and spaces. The steps of integrating COBIE with BIM also are covered in this chapter. A case study is also implemented to prove the validity of the proposed approach.
Chapter 4 Augmented Reality Based Visualization of Construction and Renovation Operations: This chapter proposes a new approach based on AR to visually fuse the data from different sources including a BIM, video monitoring, and an Ultra Wide-Band (UWB) RTLS. The proposed method shows the use of visualization in construction and renovation operations and to retrieve information about the time, space, and activities. A case study about BIM-based visualization of progress monitoring of construction and renovation operations is tested to demonstrate the feasibility of the proposed method. Chapter 5 Conclusions and Future Work: This chapter includes the summary of the present research work, highlights its contributions, explains the limitations and proposes the recommendations for future works.
6
LITERATURE
REVIEW
CHAPTER 2
2.1 INTRODUCTIONIn this chapter, BIM technology in the AECOO industry and the benefits of its usage for FM are reviewed. The literature review starts with BIM technology definition and IFC as the most accepted format and standardized BIM. Then, COBIE as a new standard for FM required data delivery is explained and elaborated. FM and its related tools in terms of compatibility with BIM are also covered in this chapter. The current status of BIM application for FM, integration and visualization of FM data, cause-effect relationships between components, and visual analytics of such relationships are reviewed in this chapter. In addition, Augmented Reality (AR) and data fusion, location tracking using Ultra WideBand(UWB) technology, and databases are reviewed in this chapter as well. Based on search in ProQuest Dissertations & Theses (PQDT), it was found that there are about forty doctoral dissertations and masters theses related to BIM. Out of these forty researches, only three studies where related to FM (PQDT, 2012).
2.2 BUILDING INFORMATION MODELING (BIM)
The AECOO industry is a dynamic, complex, and fragmented industry. According to a study made by the US Bureau of Labor Statistics, all industries have had an increase in productivity by over 200% since 1964. During this period, the AECOO industry has had a decreasing rate in productivity (AIA, 2007). Traditionally, there is a gap between the design and construction disciplines of this industry because the designers and contractors hardly communicate before the start of the construction phase. The lack of construction information in the design phase results in the decrease of quality, and increase of time
7
and cost of the projects. According to the National Institute of Standards and Technology (NIST), the lack of interoperability in the software in the AECOO industry costs $15.8 Billion annually (Uhlik and Lores, 1998). Using FM-related information during the earlier phases can also increase the performance efficiency of the facilities.
BIM is an emerging technology that helps all stakeholders work together, which leads to an increased efficiency. Figure 2-1 (a) shows the document centric approach, which has several challenges for information sharing, and Figure 2-1 (b) shows the centric information approach. According to Sjogren and Kvarsvik (2007) the main issues with the document centric approach are: (1) communication errors and loss of project information within the same domain, and (2) re-entering information on average seven times in different systems before the delivery of the facility to the owner. In the centric information approach, all the stakeholders are able to communicate to each other through a common language by using BIM technology and use a single repository for all the information (Sjogren and Kvarsvik, 2007). BIM helps to create and use coordinated, consistent, and computable information about a building project. In addition, the parametric nature of this information helps in design decision making, production of high-quality construction documents, prediction of building performance, cost estimating, and construction planning (Eastman et al., 2011). BIM can also be used in renovation or demolition work (Becerik-Gerber et al., 2011). Motamedi and Hammad (2009) studied the lifecycle management of facilities components using RFID and BIM.
BIM is a rich model as all the components in BIM have properties and relationships which help for making queries or doing simulation using the model data (Mitchell and Schevers, 2005). According to Mitchell and Schevers (2005), robust geometry,
8
comprehensive and extensible object properties, semantic richness, integrated information, and lifecycle support can be considered as generic attributes of a BIM. BIM is not just using design technologies to display all the building components in a virtual environment or in a 3D representation. BIM can be considered as a transformation of the traditional design delivery process to a more integrated one (Eastman et al., 2011).
Figure 2-1 (a) Document Centric vs. (b) Information Centric Approaches (Sjogren and Kvarsvik, 2007)
The AECOO industry has been changed over the last decades, and buildings have become more complex with more integrated systems which are interconnected. Therefore, as buildings are getting much more complex, designer should consider more factors in the analysis of their designs. BIM makes it possible to have one repository to store all the design components’ data and each component should be described once. BIM provides both graphical and non-graphical data such as drawings, specifications, and schedule. Changes to each item should be done only once and in one place, so all the team members can monitor the changes instantly. One of the benefits of BIM is that BIM
9
makes it possible for all stakeholders to insert, extract, and modify information of the building during the different phases of the facility lifecycle. By using BIM, a 3D simulation of the building and its components can be realized. This helps to predict collisions and to calculate material quantities (Eastman et al., 2011). According to Khemlani (2004), in earlier Computer Aided Design (CAD) systems, building components such as walls, doors, and windows were represented by using geometric entities such as points, lines, rectangles, planes, etc. (Figure 2-2 (a)). BIM-based CAD systems are object oriented in that basic components of drawings are building elements. Furthermore, in traditional 2D and 3D CAD systems, space is not defined explicitly, but in building data model, space is a fundamental part of the building data model that can define the relationships between walls, ceilings, and floors. Figure 2-2 (b) shows the wall-to-space relationship in a building data model. It is also possible to do several types of analysis relevant to the spaces by using BIM, which is not possible by the use of traditional CAD systems.
As shown in Figure 2-3, BIM can be used during the whole lifecycle of a facility from the design phase to the demolition. O&M, guaranties, and other FM-related information can be covered by BIM. By using BIM, Information would be transferred from one phase to the next one. This kind of data flow increases the quality and integrity of information transmission and avoids unnecessary reworks of information management (BuildingSMART, 2011).
10
Figure 2-2 Geometric Model vs. Data Model (Khemlani, 2004)
11 2.2.1 INDUSTRY FOUNDATION CLASSES (IFC)
Building owners are involved in a significant cost that arises from the lack of interoperability with regard to electronic facility information. buildingSMART®, formerly the International Alliance for Interoperability (IAI), has created a non-proprietary construction operations data model called Industry Foundation Classes (IFC). Their goal is providing “a universal basis for process improvement and information sharing in the construction and facilities management industry” (East, 2007).
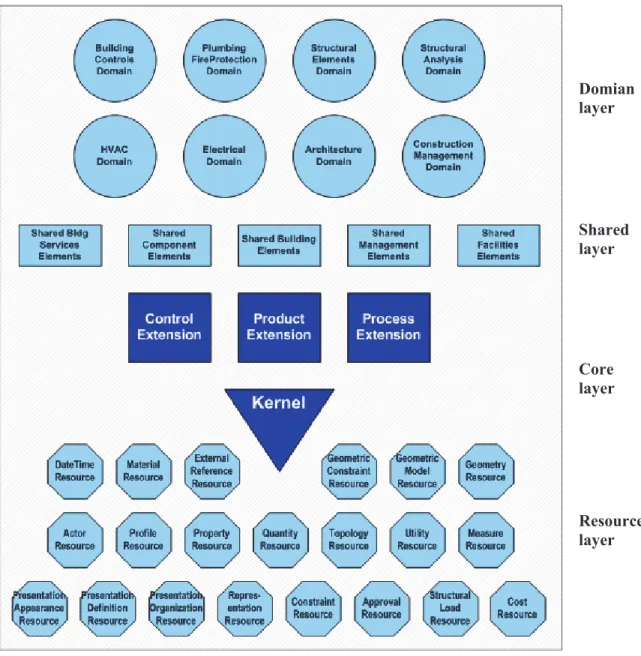
IFC is a common data schema that provides all the proprietary software applications with a common framework to keep and exchange the facility information during all the phases of a facility’s lifecycle (BuildingSMART, 2011). IFC leads to integration in the AECOO industry by defining a universal language to improve communication, productivity, delivery time, cost, and quality throughout the design, construction, operation and maintenance lifecycle of facilities (Mitchell and Schevers, 2005). IFC2x4 is the recent version and IFC is still under development to encompass more data related to facilities lifecycle (WBDG, 2011). STandard for the Exchange of Product model data (STEP) is another effort prior to IFC. STEP was initiated by the International Standard Organization (ISO) and focuses on the standard definitions for the representation and exchange of product information in general. SETP is used in various design disciplines such as mechanical design, ship design, etc. The experience gained in STEP is used to develop a more domain-specific model for the representation of building data by people involved in STEP (Khemlani, 2004). Figure 2-4 shows the IFC schema architecture. The IFC model consists of tangible building components such as walls, doors, beams, and
12
abstract objects such as schedules, activities and so on (khemlani, 2004). The main layers of the IFC schema are (Buildingsmart-tech, 2011):
Domain layer: The entities defined in this layer cannot be referenced by the other layers. This layer contains final specialization of entities. In this layer, the defined entities are conceptually specific to an individual industry discipline.
Shared layer: The defined entities in this layer can be referenced by the entities in the domain layer. This layer has entity definitions for a beam, column, wall, flow controller, sound properties, etc. This layer has most of the common building entities.
Core layer: This layer is the most general layer within the IFC schema architecture. It comprises the basic structure, the fundamental relationships and the common concepts for all entities in the shared and domain layers. This layer contains entities that are abstract concepts to be used for the definition of entities in the higher levels. The defined entities in this layer can be referenced by all entities in the shared element layer and the domain specific layer.
Resource layer: The entities in this layer include basic properties such as geometry, material, quantity, measurement and so on, which are generic and not specific to a building. Entities defined in this layer can be referenced by all entities in the core layer, shared layer, and the domain specific layer. The entities in this layer cannot exist independently and should be referenced by other entities in the other layers.
The IfcSharedFacilitiesElements schema defines basic concepts in the facilities management domain. This schema, in addition to IfcProcessExtension and
13
IfcSharedMgmtElements, provide a set of models for applications intending to exchange data related to the FM domain (Buildingsmart-tech, 2011).
Figure 2-4 IFC Schema Architecture (Buildingsmart-tech, 2011)
Domian layer Shared layer Core layer Resource layer
During the lifecycle of a facility, different participants develop information and results that would be used by other participants later in the project. Information Delivery Manual (IDM) is a method used to define the exchange requirements between different processes,
14
in which specific information provided in IFC by an upstream participant has to be transferred to a downstream party. IFC Model View Definition (MVD) determines the software requirement specifications to implement IFC interface to meet the exchange requirements defined by IDM. IDM is closely associated with MVD so that it can be said that IDM is a formal description of the various business processes, and MVD is how to implement this information in software by using IFC (BuildingSMART, 2011).
Some companies have developed geometry and properties viewers for IFC models. Most of these viewers such as Solibri Model Viewer (Solibri, 2012) and IfcViewer (KIT, 2012) are available to download for free. Some IFC viewers provide displaying selected objects attributes. It is also possible to turn on and off some entities through theses viewers. “IFC viewers are useful for debugging IFC translators, and to verify what data has been translated.”(Eastman et al. 2011). IFC coordination view with the purpose of the sharing of building information models between the major disciplines of architectural, structural, and mechanical tasks during the design phase has been implemented and supported by most recent IFC compatible software. It contains definitions of spatial structure, building, and building service elements, required for the coordination of design data between these disciplines. There are some other IFC view definitions, such as IFC structural analysis view, and each of these views contains several exchange requirements (BuildingSMART, 2011).
2.2.2 CONSTRUCTION-OPERATIONS BUILDING INFORMATION EXCHANGE (COBIE)
Construction industry contracts require the contractors to handover some documents such as equipment list, product data sheets, warranties, and spare part lists to the owner for the
15
O&M phase. The tool used to collect the O&M data as a part of the BIM is called COBIE. It is a data standard for documenting the information needed to increase the efficiency of a facility’s lifecycle and reduce its operating costs (WBDG, 2011). According to commissioning professionals, almost 30% of the content of document-based O&M manuals contains some kind of errors (East and Nisbet, 2010). COBIE collects O&M data as a part of BIM and the goal of COBIE is the improvement of the information capturing method during the design and construction phase in order to use for operations, maintenance, and asset management purposes (East, 2007). IFC-Model Based Operation and Maintenance of Buildings (IFC-mBomb) project showed an approach for data collection during the design and construction phase, and data handover for FM (IFC-mbomb, 2004). However, this project used ad-hoc methods before the development of COBIE.
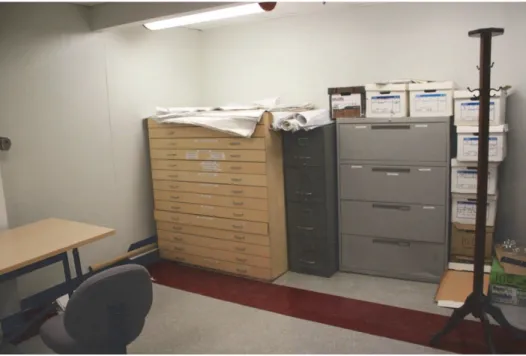
COBIE has been created as a standard by the development team members of National Building Information Model Standard (NBIMS). Moreover, COBIE eliminates the creation and submission of boxes full of construction documents by the contractor to the facility operator at the completion of the construction phase. For example, Figure 2-5 shows the commissioning data of Genomics research center of Concordia University in the paper format where a separate room is specified to these data. As shown in this figure, in the traditional approach, a space should be allocated to keep the commissioning data. In order to complete COBIE, there are some processes occurring in different parts during the design phase that should be considered. These processes include architectural programming, design, construction quality assurance, supply chain management, and
16
asset management. During each of these processes, some information relevant to COBIE can be captured (East, 2007).
Figure 2-5 Commissioning Data of Genomics Research Center
As mentioned previously, some of the information needed for the O&M phase is created during the architectural programming phase. The inventory of spaces and their functional requirements are examples of such information. During the design phase, information such as performance requirements of materials, products, and equipment, can be captured. The installed, tested, and commissioned equipment information is an example of information that can be captured during the construction phase (WBDG, 2011). COBIE helps to capture this information gradually. Its approach is to incrementally identify data exchange requirements that during the time, will build the entire COBIE specification. Between 2005 and 2009, COBIE has grown from an initial idea to an internationally recognized standard implemented in commercial software in the world (BuildingSMARTalliance, 2011).
17
As shown in Figure 2-6, designers provide information about spaces, systems, and equipment layouts. Contractors provide information about product data, as-built layout, tags, serial numbers, warranties, and spares parts of installed equipment (WBDG, 2011).
Figure 2-6 COBIE Process Overview (WBDG, 2011)
COBIE2 version was developed in 2010 including the worksheets and the data which should be entered in the field (WBDG, 2011). In order to simplify the usage of COBIE data by facility managers, Excel format (XLS) spreadsheet can be used. COBIE2 spreadsheet consists of sixteen mandatory worksheets which are contact, facility, floor, space, zone, type, component, system, spare, resource, job, document, attribute, coordinate, connection, and issue which are shown in Figure 2-7. All the worksheets are shown in detail in Appendix C (Figure C-1). Pick-list worksheet is an extra worksheet which is not mandatory and contains information usable for other worksheets. Some of the COBIE2 worksheets such as facility, floor, space, zones, and systems should be completed during the design phase. Type and component worksheets should be completed
18
during both the design and construction phases as during each phase some data related to these two worksheets can be captured. Job, resources, and spare worksheets should be prepared during the construction phase and contacts, documents, issues, coordinates, attributes, and connections worksheets are common and can be prepared during any of the phases (WBDG, 2011).
Specific building systems are required for all projects to allow the spaces to perform as intended. For buildings, these systems include: electrical, heating, ventilating and air conditioning (HVAC), potable water, wastewater, fire protection, intrusion detection and alarms and other systems. Currently an optional COBIE set of data is the connections between equipment. Connections worksheet allows designers to specify how specific equipment are logically connected. For example, these logical connections helps a worker to know what other equipment would be effected if a valve closed. During the design some documents may be found useful for the future use. These documents can be linked by reference to the COBIE’s documents data. The submittal register is a key aspect of COBIE since it is the approved submittals during construction that encompass the large amount of construction handover data sets. So this list can be specified by designers as requirement for documents in COBIE (WBDG, 2011).
2.3 FACILITIES MANAGEMENT (FM)
Facilities O&M include all the widespread services required to assure the built facility to perform the functions for which it was designed and constructed. O&M usually include the day-to-day activities required for the building and its systems and equipment to perform their intended operations. The O&M costs of a facility during its operation phase
19
could be many times more than its initial construction cost (Becerik-Gerber, 2011). Almost 75% of the total cost of a facility is related to the O&M phase (Rundel, 2006).
Figure 2-7 COBIE2 Sixteen Worksheets (WBDG, 2011)
Operations and maintenance are always coupled because a facility cannot be efficiently operated unless it is well maintained. The accuracy, relevancy, and timeliness of well-developed and user-friendly O&M manuals are important issues. So having a detailed, facility-specific O&M manual is required as a part of the commissioning process. The scope of O&M as mentioned includes some activities required to keep the performance of the facility satisfactory. Preventive maintenance consists of a series of time-based maintenance requirements that provide a basis for planning, scheduling, and executing
20
scheduled (planned versus corrective) maintenance. Preventive maintenance includes adjusting, lubricating, cleaning, and replacing components (WBDG, 2011).
Computer Aided Facilities Management (CAFM) and Computerized Maintenance Management Systems (CMMSs) are useful tools for managing facilities during the O&M phase. The recreation of information usually should be done due to the loss of information during facility lifecycle phases. The access to a rich source of information alone does not guaranty the improvement. Information sharing and the improvement of process are important (Singh et al., 2009). The collaboration between the facility manager and planner can lead to decrease the FM cost. For example, providing the planner with the condition data collected by the facility manager during periods eliminates the cost of recollection and making decisions without such data (Singh et al., 2009).
Facility managers have the responsibility of keeping the function of the built environment by integrating people, place, process, and technology which can be done in more efficient way by using BIM technology (IFMA, 2011). Therefore, owners and facility managers can decrease the cost arising from the lack of interoperability by using high quality BIM during the most expensive O&M phase (Rundel, 2006). BIM of a facility can be used for asset management, space planning, and maintenance scheduling. The long term owner who knows the lifecycle cost concepts can understand the value of having an up-to-date data rich, query-able model of his or her building. BIM reduces the risk during the construction phase so the owners can decrease costs (Anderson, 2010).
Moreover, BIM provides the FM with the updated as-built plans which are useful for tenant’s issues (Eastman et al., 2011). For example, when a tenant wants to build out a
21
space, the facility executive typically has to ask the architect for a set of as-built drawings that may or may not be accurate, depending on the building’s age and how many tenants have occupied the space (FacilitiesNet, 2008). In addition, the knowledge gained during the O&M phase can be transferred through the BIM model (Becerik-Gerber, 2011). Efficient transfer of requirements, design, and as-built construction data to the O&M phase is critical; however, this transfer has not been fully considered in the current practices (Mitchell and Schevers, 2005). BIM is still under development, and it can support FM practices with its functions such as visualization, analysis, and so on (Becerik-Gerber et al., 2011).
2.3.1 FMTOOLS
As mentioned before, the main goal of BIM is increasing the communication and collaboration between stakeholders through data interoperability during the whole phases of a facility’s lifecycle. Although there are some open BIM formats claiming to meet BIM requirements, IFC can be considered as the most adopted interoperability format in the AECOO industry. From the interoperability point of view, FM tools which support the most updated IFC version can be considered as BIM-compatible tools. Some tools which meet some of the BIM definitions but do not support IFC are still considered as BIM-compatible tools by some studies (IBC, 2011).
The Institute for BIM in Canada (IBC) (2011) has recently published the Environmental Scan of BIM Tools and Standards which introduces BIM-compatible tools and their features, usable for planning & design, construction, and operations phases. In addition, Ahamed et al. (2010) has also introduced some commercial software used in FM sector.
22
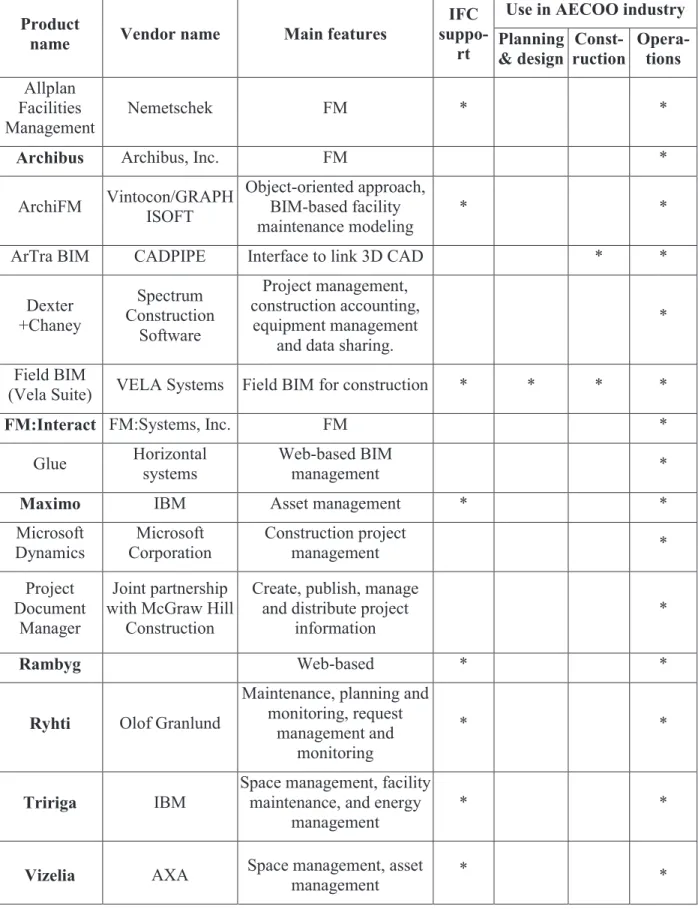
However, some of this software do not support IFC format, but are categorized as BIM tools. Table 2-1 shows the tools usable in the operation phase. Some of these tools are identified and added to the table by the author (shown in bold).
2.4 BIM FOR FM
2.4.1 CURRENT STATUS OF BIMIMPLEMENTATION IN FM
Becerik-Gerber et al. (2011) have done interviews with FM personnel to identify the role of BIM in FM. Their study shows that most of current FM functions are done manually and that using BIM in FM can decrease chances of errors and increase efficiency. They have also investigated the barriers in the implementation of BIM in FM. These barriers include: unclear and unmeasured benefits of BIM application in FM, lack of interoperability between BIM and CMMS, lack of demand for BIM by the owners at the commissioning phase, and lack of FM staffs’ knowledge about BIM.
2.5 INTEGRATION AND VISUALIZATION OF FMDATA
As mentioned in Section 2.2.1, IFC is an open BIM standard for data sharing and exchanging in AECOO industry. IFC Extensible Markup Language (ifcXML) is one of the most effective formats to transfer data to CMMS (NBIMS, 2007). However, the representation of operation, inspection and maintenance information in IFC is still under development. Hassanain et al. (2000) have proposed an IFC-based data model for integrated maintenance management. The proposed approach includes entities, such as IfcCondition, IfcInspection, IfcRresource, and IfcCostElement for supporting FM integrated systems.
23
Table 2-1 BIM Tools Usable for Operation Phase in AECOO Industry
Product
name Vendor name Main features
IFC
suppo-rt
Use in AECOO industry Planning & design Const- ruction Opera- tions Allplan Facilities Management Nemetschek FM * *
Archibus Archibus, Inc. FM *
ArchiFM Vintocon/GRAPH ISOFT Object-oriented approach, BIM-based facility maintenance modeling * *
ArTra BIM CADPIPE Interface to link 3D CAD * *
Dexter +Chaney Spectrum Construction Software Project management, construction accounting, equipment management and data sharing.
*
Field BIM
(Vela Suite) VELA Systems Field BIM for construction * * * *
FM:Interact FM:Systems, Inc. FM *
Glue Horizontal
systems
Web-based BIM
management *
Maximo IBM Asset management * *
Microsoft Dynamics Microsoft Corporation Construction project management * Project Document Manager Joint partnership with McGraw Hill
Construction
Create, publish, manage and distribute project
information
*
Rambyg Web-based * *
Ryhti Olof Granlund
Maintenance, planning and monitoring, request
management and monitoring
* *
Tririga IBM
Space management, facility maintenance, and energy
management
* *
Vizelia AXA Space management, asset
24
The IfcFacilitiesMgmtDomain schema provides a set of models that can be used to exchange information for managing the movement of people and equipment, capturing information concerning the condition of components and assets, capturing requests for action to be carried out and so on. In order to increase the efficiency of FM, the integration of COBIE data in BIM and FM software would be beneficial. There is a possibility to add COBIE data to BIM-based tools such as Revit (Autodesk, 2011). In addition, CMMS database can be populated by COBIE data directly (Maximo, 2011). Kyle et al. (2002) developed a decision support tool for asset managers to predict the service life in asset management plans in 2D. According to Kyle et al. (2002), the visualization of natively non-visual data for large asset inventories can be a highly useful cognitive aid for grasping the overwhelming amount of information required for decision making in asset management. The availability of a standard data and information flow in the domain of “Service Life Asset Management” is identified as a major requirement. Hallberg and Tarandi (2011) used a BIM tool as a repository and media to present lifecycle information of the exterior part of a hospital building. In their case study, attributes such as “Date of inspection” and “Condition class” were added as additional object attributes and visualized in a 3D model. They have also used degradation models to visualize performance-over-time of windows and the concrete structure in the 4D model by the use of a color scale. The first degradation model is the performance-over-time of windows in terms of condition classes, classified in five conditions from “as new” to “extremely bad”. Each condition is represented by a color that changes with the passage of time. The second degradation model is a carbonation model and shows the dynamic relation between the depth of carbonated concrete and the depth of the
25
protecting concrete cover by the pass of time. They argued that visualization and simulation of degradation in 4D will give a more understandable overview of the lifecycle performance and maintenance, repair and rehabilitation (MR&R) needs of buildings than if presented in tables and graphs.
Work orders are usually used as the main source of information related to component maintenance. Work order information is usually stored in paper format or in CMMS and not considered with other facility information such as space, component, system, etc. (Akcamete et al. 2011). Akcamete et al. (2011) have stored and visualized work orders information in a 3D digital facility information database to do spatio-temporal analysis. For this purpose, the trend of maintenance and repair tasks for proactive maintenance decisions is obtained and the work orders are linked with BIM for spatio-temporal analysis. The comparison of the amount of work orders associated with spaces and components are visualized. They have used the weekly number of hot/cold calls and thermostat re-calibration work orders for a specific space. They resulted through the line chart that the thermostat re-calibration work orders may be the cause of hot/cold calls as both of them had almost the same number of work orders during a specific time. Visualizing the amount of work orders alone can be useful to see which components or spaces have abnormal amount of work orders. Work orders history of a room or a component for a relatively long period is used to visualize the trends by using static line charts.
Kaetzel and Clifton (1995) identified visual information as an increasingly important aid in the display of knowledge that will improve the usefulness of expert systems. Although 4D visualization is mainly used in construction scheduling, progress management and
26
workspace planning (e.g., Hammad and Motamedi, 2007; Staub-French and Khanzode, 2007; Dawood and Mallasi, 2006), it can also help to get a better overview of Service Life Performance Analysis (SLPA) results, as the performance-over-time of buildings is characterized by spatio-temporal and logical oriented behavior (Hallberg and Tarandi 2011). Rad and Khosrowshahi (1997) and Khosrowshahi and Banissi (2001), demonstrated 4D visualization of some components for building maintenance where the life expectancy of components is mathematically calculated. In their research, a 4D visual model is used as a tool for lifecycle performance evaluation to assist in the development of long-term maintenance plans.
Linnert et al. (2000) used 4D visualization to demonstrate the behavior of a single-family house during its lifecycle and they used two methods for visualization. In the first method, when a building component service life is reached, it becomes transparent (Figure 2-8). In the second method, the building component changes color as it becomes older based on a color scale (Figure 2-9).
27
Figure 2-8 Transparency Method for the Objects that Have Reached the End of Their Life Expectancy (Linnert et al., 2000)
Figure 2-9 Objects with Different Colors According to their Ages (Linnert et al., 2000)
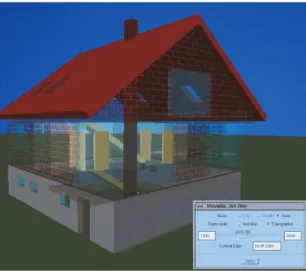
Bjørkhaug et al. (2005) presented a web-based and IFC-compatible application for lifecycle analysis based on dose-response functions. However, lifecycle analyses results were not visualized in 3D models. Chen and Wang (2009) proposed a 3D visualized approach for maintenance and management of facilities that uses an external database and OpenGL technology to build a virtual facility where the administrators can select components and obtain the maintenance or management information (Figure 2-10).
28
Figure 2-10 Conceptual Illustration of the Facility Maintenance and Management approach (Chen and Wang, 2009)
2.5.1 VISUAL ANALYTICS FOR CAPTURING CAUSE-EFFECT RELATIONSHIPS
Analyzing causes-effect patterns can be done using field studies, statistical analysis and data-mining methods. The spatial distribution of identified problems is an important factor that is not easy to capture without having a detailed model of the facility that can be used to visualize the location and distribution of detected problems in 3D or 4D. El-Ammari et al. (2006) have investigated the integration and visualization issues in large-scale location-based FM systems. However, they did not consider the potential deterioration cause-effect relationships. Wang et al. (2010) have developed an interactive visual analytics system for bridge management. However, in order to apply this type of visual analysis, it is necessary to integrate the data of CMMS with a 3D model of the
29
facility. For example, Akcamete et al. (2010) have demonstrated the benefits of using the 3D visualization capabilities of BIM to identify maintenance trends. However, in that study, the data have been manually added to the BIM because of the lack of interoperability of the CMMS and the BIM software.
Ahluwalia (2008) and Hegazy et al. (2010) have developed indicators of the condition of five building components (roof, window, boiler, secondary switchgear and fire alarm system) using reactive maintenance data. They have also identified some interrelationships among various building components. For example, if horizontal and vertical cracks on a load-bearing wall are found, the reason could be water infiltration in the cavity wall. Table 2-2 shows the interrelationships among various building components (Ahluwalia, 2008).
Defining the relationships between components and spaces in BIM is the most important and useful issue related to the topology of a building. Some of these relationships are already defined in IFC and have been standardized. There are two ways of connectivity between components in IFC which are physical and logical. In logical connectivity, there is no physical connection between two components. Logical connectivity can be interpreted as non-physical connection. E.g. the connection between a light switch and a light fixture can be considered as logical connectivity as the cable which connects the switch with a light will not be instantiated in the model so there will not be a physical connection. It is not possible in logical connectivity to explain and model a cable in detail (Liebich, 2009). In logical connectivity, components are connected via ports, but in physical connectivity components are connected via a realizing element such as IfcFlowFitting.
30
Table 2-2 Interrelationship among Various Building Components (Ahluwalia, 2008)
Observation Cause Check Result Strategy
Low room heating/cooling
Window/door not closing properly (functional problem)
Check for hardware problems More load on mechanical system Repair window/door problem Horizontal and vertical cracks on load-bearing wall Water Infiltration in cavity wall
Check for roof flashing (cracks on above level), or foundation problems
If cracks on upper level, infer repair flashing; else repair foundation Repair foundation or roof flashing Damaged ceiling in washroom Plumbing fixtures leakage at upper level Check washrooms on upper floor Mould formation (health and safety concern) Repair plumbing leakage on top floor Damaged/old breaching or boiler Breaching or boiler repair/ replacement Check boiler condition (replacement/repair) and review breaching condition accordingly Inoperable boiler or highly deteriorated breaching Boiler and breaching go together Sudden outburst of water from water fountain on main floor Clogging/blockage in pipes Check for hydrostatic pressure in the sewage pipe
Ceiling damaged Clear and depressurize pressure in sewage pipe
In IFC, IfcRelConnectsElements is used for physical connectivity and IfcRelConnectsPorts is used for logical connectivity between building components. Figure 2-11 shows an example of connectivity between two building service elements “Tee” and “Duct” (Liebich, 2011). In this figure, IfcRelConnectsPorts is used to connect the Tee to the Duct where only compatible elements are allowed to connect to each other. If the optional attribute RealizingElement of IfcRelConnectsPorts which is the
31
“Connector” in this figure is used, the connectivity is changed from a logical connectivity to a physical one (Becker et al., 2011).
Figure 2-11 Connectivity Example Between Two Building Service Elements (Liebich, 2009)
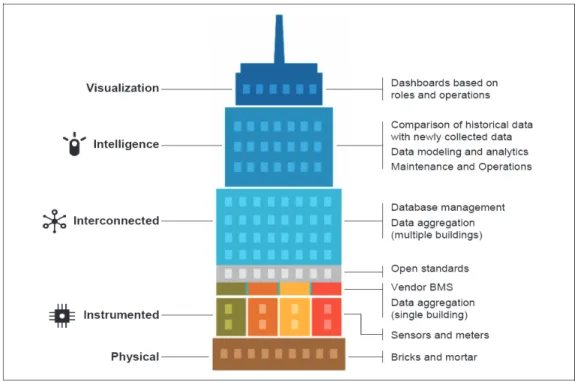
2.5.2 IBMINTELLIGENT BUILDING MANAGEMENT SOLUTION
The IBM Intelligent Building Management solution was built and designed around the elements of visualization, intelligence, interconnected, instrumented and physical as illustrated in Figure 2-11 (IBM, 2012). Each layer identified in this figure provides an important aspect of the solution: (1) The physical layer contains the actual equipment and physical elements that need to be monitored. (2) The instrumented layer contains the building management system (BMS), which collects all of the real-time meter and sensor data. It aggregates this data into meaningful and actionable information. The BMS is configured to raise alarms based on client-defined thresholds. (3) The interconnected layer contains two domain areas. One domain area uses open standards to collect the necessary metrics and alarms from the various BMS installed across the enterprise. The
32
other domain aggregates BMS data into a single normalized format. With this aggregation, access is available to information that was unavailable previously from an enterprise perspective. (4) The intelligence layer provides the analytics, maintenance, and operational activities. This information enables the understanding of the optimum operating parameters for energy assets. It also enables management to act immediately in response to events, such as operational malfunctions. It provides ongoing visibility to energy efficiency over time, reducing energy waste. Maintenance and operational activities are enhanced with more information coming from BMS analytics and real-time alerts. This information enables technicians to identify the problem quickly, so that they can resolve it sooner. (5) The visualization layer makes valuable cross-system information viewable on a single dashboard. Combining previously unrelated data and business logic from two or more sources can create new insights. The dashboard is role-based, with access control. By using the dashboard, the operator can launch other applications that are appropriate to the context of the work that the operator is currently performing.
Although the IBM solution has powerful tools for analytics and visualization, it does not provide visual analytics functionalities.
33
Figure 2-12 Architectural Elements of the Solution (IBM, 2012)
2.6 AUGMENTED REALITY (AR) AND DATA FUSION IN CONSTRUCTION
Augmented Reality (AR) integrates a real-time view of the user’s environment and virtual objects within the same environment. Either the real view or the virtual view can be used as a background while the other type of objects can be superimposed and form a composite view. AR can extend the perception capabilities of the user in the real world and his or her interaction with its objects, providing information that the user cannot detect personally and directly (Izkara et al., 2007). AR has been used in construction for supporting bridge inspection (Hammad et al. 2002), for visualizing construction equipment operations (e.g., Behzadan et al., 2008), for supporting the interaction of two users operating two virtual cranes and communicating with each other (Hammad et al., 2009), and for automatic construction progress monitoring (Golparvar-Fard et al., 2009).
34
Data fusion was initially defined by the U.S. Joint Directors of Laboratories (JDL). Data fusion involves combining information in the broadest sense to estimate or predict the state of some aspect of the universe (Steinberg and Bowman, 2001). Shahandashti et al. (2011) have reviewed some examples of recent applications of data fusion in civil engineering and have presented some of the potential benefits, such as enhancing confidence, improving system reliability, reducing ambiguity, improving detection, extending spatial and temporal coverage in sensing systems, and increasing dimensionality. However, the possibilities of using AR and data fusion in O&M have not been explored yet.
2.6.1 LOCATION TRACKING USING ULTRA WIDEBAND (UWB)TECHNOLOGY
Several tracking methods can be used for tracking the location of objects in AR applications such as GPS and Real Time Location System (RTLS). UWB is a RTLS wireless technology for transmitting large amounts of digital data over a wide spectrum of frequency bands at very low power (less than 0.5 milliwatts) (Ghavami et al., 2004). Researchers have started to investigate the usability of UWB on construction sites. For example, Teizer et al. (2007) have investigated the usability of a UWB tag attached to a crane hook to track the position of the hook. Giretti et al. (2009) have indicated that UWB behavior is rather constant during most parts of the construction progress. They have noted that, in an open area, tests confirm an accuracy of about 30 cm. Cho et al. (2010) have discussed error modeling for an untethered UWB system for indoor construction asset tracking. Zhang et al. (2010) and Rodriguez et al. (2010) have discussed the feasibility of tracking construction resources for better productivity and safety on site. UWB is used as the location tracking method for AR in this research.
35
2.7 DATABASES
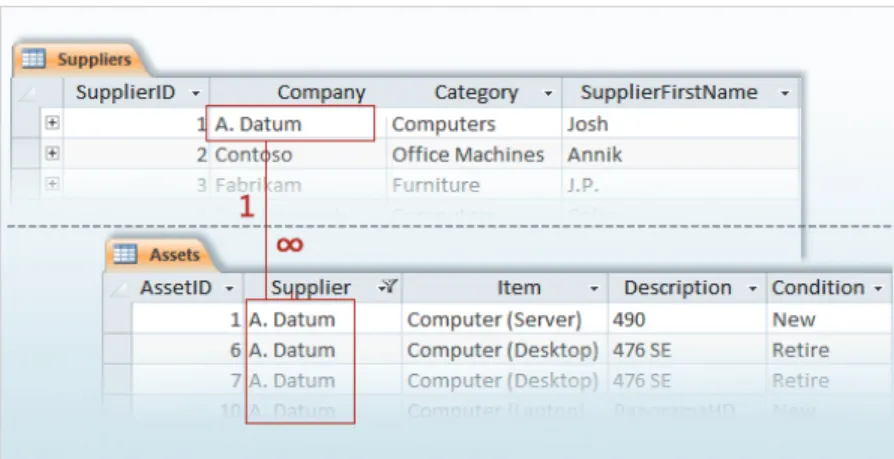
A database is composed of tables to store data and a relational database contains tables that are related together. CMMSs such as FM:Interact use a relational database to store and present FM data (FM:Systems, 2011). In addition, BIM is supported by a database to store and retrieve required data. For this matter, databases are used in this research. For the creation of relationships, a field from one table should be used as a field in a related table. A primary key is a field, or a combination of fields, with a value that makes each record or each row in a table unique. Each table in a database has a primary key which is included as a new field in another table to create a relationship with that table. The new created field in the second table which is a shared primary key of another table is called a foreign key. There are three different kinds of relationships between tables. One-to-one is used when a single record in one table is related to a single record in another table, and vice versa. One-to-many is used when one record in a table is related to many records in another table. For example, one supplier can provide many assets, so the Suppliers table resides on the “one” side of the relationship, while the Assets table sits on the “many” side (Figure 2-13). Many-to-many relationship can be used for relating several records in one table to several records in another table (Microsoft, 2012).
Structured Query Language (SQL) is a standard language for accessing and manipulating databases. Data can be retrieved from a database through queries (Wikipedia, 2012).
36
Figure 2-13 One-to-Many Relationship Example (Microsoft, 2012)
2.8 SUMMARY
In this chapter BIM technology, data exchange standardization, FM and the benefits of BIM applications for FM were reviewed. Moreover, AR technology and its usage in AECOO is explained. The literature showed that BIM technology can increase the productivity and efficiency in AECOO industry. This chapter showed the importance of using standardized open BIM for FM in terms of visualization during the O&M phase which is the most costly phase of facility’s lifecycle. Our proposed approach is based on the reviewed literature related to technologies and standards in AECOO industry.
37
VISUAL
ANALYTICS
IN
FM
CHAPTER 3
3.1 INTRODUCTIONAs explained in Section 2.3, O&M is the most costly phase of facility’s lifecycle. The completeness and correctness of FM required data have a significant impact on the O&M quality. BIM can improve the quality of FM as BIM covers the whole lifecycle of a facility from the design phase until the demolishing phase. At the same time, COBIE as a standardized specification can be used for data exchange between contractors and owners. Visualization is one of BIM’s benefits which can help to improve the quality of FM.
In this research, based on related literature review in Subsection 2.5.1 and on interviews with the personnel of the FM department of Concordia University, several potential deterioration/failure cause-effect relationships were identified based on inspection and condition assessment results and maintenance history data of facilities’ components. An example of visual analytics in the context of FM is the visualization of all possible causes of heat problems in a room. Visualizing the relationship between cracked/repainted walls and possible causes, such as plumbing problems, based on inspection and maintenance history data is another example. In order to realize visual analytics for FM, a database structure and several queries were defined by combining several assets’ attributes based on the identified cause-effect relationships. These queries provide the opportunity for facilities managers and technicians to visualize and analyze a large amount of data. Furthermore, we investigated visualization methods to improve the efficiency of the visual analytics.
38
Figure 3-1 (a) shows the current practice of using CMMS. A technician inputs data, such as inspection and maintenance information, into the CMMS database. At the same time, he/she can retrieve the information related to work orders. Facilities managers are provided with reports regarding maintenance issues. Figure 3-1 (b) demonstrates the proposed approach using BIM-compatible tools to visualize FM data. CMMS can complement all needed data for a comprehensive BIM database. In this approach, CMMS and the visual analytics engine use a BIM database to store data, so both facilities managers and technicians can have FM data visualization by making queries.
Database CMMS FM Data (Inspection/ Maintenance Results) Report FM Technician FM Manager BIM CMMS Report FM Technician FM Manager Visual Analytics Engine Visualization Visualization FM Data (Inspection/ Maintenance Results) (a) (b)
Figure 3-1 (a) Current Practice of Using CMMS, (b) Using BIM-Compatible Tools to Visualize FM Data
3.2 PROPOSED METHOD FOR VISUAL ANALYTICS IN FM
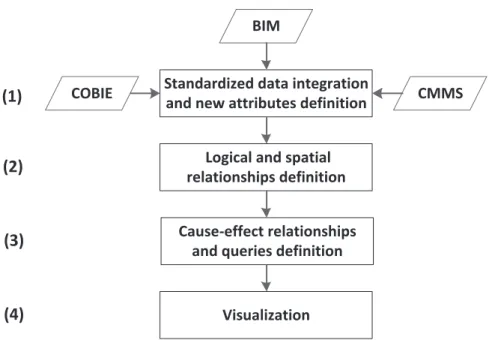
Figure 3-2 conceptually shows the steps of the integration and visualization of FM data. These steps include: (1) Standardized data integration and new attributes definition, (2)
39
Logical and spatial relationships definition, (3) Cause-effect relationships and queries definition, and (4) Visualization. These steps are explained in detail in the following Subsections.
Logical and spatial relationships definition COBIE
Cause-effect relationships and queries definition
Visualization
Standardized data integration
and new attributes definition CMMS BIM
(1)
(2)
(3)
(4)
Figure 3-2 Conceptual CMMS-BIM Integration for Cause-Effect Visualization
3.2.1 STANDARDIZED DATA INTEGRATION AND NEW ATTRIBUTES DEFINITION (STEP 1)
As mentioned in Subsection 2.2.1, IFC is a widely accepted standard format between based tools and CMMSs for data sharing and exchange. However, most of the BIM-compatible tools which support IFC do not completely comply with IFC2x4. Moreover, as mentioned in Subsection 2.2.2, COBIE provides facilities managers with the O&M required data. COBIE2 is the latest version and contains various data related to the O&M of buildings. However, some data are still required to be added to COBIE2 such as inspection frequency data. As BIM has not been fully developed yet, COBIE is considered in our research as a separate data source. Eventually, BIM will encompass all the information related to a facility and COBIE data will be a part of BIM. The lack of
40
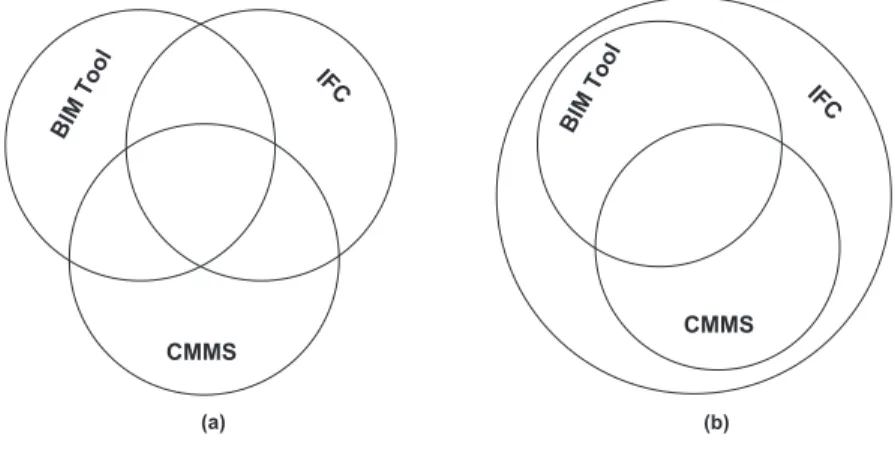
standardization makes it difficult for BIM tools and CMMSs to interoperate with each other. The first step in our approach is to integrate data from COBIE, BIM and CMMS (Figure 3-2). Figure 3-3 conceptually shows the overlapping of data in the current status of practice (a) and in the future (b). In the current status of practice (a), some attributes such as cost are already defined and common between IFC, CMMS, and BIM tools. There are some other attributes which are defined in IFC, and some CMMS and BIM tools. In the future, it is expected that IFC as the standardized format for interoperability will include all the attributes defined in CMMS and BIM tools.
CMMS BIM Tool CMMS IFC IFC BIM Tool (a) (b)
Figure 3-3 Current Status (a) and Expected Future (b) of Attributes in IFC, CMMS, and BIM Tools
Integration of commissioning data with BIM
Figure 3-4 shows the different scenarios of the integration of facilities lifecycle data. In this figure, (a) shows the current status of practice for the integration of commissioning data with the CMMS. In this method, the commissioning data is manually entered in a CMMS. This method is not efficient and is prone to errors. (b) and (c) show the short term proposed plans for the O&M data integration where in (b), the COBIE file is prepared using commissioning data and then is exported to the CMMS database using an
41
API, and in (c), commissioning data is added to the 3D BIM in the BIM tool and then is used to populate the database of the CMMS using an API. (d) shows the future vision, where the BIM database will encompass all the lifecycle data. In this case, the CMMS and the BIM tool can interact with the BIM database for different purposes such as visualization.
Commissioning dada Data entry CMMS API
(a)
COBIE file
(XLS, IFC, ...) CMMS
Commissioning dada BIM tool
(Revit, ...) CMMS
COBIE add-In CMMS API
BIM tool CMMS BIM Database Lifecycle data (design, COBIE, Schedule) (b) (c)
Commissioning dada Data entry CMMS
(d)
Figure 3-4 Conceptual COBIE-CMMS Integration Methods
Integration of O&M data with BIM
As explained in Subsection 2.5, Hallberg and Tarandi (2011) have studied the 4D visualization technology usage in the performance-over-time behavior of components. They have used a BIM-based design tool as the repository of the inspection data of a facility. As explained in Subsection 2.3.1, most of the available CMMSs are not compatible with BIM and they do not fully support IFC. On the other side, 3D models are not used as the repository of O&M data by facilities managers. Synchronizing