LETTER
Systematic difference
between first-motion and waveform-inversion
solutions for shallow offshore earthquakes due
to a low-angle dipping slab
Shunsuke Takemura
*, Katsuhiko Shiomi, Takeshi Kimura and Tatsuhiko Saito
Abstract
Systematic difference between first-motion and waveform-inversion solutions for shallow offshore earthquakes was examined by using the seismograms of the 2016 Off Mie (Mw 5.8) earthquake occurred at a depth of 14 km south-east off of the Kii peninsula, central Japan. Observed seismograms illustrated first arrivals with an apparent velocity of 7.2 km/s, which is faster than crustal P waves. The apparent velocity and polarization pattern of the first arrivals were reproduced by a finite-difference method simulation incorporating the three-dimensional Philippine Sea slab. The first arrivals consist of P waves radiated downward from the source, passing the oceanic Moho as head waves. Thus, a first-motion analysis, assuming a one-dimensional structure, causes incorrect estimations of the focal mechanisms and hypocenter depths, which tend to be deeper than the actual ones. Our result possibly indicates that the seismic-ity above the oceanic Moho was underestimated in the previous catalogs.
Keywords: Focal mechanism, First-motion polarization, Head wave, Nankai Trough, Philippine Sea slab
© 2016 The Author(s). This article is distributed under the terms of the Creative Commons Attribution 4.0 International License (http://creativecommons.org/licenses/by/4.0/), which permits unrestricted use, distribution, and reproduction in any medium, provided you give appropriate credit to the original author(s) and the source, provide a link to the Creative Commons license, and indicate if changes were made.
Introduction
The Philippine Sea slab (PHS) is subducting beneath south-western Japan along the Nankai Trough at a rate of 2–6 cm per year (e.g., Seno et al. 1993; Heki and Miyazaki 2001). Due to the subduction of the PHS, large (M > 8) interplate earthquakes repeatedly occurred at recurrence intervals of approximately 100–150 years (e.g., Ando 1975). Indeed, in this area, a slip deficit was widely documented based on GPS Earth Observation Network (GEONET) and seafloor geodetic observations (e.g., Hashimoto et al. 2004; Yokota et al. 2016). This means that stress is being accumulated in preparation for future large earthquakes. On the basis of the current slip deficit rate and assuming other geophysi-cal parameters such as the recurrence interval and the fric-tion law, significant tsunamigenic earthquake scenarios have been proposed (e.g., Hori et al. 2004; Hok et al. 2011; Kim et al. 2016). In addition to seismic velocity structure
and seismicity, several phenomena such as non-volcanic tremors, very low-frequency earthquakes, and slow-slip events have been extensively studied around the subduct-ing PHS slab in order to understand the mechanisms of the large interplate earthquakes (e.g., Ozawa et al. 2002; Obara
2002; Shiomi et al. 2006, 2008; Shelly et al. 2007; Hirose et al. 2008; Citak et al. 2012; Matsuzawa et al. 2013; Kim et al. 2016; Kita and Matsubara 2016; Takagi et al. 2016).
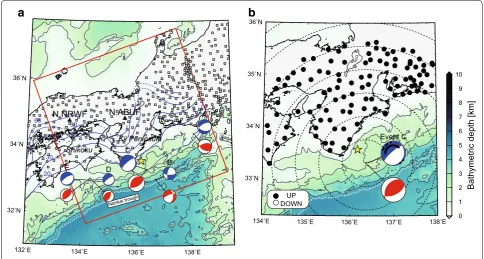
Referring from combined catalog of the ISC–GEM cata-log (Storchak et al. 2013) and the unified hypocenter cata-log of the Japan Meteorocata-logical Agency (JMA) over the 1909–2015 period, the seismicity in this region was very low except for the 1944 Tonankai (MJMA 7.9), 1946 Nan-kai (MJMA 8), 2004 Off Kii peninsula (MJMA 7.4), and 2009 Suruga Bay (MJMA 6.5) earthquakes and their aftershocks. On April 1, 2016, a shallow Mw 5.8 earthquake (2016 Off Mie earthquake; Event C in Fig. 1) suddenly occurred at the southeast off of Kii peninsula, central Japan. The epicenter of the 2016 Off Mie earthquake is very close to that of the 1944 Tonankai earthquake (yellow star in Fig. 1). During this earthquake, seismograms were widely
Open Access
*Correspondence: [email protected]
recorded by dense seismic networks, such as high-sensi-tivity seismograph network (Hi-net) and full-range seis-mograph network (F-net) operated by National Research Institute for Earth Science and Disaster Resilience, Japan (NIED) (Okada et al. 2004). First-motion polarization analysis, a useful tool for studying small earthquakes (e.g., Thurber et al. 2006; Kato et al. 2011), gave a nor-mal faulting for this earthquake mechanism (blue focal sphere in Fig. 1). On the other hand, an F-net routine moment tensor (MT) solution (Fukuyama et al. 1998), which is estimated by inversion analysis using the long-period displacement waveforms, was characterized by a reverse faulting mechanism (red focal sphere in Fig. 1). Similar differences in the estimated solutions commonly appeared for other offshore earthquakes, showing almost opposite directions of pressure and tension axes. Hori (2002) suggested that such difference in focal mechanism solutions for offshore earthquakes might be caused by the difference between initial and total rupture processes. If this was the major cause, the difference should appear in larger earthquakes as well, since they have complex source rupture processes. In our study region, however, the dif-ference appears irrespective of the event magnitudes, and
first-motion analysis tended to overestimate hypocenter depths (see Additional file 1: Table S1). This suggests that the difference may primarily be due to a characteristic subsurface structure, rather than the rupture process.
Using Hi-net waveforms during the 2016 Off Mie earthquake, we propose that the misestimation of focal mechanisms and depths for first-motion polarization analysis is caused by subsurface structure related to the geometry of the low-angle dipping slab. Our hypothesis is validated via finite-difference method (FDM) simula-tions of seismic wave propagation using a three-dimen-sional (3D) heterogeneous velocity structure model. We also discuss the effects of the dipping slab on hypocenter location and seismicity by first-motion analysis in the other subduction zones.
Observed first‑motion polarization and propagation during the 2016 Off Mie earthquake
During the 2016 Off Mie earthquake, almost all sta-tions observed upward polarizasta-tions in the first motion (Fig. 1b), which could not be reproduced by the F-net MT solution in a homogeneous medium. Similar features
132˚E 134˚E 136˚E 138˚E
32˚N 34˚N
36˚N
Saga
Nankai troug h
N.NRWF N.ABUF
E D
C
B
A
134˚E 135˚E 136˚E 137˚E 138˚E
33˚N 34˚N 35˚N 36˚N
Event C
0 1 2 3 4 5 6 7 8 9 10
Bathymetric depth [km]
UP DOWN
b
a
Kii Peninsula Shikoku
10 20
30 40 50 60
Fig. 1 Map and focal mechanisms of target earthquakes. a Map of southwest Japan and estimated focal mechanisms, b distribution of first-motion
polarizations during the 2016 Off Mie earthquake. Gray squares in (a) are locations of Hi-net stations. Black triangles are locations of F-net stations
used in waveform comparisons (Fig. 3d). Red and blue focal spheres represent focal mechanisms of the moment tensor solution and those of the
first-motion solution, respectively. Blue isodepth lines of the upper surface of the Philippine Sea plate are shown at 10-km intervals (Baba et al. 2002;
Hirose et al. 2008). The yellow star represents the epicenter of the 1944 Tonankai earthquake provided by the JMA catalog. Dashed lines in (b)
were found in four other earthquakes (Additional file 1: Figure S2). Furthermore, although most hypocenter depths estimated by first-motion analysis were deeper than the depth of the oceanic Moho of the PHS (~19 km), the MT solutions indicated that the earthquakes occurred at the interface or within the oceanic crust of the PHS (see Additional file 1: Table S1 and colors of focal spheres in Additional file 1: Figure S1).
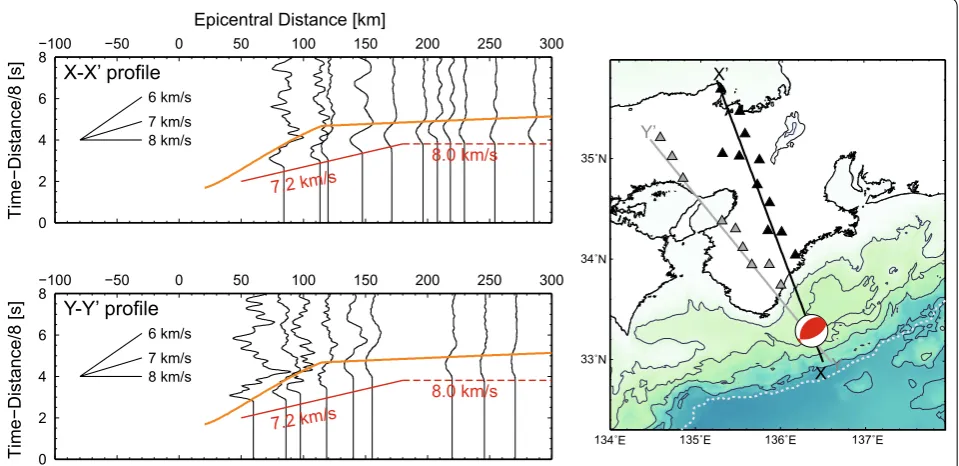
Record sections of vertical velocity seismograms at Hi-net stations (Fig. 2) revealed how upward first motions propagated through the heterogeneous subsurface structure of the Nankai subduction zone. The frequency response of the Hi-net sensors was corrected using the software of Maeda et al. (2011). Upward first arrivals with an apparent velocity of 7.2 km/s were clearly identified at epicentral distances of 50–180 km, while the arrival times could not be reproduced by the theoretical travel time using the one-dimensional (1D) velocity structure (Ukawa et al. 1984) of the Hi-net routine hypocenter determination (Additional file 1: Figure S3).
Since the high-velocity PHS exists at shallower depths (10–15 km) beneath the epicenters of the analyzed off-shore earthquakes, the velocity structure is completely different from the 1D velocity structure model. In the case where a high-velocity oceanic mantle exists beneath the hypocenters, the rays of the first arrivals in land-area stations should pass through the oceanic Moho of the PHS as a head wave (hereafter called “PPHS”) with a
faster apparent velocity. This might cause misestimations of the takeoff angles from a hypocenter calculated with the Hi-net 1D velocity structure. Furthermore, to fit such fast apparent velocity around land area, the hypocenter depths might be estimated to be deeper than the actual ones (Additional file 1: Figure S4).
Simulation of seismic wave propagation in the 3D heterogeneous model
The observed seismograms suggest that the PPHS gener-ated from the down-going P waves becomes first motions at land stations and is a major cause of the incorrect esti-mations of focal mechanisms and depths for first-motion solution. Our hypothesis was examined using 3D FDM simulations of seismic wave propagation for the 2016 Off Mie earthquake, in which we incorporated the 3D geom-etry of the subducting PHS. The 3D model of the FDM simulation covered a volume of 512 × 512 × 128 km3 (enclosed by red square in Fig. 1a), which was discretized with grid intervals of 0.2 and 0.1 km in the horizontal and vertical directions, respectively. Technical details of the simulation, such as FDM scheme, solid/air boundary conditions, and formulation of the anelastic attenuation are described in Takemura et al. (2015a).
The 3D velocity structure model was constructed based on the Japan Integrated Velocity Structure Model (JIVSM; Koketsu et al. 2008, 2012), which is widely used in many seis-mological analyses across the Japan Islands (e.g., inversion of
0 2 4 6 8
Time−Distance/8 [s
] −100 −50 0 50 100 150 200 250 300
Epicentral Distance [km]
7.2 km/s
8.0 km/s 8 km/s
7 km/s 6 km/s
0 2 4 6 8
Time−Distance/8 [s
] −100 −50 0 50 100 150 200 250 300
7.2 km/s
8.0 km/s 8 km/s
7 km/s 6 km/s
134˚E 135˚E 136˚E 137˚E 33˚N
34˚N 35˚N
X’
XY Y’
X-X’ profile
Y-Y’ profile
Fig. 2 Vertical velocity seismograms recorded at Hi-net stations. Theoretical travel time curve assuming a hypocenter depth of 14 km (orange
line) was calculated from the 1D velocity structure model of Ukawa et al. (1984). The amplitudes of each trace were multiplied by their epicentral
distance. Locations of the Hi-net stations are represented by filled triangles in the right subfigure. Up and down directions are left and right in trace,
source rupture process, evaluation of strong ground motion, and simulation of seismic wave propagation) (e.g., Koketsu et al. 2011; Iwaki et al. 2013; Maeda et al. 2013; Takemura et al. 2015b, c). Although the velocity model in the offshore region has relatively large uncertainties, upper surface of the PHS from JIVSM is consistent with other models (e.g., Hirose et al. 2008; Citak et al. 2012; Nakamura et al. 2015). Since we focused our attention on the first motions and their apparent velocities at land Hi-net stations, our model did not include low-velocity (VS < 2.9 km/s) sediments and seawater layers (VP = 1.5 km/s). The physical parameters of each layer are listed in Additional file 1: Table S2. Our 3D FDM was able to examine seismic wave propagation for fre-quencies less than 2 Hz under these settings.
The seismic source for the 2016 Off Mie earthquake was represented by a single-cycle Küpper wavelet function (Mavroeidis and Papageorgiou 2003) with a dominant fre-quency of 1 Hz. A double-couple point source for this event was assumed following the Hi-net first-motion and F-net MT solutions (see Event C in Additional file 1: Table S1), which were located within the oceanic crust of assumed velocity structure model. Here we note that since our simu-lation did not include small-scale velocity heterogeneity within the crust and realistic source time function, which might be required to achieve more accurate simulation for higher frequencies (≥1 Hz), we focus our attention on first-motion polarization, apparent velocity, and its transition.
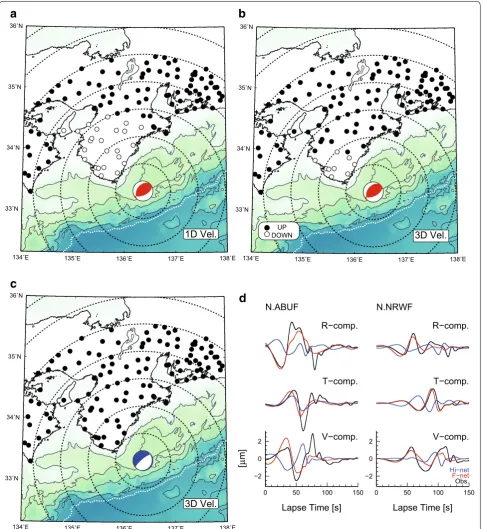
Figure 3 shows the spatial distributions of the first-motion polarizations derived from the 3D FDM simula-tions using F-net MT and Hi-net first-motion solusimula-tions. We also conducted 3D FDM simulation of F-net MT solution within the Hi-net 1D velocity structure model as a reference. In the simulation of 1D model (Fig. 3a), downward motions, which did not appear in the obser-vation of land areas, were found at epicentral distances of 50–150 km. The reproducibility of the observed polarization pattern was significantly improved by introducing a 3D model (Fig. 3b). Slight discrep-ancy around the southwest of Kii peninsula could be improved by changing more suitable velocity structure or source parameter (later discussed). Hi-net first-motion solution within the 3D model also well repro-duced observed first-motion polarizations (Fig. 3c). These results indicate that it is difficult to determine focal mechanisms of shallow offshore earthquakes by only using first-motion polarizations at land-area sta-tions. To determine focal mechanisms of shallow off-shore earthquakes, we should analyze long-period displacements, which are less sensitive to local hetero-geneities along propagation path. Comparisons of long-period displacement seismograms (Fig. 3d) at N.ABUF and N.NRWF suggest a thrust-faulting mechanism, rather than normal-faulting mechanism.
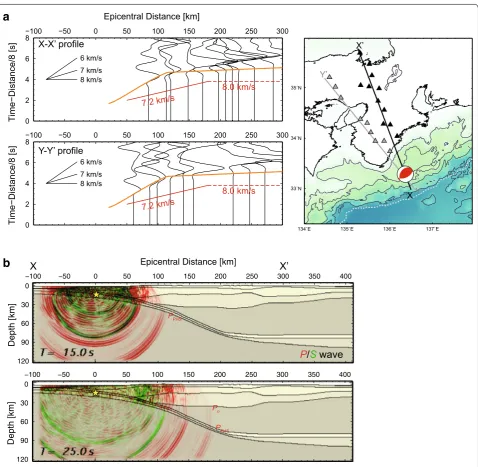
Figure 4a shows simulated waveforms of vertical com-ponent along X–X′ and Y–Y′ profiles. Although all the travel times were slightly delayed compared to the obser-vations (red lines), the PPHS and Pn phases and their tran-sition at epicentral distance of 180 km were clearly found along the X–X′ profile (top panel of Fig. 4a). These fea-tures are also illustrated in the snapshot of seismic wave-field along the X–Xʹ profile (Fig. 4b).
Discussion and conclusions
We conclude that the systematic difference between first-motion and waveform-inversion solutions for shallow offshore earthquakes is mainly caused by the subduct-ing PHS, which generates a PPHS phase with an apparent velocity of 7.2 km/s and causes the misestimations of the takeoff angles and hypocenter depths. To fit such a fast apparent velocity around land areas in the conventional one-dimensional studies, the hypocenter depth is overes-timated compared to the actual one.
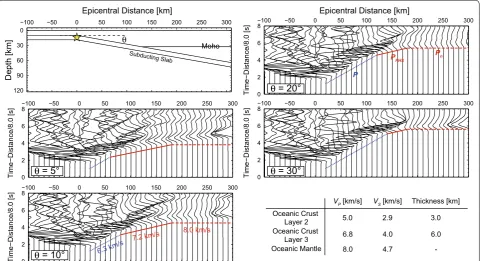
Around southwest of the Kii Peninsula (toward Y–Y′ pro-file), a discrepancy between observation and simulation was recognized at epicentral distances less than 100 km (Fig. 3b). The apparent velocity of the simulated first motions along the Y–Y′ profile correlates with the theoretical travel times from the 1D velocity structure model, rather than the observed ones (bottom of Fig. 4a). Thus, this discrepancy could be reduced by introducing more accurate velocity structure models around the offshore region or by chang-ing the source parameters such as the hypocenter depth and the fault dip angle. Geometries of the subducting slab are strongly controlled by dip angles of subduction. The effects of key parameter, the “dip angle of subducting slab,” were investigated via two-dimensional (2D) FDM simulations using a simple 2D slab model. The 2D model covered a zone of 409.6 × 128 km2, which was discretized with a uniform grid interval of 0.1 km. The geometry of the 2D subducting oceanic crust and mantle is shown in the upper left of Fig. 5
and is then embedded into the background Hi-net 1D veloc-ity structure model (Additional file 1: Figure S3). The seis-mic velocities and thicknesses of oceanic crust and mantle are shown in right bottom of Fig. 5. In order to focus on the PPHS propagation pattern, an isotropic P wave line source (explosion source; Mxx = Mzz = 1.0) was assumed within the oceanic crust of 2D model (14 km). We examine relation between PPHS propagation and dip angle of subducting slab.
distances of 60–180 km. As the dip angle θ increased, direct P waves propagating through the crust (Fig. 5, blue line) became dominant. In particular, for dip angles
greater than θ = 30°, PPHS was only observed within a nar-row distance range (140–180 km). This indicates that the effects of PPHS propagation on conventional determination
134˚E 135˚E 136˚E 137˚E 138˚E
33˚N 34˚N 35˚N 36˚N
3D Vel.
134˚E 135˚E 136˚E 137˚E 138˚E
33˚N 34˚N 35˚N 36˚N
1D Vel.
134˚E 135˚E 136˚E 137˚E 138˚E
33˚N 34˚N 35˚N 36˚N
3D Vel. UP
DOWN
−2 0 2
[
µ
m]
0 50 100 150
Lapse Time [s] V−comp. T−comp. R−comp. N.ABUF
−2 0 2
0 50 100 150
Lapse Time [s] V−comp.
Obs. F−net
Hi−net T−comp. R−comp. N.NRWF
a
b
c
d
Fig. 3 Same as Fig. 1b but for results of 3D simulations. Simulation results of F-net MT solution within a 1D velocity structure model (Ukawa et al.
1984). b 3D heterogeneous structure model of JIVSM (Koketsu et al. 2012). c Simulation result of Hi-net first-motion solution within JIVSM. d
Com-parison of low-frequency (0.005–0.02 s) displacement waveforms at N.ABUF and N.NRWF between observation and 3D simulations. Locations of
of the hypocenter location and mechanism could be neg-ligible in the following cases: (1) subduction zones with high (>20–30°) dip angles (e.g., Kuril, Izu-Bonin-Mariana and Tonga subduction zones) and (2) earthquakes occur-ring near/beneath land area.
In other subduction zones with low-angle (<20°) dipping slabs such as Cascadia, Mexican, and Peru–Chile subduc-tion zones (e.g., Hayes et al. 2012), large (M > 8) thrust
earthquakes have also repeatedly occurred at recurrence intervals of several 100 years. Seismicity and focal mecha-nisms near the slab interface are very important for con-sidering such large earthquakes. Our findings suggest the possibility of underestimation of the seismicity above the oceanic Moho in such subduction zones with low-angle dipping slabs. Furthermore, low-angle dipping slabs also have a potential to affect seismic wave propagations and 0
30
60
90
120
Depth [km]
−100 −50 0 50 100 150 200 250 300 350 400
Epicentral Distance [km]
P/S wave
PPHS
b
a
X-X’ profile
Y-Y’ profile
’ X X
0
30
60
90
120
Depth [km]
−100 −50 0 50 100 150 200 250 300 350 400
PPHS
Pn
134˚E 135˚E 136˚E 137˚E
33˚N 34˚N 35˚N
X’
XY
Y’
0 2 4 6 8
Time−Distance/8 [s
] −100 −50 0 50 100 150 200 250 300
Epicentral Distance [km]
7.2 km/s
8.0 km/s
8 km/s 7 km/s 6 km/s
0 2 4 6 8
Time−Distance/8 [s
] −100 −50 0 50 100 150 200 250 300
7.2 km/s
8.0 km/s
8 km/s 7 km/s 6 km/s
Fig. 4 Simulated waveforms and wavefield snapshots. a Simulated seismograms of vertical component along the X–X′ and Y–Y′ profiles, b
snap-shot of seismic wave propagation along the X–X′ profile derived from 3D simulation. In order to enhance the amplitudes of P waves at far stations,
the amplitudes of each trace were normalized by their maximum amplitudes for first arrival part. Simulated P and S wavefields are colored in red
and green, respectively. Head wave propagating through oceanic Moho of PHS is labeled as PPHS in (b). Red solid, red dashed, and orange lines in (a)
strong ground motions (e.g., Furumura and Singh 2002; Takemura et al. 2015b, c). In future studies, it would be important to precisely estimate the seismicity and charac-teristics of seismic wave prorogation by using the appro-priate 3D subsurface structure model in order to overcome the misestimation of the source mechanisms and the hypocenter locations around low-angle dipping slabs.
Authors’ contributions
ST conducted waveform analysis for both observation and simulation and drafted this manuscript. KS and TK participated in the study design and interpretation of the results. TS participated in the considerations for wave propagation. All authors helped drafting the manuscript. All authors read and approved the final manuscript.
Additional file
Additional file 1: Figure S1. First-motion solutions of aftershocks of the 2016 Off Mie earthquake. Focal spheres with magnitudes of 2.5–3.4 were plotted referring the Hi-net catalog (last accessed 19 April 2016). Location of the epicenter of the 2016 Off Mie earthquake is given by the yellow star. Figure S2. Same as Fig. 1b but for four additional earthquakes (Events A, B, D and E of Table S1). Figure S3. 1D velocity structure model by Ukawa et al. [1984]. Red and green lines are depth variations of P- and
S-wave velocities, respectively. Figure S4. Theoretical travel using 1D velocity structure model by Ukawa et al. [1984]. Table S1. Parameters of earthquake used in this study. фS, δ and λ are strike, dip, and rake angles
of focal mechanism, respectively. Table S2. Physical parameters for each layer. P- and S-wave velocities (VP, VS), densities (ρ), and anelastic
attenua-tion (QP, QS) of the JIVSM [Koketsu et al. 2012].
Acknowledgements
The Hi-net waveform data, Hi-net hypocenter catalog, and F-net MT solu-tions were provided by the National Research Institute for Earth Science and Disaster Resilience, Japan (NIED), via the Institute website. We also used the unified hypocenter catalogs provided by the Japan Meteorological Agency (last accessed April 28, 2016). Bathymetric depth data were obtained from ETOPO1 (Amante and Eakins 2009). The software for sensor response correc-tion by Maeda et al. (2011) is available via Dr. T. Maeda’s website (http://www. eri.u-tokyo.ac.jp/people/maeda/w/doku.php/codes/hinet_decon). Large-scale FDM simulations were conducted on the supercomputer system at NIED and the Earth Simulator on Japan Agency for Marine-Earth Science and Technol-ogy. Generic Mapping Tools (Wessel and Smith 1998) were used to prepare the figures. The JIVSM is available via the website (http://www.jishin.go.jp/ main/chousa/12_choshuki/dat/). Depth data of upper surface of the Philip-pine Sea plate are available via Dr. F. Hirose’s website (http://www.mri-jma. go.jp/Dep/st/member/fhirose/ja/PlateData.html).
Competing interests
The authors declare that they have no competing interests.
Received: 2 June 2016 Accepted: 20 August 2016
References
Amante C, Eakins BW (2009) ETOPO1 arc-minute global relief model: procedure, data sources and analysis: NOAA technical memorandum NESDIS NGDC-24, National Geophysical Data Center, NOAA. doi:10.7289/ V5C8276M
Ando M (1975) Source mechanisms and tectonic significance of historical earthquakes along the Nankai Trough. Jpn Tectonophys 27(2):119–140 Baba T, Tanioka Y, Cummins PR, Uhira K (2002) The slip distribution of the
1946 Nankai earthquake estimated from tsunami inversion using a
0
Fig. 5 Simulated waveforms derived from 2D simulations with varying dip angles θ of the subducting slab. Schematic figure of the model used is
shown in upper left corner. Blue, red solid, and dashed lines represent direct P, PPHS, and Pn phases, respectively. Physical parameters of the assumed
new plate model. Phys Earth Planet Int 132(1):59–73. doi:10.1016/ S0031-9201(02)00044-4
Citak SO, Nakamura T, Nakanishi A, Yamamoto Y, Ohori M, Baba T, Kaneda Y (2012) An updated model of three-dimensional seismic structure in the source are of the Tokai–Tonankai–Nankai earthquake, in Abstract of AOGS
-AGU (WPGM) Joint Assembly, Singapore, 12–17 August 2012, Abstract No. OS-6-A015
Fukuyama E, Ishida M, Dreger DS, Kawai H (1998) Automated seismic moment tensor determination by using on-line broadband seismic waveforms. Zisin 51:149–156 (in Japanese with English abstract)
Furumura T, Singh SK (2002) Regional wave propagation from Mexican subduction zone earthquakes: the attenuation functions for inter-plate and inslab events. Bull Seismol Soc Am 92(6):2110–2125. doi:10.1785/0120010278
Hashimoto C, Fukui K, Matsu’ura M (2004) 3-D modeling of plate inter-faces and numerical simulation of long-term crustal deformation in and around Japan. Pure Appl Geophys 161:2053–2068. doi:10.1007/ s00024-004-2548-8
Hayes GP, Wald J, Johnson RL (2012) Slab 1.0: a three-dimensional model of global subduction zone geometries. J Geophys Res 117:B01302. doi:10.1 029/2011JB008524
Heki K, Miyazaki S (2001) Plate convergence and long-term crustal deforma-tion in central Japan. Geophys Res Lett 28:2313–2316. doi:10.1029/200 0GL012537
Hirose F, Nakajima J, Hasegawa A (2008) Three-dimensional seismic velocity structure and configuration of the Philippine Sea slab in southwestern Japan estimated by double-difference tomography. J Geophys Res 133:B09315. doi:10.1029/2007JB005274
Hok S, Fukuyama E, Hashimoto C (2011) Dynamic rupture scenarios of antici-pated Nankai–Tonankai earthquakes, southwest Japan. J Geophys Res 116:B12319. doi:10.1029/2011JB008492
Hori S (2002) Comparison of earthquake mechanism solutions obtained from first motion analysis with those with waveform analysis. Zisin 55:275–284
(in Japanese with English abstract)
Hori T, Kato N, Hirahara K, Baba T, Kaneda Y (2004) A numerical simulation of earthquake cycles along the Nankai Trough in southwest Japan: lateral variation in frictional property due to the slab geometry controls the nucleation position. Earth Planet Sci Lett 228:215–226. doi:10.1016/j. epsl.2004.09.033
Iwaki A, Morikawa N, Maeda T, Aoi S, Fujiwara H (2013) Finite-difference simu-lation of long-period ground motion for the Sagami Trough megathrust earthquakes. J Disaster Res 8(5):926–940
Kato A, Sakai S, Obara K (2011) A normal-faulting seismic sequence triggered by the 2011 off the Pacific coast of Tohoku earthquake: wholescale stress regime changes in the upper plate. Earth Planets Space 63(7):745–748. doi:10.5047/eps.2011.06.014
Kim SB, Saito T, Fukuyama E, Kang TS (2016) The Nankai trough earthquake tsunamis in Korea: numerical studies of the 1707 Hoei earthquake and physical-based scenarios. Earth Planets Space 68:64. doi:10.1186/ s40623-016-0438-9
Kita S, Matsubara M (2016) Seismic attenuation structure associated with episodic tremor and slip zone beneath Shikoku and the Kii peninsula, southwestern Japan, in the Nankai subduction zone. J Geophys Res 121:1962–1982. doi:10.1002/2015JB012493
Koketsu K, Miyake H, Fujiwara H, Hashimoto T (2008) Progress towards a Japan integrated velocity structure model and long-period ground motion hazard map. In: Proceedings of the 14th world conference on earthquake engineering, Beijing, China, October 12–17
Koketsu K, Yokota Y, Nishimura N, Yagi Y, Miyazaki S, Satake K, Fujii Y, Miyake H, Sakai S, Yamanaka Y, Okada T (2011) A unified source model for the 2011 Tohoku earthquake. Earth Planet Sci Lett 310(3):480–487. doi:10.1016/j. epsl.2011.09.009
Koketsu K, Miyake H, Suzuki H (2012) Japan integrated velocity structure model version 1. In: Proceedings of the 15th world conference on earth-quake engineering, Lisbon, Portugal, September 24–28
Maeda T, Obara K, Furumura T, Saito T (2011) Interference of long-period seismic wavefield observed by the dense Hi-net array in Japan. J Geophys Res 116:B10303. doi:10.1029/JB008464
Maeda T, Furumura T, Noguchi S, Takemura S, Sakai S, Shinohara M, Iwai K, Lee SJ (2013) Seismic- and tsunami-wave propagation of the 2011 off the
Pacific coast of Tohoku earthquake as inferred from the tsunami-coupled finite-difference simulation. Bull Seismol Soc Am 103(2B):1456–1472. doi:10.1785/0120120118
Matsuzawa T, Shibazaki B, Obara K, Hirose H (2013) Comprehensive model of short- and long-term slow slip events in the Shikoku region of Japan, incorporating a realistic plate configuration. Geophys Res Lett 40:5125–5130. doi:10.1002/grl.51006
Mavroeidis GP, Papageorgiou AS (2003) A mathematical representation of near-field ground motions. Bull Seismol Soc Am 93(3):1099–1131. doi:10.1785/0120020100
Nakamura T, Takenaka H, Okamoto T, Ohori M, Tsuboi S (2015) Long-period ocean-bottom motions in the source areas of large subduction earth-quakes. Sci Rep 5:16648. doi:10.1038/srep16648
Obara K (2002) Nonvolcanic deep tremor associated with subduction in south-west Japan. Science 296:1679–1681. doi:10.1126/science.1070378
Okada Y, Kasahara K, Hori S, Obara K, Sekiguchi S, Fujiwara H, Yamamoto A (2004) Recent progress of seismic observation networks in Japan-Hi-net, F-net, K-NET and KiK-net. Earth Planets Space 56(8):15–28. doi:10.1186/ BF03353076
Ozawa S, Murakami M, Kaidzu M, Tada T, Sagiya T, Hatanaka Y, Yarai H, Nishimura T (2002) Detection and monitoring of ongoing aseismic slip in Tokai region, central Japan. Science 298(5595):1009–1012. doi:10.1126/ science.107680
Seno T, Stein S, Gripp AE (1993) A model for the motion of the Philippine Sea plate consistent with NUVEL-1 and geophysical data. J Geophys Res 98:17941–17948. doi:10.1029/93JB00782
Shelly DR, Beroza GC, Ide S (2007) Non-volcanic tremor and low-frequency earthquake swarms. Nature 446(7133):305–307. doi:10.1038/nature05666
Shiomi K, Obara K, Sato H (2006) Moho depth variation beneath southwestern Japan revealed from the velocity structure based on receiver function inversion. Tectonophysics 420:205–221. doi:10.1016/j.tecto.2006.01.017
Shiomi K, Matsubara M, Ito Y, Obara K (2008) Simple relationship between seismic activity along Philippine Sea slab and geometry of oceanic Moho beneath southwest Japan. Geophys J Int 173:1018–1029. doi:10.1111/j.1365-246X.2008.03786.x
Storchak DA, Giacomo DD, Bondár I, Engdahl ER, Harris J, Lee WHK, Vil-laseñor A, Bormann P (2013) Public release of the ISC–GEM Global instrumental earthquake catalogue. Seismol Res Lett 84:810–815. doi:10.1785/02200130034
Takagi R, Obara K, Maeda T (2016) Slow slip event within a gap between tremor and locked zoned in the Nankai subduction zone. Geophys Res Lett. doi:10.1002/2015GL066987
Takemura S, Furumura T, Maeda T (2015a) Scattering of high-frequency seismic waves caused by irregular surface topography and small-scale velocity inhomogeneity. Geophys J Int 201(1):459–474. doi:10.1093/gji/ggv038
Takemura S, Yoshimoto K, Tonegawa T (2015b) Velocity increase in the upper-most oceanic crust of the Philippine Sea plate beneath the Kanto region due to dehydration inferred from high-frequency trapped P waves. Earth Planets Space 67:41. doi:10.1186/s40623-015-0210-6
Takemura S, Yoshimoto K, Tonegawa T (2015c) Scattering of trapped P and
S waves in the hydrated subducting crust of the Philippine Sea plate at shallow depths beneath the Kanto region, Japan. Geophys J Int 203(3):2261–2276. doi:10.1093/gji/ggv423
Thurber C, Zhang H, Waldhauser F, Hardbeck J, Michael A, Eberhart-Phillips D (2006) Three-dimensional compressional wavespeed model, earthquake relocations, and focal mechanisms for the Parkfield, California, region. Bull Seismol Soc Am 96(4B):538–549. doi:10.1785/0120050825
Ukawa M, Ishida M, Matsumura S, Kasahara K (1984) Hypocenter determina-tion method of the Kanto-Tokai observadetermina-tional network for microearth-quakes. Res Notes Natl Res Cent Disaster Prev 53:1–88 (in Japanese with English abstract)
Wessel P, Smith WHF (1998) New, improved version of generic map-ping tools released. EOS Trans Am Geophys Union 79(47):579. doi:10.1029/98EO00426