Micro, Incorporated. All other product or company names may be trademarks or registered trademarks of their owners.
Copyright© 2006–2008 Trend Micro Incorporated. All rights reserved.
Table of Contents
Table of Contents
...
iii
Introducing the Case Diagnostic Tool ... 1
Case Diagnostic Tool Capabilities ... 1
Case Diagnostic Tool 2.5 New Features
...
2
Using the Case Diagnostic Tool ... 3
Files Included with the Case Diagnostic Tool ... 3
Case Diagnostic Tool User Work Flow ... 3
Extracting the Case Diagnostic Tool ... 4
Running the Case Diagnostic Tool ... 4
Accepting the License Agreement ... 4
Detecting Trend Micro Products ... 5
Selecting Product Problems ... 5
Reproducing the Problems ... 6
Generating Data for Diagnosis ... 10
Sending Diagnostic Data to Trend Micro Support
...
12
Advanced Configuration ... 13
About CaseDiagnosticTool.ini ... 13
Sample Content of CaseDiagnosticTool.ini: ... 14
Diagnostic Data Package Contents and Structure ... 16
Contents and Structure of the Product Folder ... 17
Contents and Structure of the CollectedFile Folder ... 18
Contents and Structure of the System_Info Folder ... 19
Introducing the Case Diagnostic Tool
The Trend Micro Case Diagnostic Tool (CDT) is a facilitating tool which helps the Trend Micro Service Engineering Group, Core Team, Technical Support Team, and customers diagnose problems in Trend Micro products. It aims to shorten the diagnostic
communication process between Trend Micro and its customers.
CDT collects all necessary debugging information from a customer’s product whenever problems occur. It automatically turns the product’s debug status on and off and collects necessary files according to problem categories.
Case Diagnostic Tool Capabilities
• CDT lets users provide detailed problem descriptions • CDT supports multiple product diagnostics
• CDT collects relevant system information from the customer’s computer/system • CDT turns product and specific module debug status on and off according to problem
category
• CDT monitors specific process status information, such as CPU load and memory usage • CDT retrieves problem-related files and compresses them into a password-protected ZIP
file (password is “trend”)
• CDT supports the following Windows platforms:
o Windows 98 Second Edition
o Windows 2000 Professional/Server Edition
o Windows XP Professional Edition
Case Diagnostic Tool 2.5 New Features
• Problem categorization as “checklists”• Web server version detection and log collection support (for Microsoft IIS and Apache) • Available disk volume checking for diagnosis completion
• Windows system, security, and application events output collection • Windows MMC services content collection
• Windows WINMSD categories output collection • CDT execution time calculation
• Enhanced problem description dialog • New User Interface (UI) flow
• Restructured data output and content collection
Using the Case Diagnostic Tool
Files Included with the Case Diagnostic Tool
CaseDiagnosticTool.exe CaseDiagnosticTool.dll CaseDiagnosticTool.ini ExInterface_Common.dll PSAPI.DLL Readme.txt Licenses\*.txt ExInterface\*.ini ExInterface\*.dll Tools\*.* win95\*.*
Case Diagnostic Tool User Work Flow
Extract CDT
Select Product & Problems
Enable CDT Debug Mode
Reproduce Problems
Disable CDT Debug Mode
Select Data file Location
Extracting the Case Diagnostic Tool
After getting the Case Diagnostic Tool ZIP file, extract the contents using the “extract to CDT 2.5” option so that all the sub-folders are extracted correctly. The executable file
“CaseDiagnosticTool.exe” is located under the “\CDT2.5\” folder.
Running the Case Diagnostic Tool
Accepting the License Agreement
To run CDT, navigate to the “\CDT2.5\release” folder. Locate “CaseDiagnosticTool.exe” and double-click it. The CDT welcome screen appears. After reviewing the product introduction and accepting the license agreement, click Start to go to the Select Product Problems screen.
Detecting Trend Micro Products
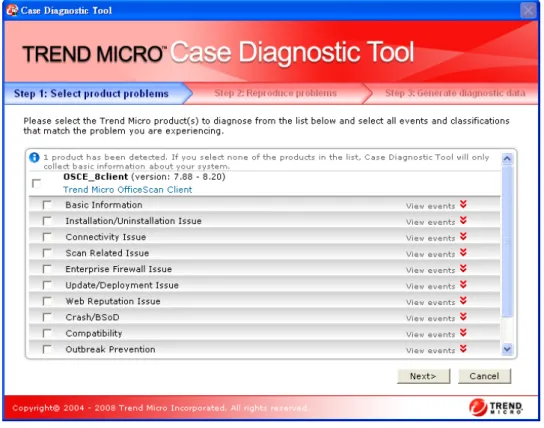
Initially, the Select Product Problems screen displays the Trend Micro product detection progress bar. During this phase, CDT checks for and loads the interface DLL files of all Trend Micro products installed on the system. When checking is complete, a list of Trend Micro products and their associated problem categorization will be displayed (Figure 2).
Selecting Product Problems
The Select Product Problems screen (Figure 2) displays the products installed along with their respective problem categories. Choose one or more products to diagnose, and then select one or more problem categories as you see fit.
Note - To collect only system information, leave all checkboxes unchecked.
Figure 2: Select Product Problems screen
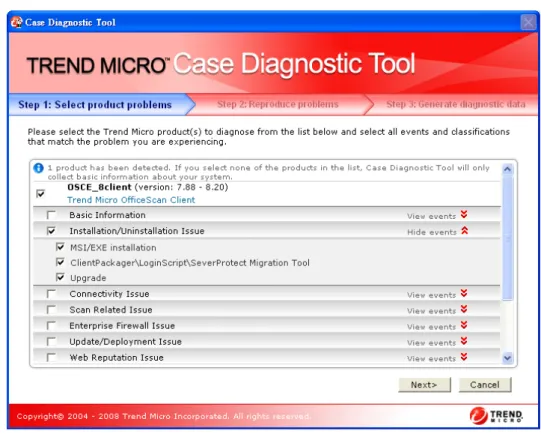
Each problem category is composed of several problem “events”. By selecting a category, all events related to it are also selected. You can click View Events to see what events are in the
category, and you can uncheck some of them if you do not wish to collect their information (Error: Reference source not found).
Figure 3: Select Product Problems Screen – Selecting events
Click Next to go to the Reproduce Problems screen (Figure 4), or click Cancel to exit CDT.
Note - If no product was selected in the Select Product Problems screen, CDT will skip the Reproduce Problems screen and display the Generate Diagnostic Data screen.
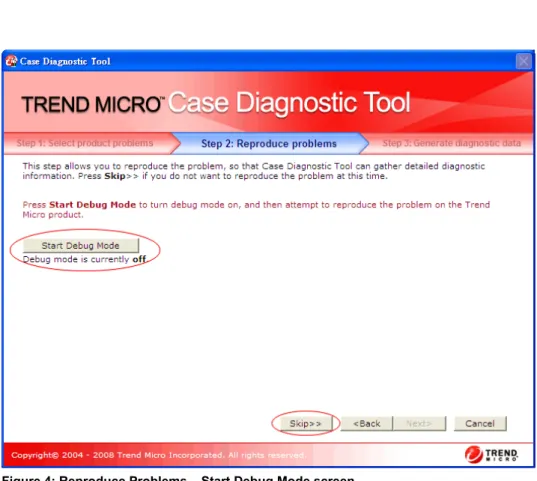
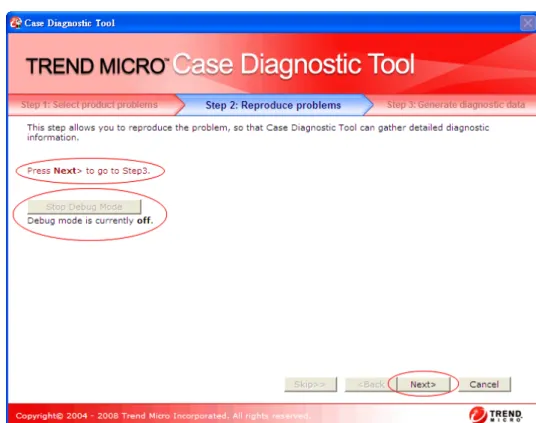
Reproducing the Problems
On the Reproduce Problems screen (Figure 4), click Start Debug Mode. It may take a few moments for CDT to start the product and module debug mode and set the corresponding debug levels. During this time, CDT displays the message “Debug mode is changing…”
Note - If no product was selected in the Select products and events screen, the Reproduce Problems screen will not appear.
Figure 4: Reproduce Problems – Start Debug Mode screen
Note – Click Skip to go to the Generate Diagnostic Data screen (Figure 7) if you do not want to reproduce the problem at this time or if you have already turned the debug mode on, reproduced the problem, and turned the debug mode off.
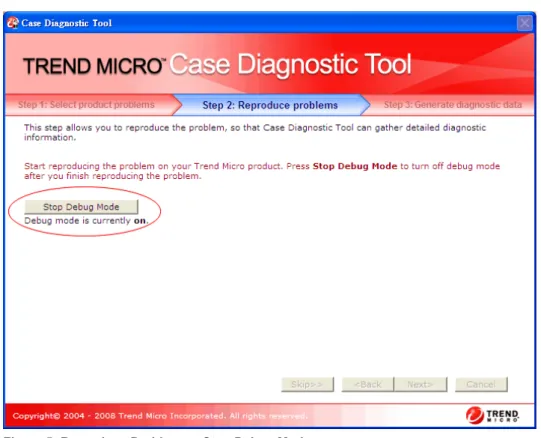
When CDT displays the message “Debug mode is currently on”, change to the product console or dialog and try to reproduce the error. After reproducing the problem, click Stop Debug Mode (Figure 5). This restores the product and module’s original debug settings (Figure 6) and allows you to proceed to the next step.
From the Reproduce problems screen, click Next to move to the Generate Diagnostic Data screen (Figure 7).
Generating Data for Diagnosis
From Generate Diagnostic Data screen (Figure 7), select a folder (either a local folder or a shared folder) where the diagnostic data will be saved. CDT will automatically create a subfolder named CDT_Data inside this selected folder.
Note - Verify that you have sufficient access rights to the selected folder so that CDT can create the subfolder and save the data files there.
Figure 7: Generate Diagnostic Data screen
Next, select one of the three log collection options.
Note - If you select the “Logs for the following dates” option and the product’s log files do not follow the Common Log Module (CLM) naming convention, CDT will ignore the dates specified and collect all logs.
Finally, type a description of the problem in the text area at the bottom of the screen (Figure 7). This is a required field. Click Next to have CDT begin generating the diagnostic data. When CDT has finished generating the data, it will compress and save the file in the location specified, and display the “Diagnosis completed” message on the Generate diagnostic data screen (Figure 8). The text field displays the path name of the compressed diagnostic data file (ZIP format). Click Open Folder to open the folder where the ZIP file is located, or click
Finish to exit CDT.
Sending Diagnostic Data to Trend Micro Support
Trend Micro has sales and corporate offices in many cities around the globe. For global contact information, visit the Trend Micro Worldwide site:
http://www.trendmicro.com/en/about/contact/overview.htm
Note - The information on this Web site is subject to change without notice
To contact Trend Micro Technical Support, visit the following URL: http://esupport.trendmicro.com
Advanced Configuration
About CaseDiagnosticTool.ini
CaseDiagnosticTool.ini is the configuration file used by CDT. It is located in the same folder as the CDT executable file CaseDiagnosticTool.exe.
The following items can be changed from the CaseDiagnosticTool.ini file: CDT debug log level—During execution, CDT writes debug information in CaseDiagnosticTool.log, the detail of which depends on the level set in
CaseDiagnosticTool.ini. Change the debug log level by setting the key “CDT_DebugLevel” under the [Setting] section. The said debug log level ranges from 0 to 4, with 4 providing the most detailed information.
CDT Silent Mode—If the key “SilentMode” under the [Setting] section is set to 1, CDT will run in silent mode (that is, the UI will not appear). The default value of this key is 0. In silent mode, CDT collects diagnostic data based on the settings in the succeeding sections of CaseDiagnosticTool.ini.
Minimum disk space requirement—CDT 2.5 added two keys in CaseDiagnosticTool.ini, “CDT_RequiredDiskSpace” and “ProductRequiredDiskSpace”, to verify if there is enough disk space to complete a CDT diagnostics test. CDT_RequiredDiskSpace checks if the space in the folder where CDT will be running is sufficient, while ProductRequiredDiskSpace checks if the space in the folder where the product is installed is sufficient.
Refer to the following sample text from the CaseDiagnosticTool.ini for the usage of these Silent Mode sections:
[ExInterface] [EventList] [BasicInfo] [ProcessCheckList] [LogFilter]
Sample Content of CaseDiagnosticTool.ini:
[Setting];Define whether running in silent mode. SilentMode=0
;Define the default path to store necessary log files when running in silent mode.
SilentFolder=C:\CDT_Data CDT_DebugLevel=4
;Define whether to turn on/off the debug mode of the product(s) or not
RunDebugMode=0;
;Define the time period in minutes to reproduce the problem in silent mode, 0 means no time limit
SilentDebugTime=0
;Define the minimum disk space requirement, the unit is in megabytes
CDT_RequiredDiskSpace=100 ProductRequiredDiskSpace=100 [ProcessCheckList]
; CheckInterval can be 2 to 60 seconds CheckInterval=2
;Please change those ProcessX pair to specific process name according to your request.
;Process1=explorer.exe ;Process2=taskmgr.exe
[BasicInfo]
;Please write description about the problem between them <Problem_Desc_Begin>
<Problem_Desc_End>
;ExInterface plug-ins will be selected in silent mode. [ExInterface]
;DebugLevel can be 0 to 9, detail increases with value increases. DebugLevel=5
;Please change the ExInterfaceX pair to specific plug-ins according to your request.
ExInterface1=OSCE_client ExInterface2=OSCE_server
;Event related to ExInterface plug-ins will be selected in silent mode.
[EventList]
;ExInterfaceX in [EventList] is event list related to plug-in of ExInterfaceX in section [ExInterface]
ExInterface1=1,3 ExInterface2=1 [LogFilter]
;if LogFileRange is 1, LogFile_JustToday, LogFile_Begin and LogFile_End will be use, otherwise they will be ignored. LogFileRange=0
;if LogFile_JustToday is 1, LogFile_Begin and LogFile_End will be ignored.
LogFile_JustToday=1
;LogFile_Begin and LogFile_End, their format must be YYYYMMDD LogFile_Begin=20041130
Diagnostic Data Package Contents and Structure
Once Case Diagnostic Tool (CDT) has finished collecting system information and retrieving log files, all of its collected diagnostic data files are compressed into a ZIP file and a
timestamp is used for the file name. The timestamp name follows the YYYYMMDD-hhmmss format. The ZIP file is then saved in the folder previously specified in the Generate diagnostic data screen.
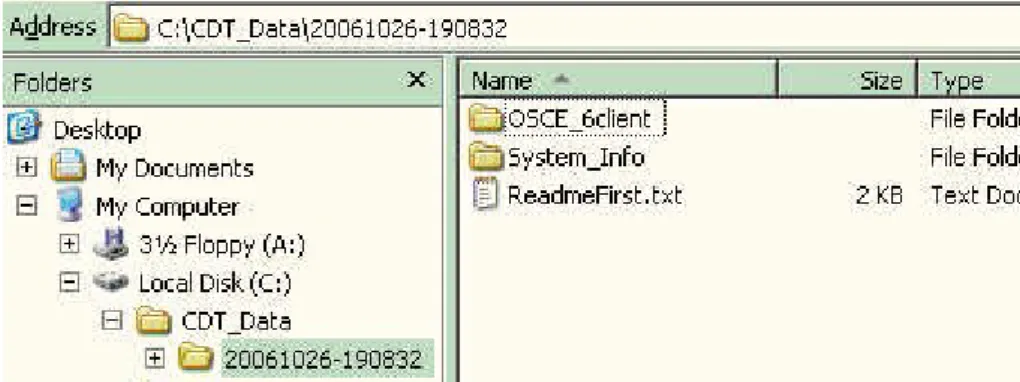
Figure 9: Contents of CDT generated diagnostics file
The timestamp folder contains the following files (Table 1). The product files will vary depending on the Trend Micro products installed:
Table 1: Timestamp folder contents
File Name Description
ReadmeFirst.txt A text file containing a summary report of current diagnostic process and result
System_Info The system information report folder Example of a Product
Name: OSCE_client
The folder of the specific product diagnosed. If CDT diagnoses several products, there would be other specific folders (for example, IMSS_5, SMEX_7)
Contents and Structure of the Product Folder
The product folder(s) contains a basic information file (ProductInfo.txt) and a CollectedFile folder containing event log files, and configuration files of the diagnosed product (Figure 10).
Figure 10: Contents of the product folder
For example, in the folder OSCE_6client, the following files are present: Table 2: Product folder contents
File Name Description
ProductInfo.txt A text file containing basic information and selected problem categories and events of the specified product
CollectedFile A folder containing all collected product events, structure lists, and configuration files
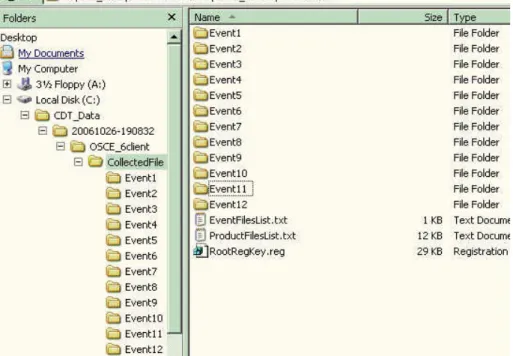
Contents and Structure of the CollectedFile Folder
Inside the CollectedFile folder are three files and a number of Event folders (Figure 11). The EventFilesList.txt stores the retrieved log list; the ProductFilesList.txt stores the product home directory structure; and the RootRegKey.reg stores the designated registry dump files. These retrieved files are separated by EventID and saved in a specific event folder, such as Event1, Event2, and so on.
Under each event folder, a file named __FILELIST__.LOG contains the association list between the original file name and the saved file name.
Contents and Structure of the System_Info Folder
The System_Info folder contains files relating to system output (Figure 12).
Figure 12: Contents of System_Info folder
The System_Info folder contains the following files: Table 3: System_Info folder contents
File Name Description
CaseDiagnosticTool.ini Case Diagnostic Tool configuration file CaseDiagnosticTool.log Case Diagnostic Tool debug log file Application.evt Windows Application event log output Security.evt Windows Security event log output Application.evt Windows System event log output msinfo.nfo Windows Winmsd categories output SystemInfo_InstalledProgram.txt System installed program and security
patch(es) output
SystemInfo_NetworkStatus.txt System network status and active TCP/IP connection output
SystemInfo_RunningProcess.txt System running processes output
SystemInfo_Summary.txt System summary output, including operating system version, computer name, hardware information, Web server, etc.
All the subfolders and files inside the timestamp folder are compressed in a ZIP file and saved inside the CDT_Data folder (Figure 13). The name of the said ZIP file follows the format CDT-<TIMESTAMP>.zip (for example, CDT-20061026-190832.zip).