3-27-2017
A farm-level precision land management
framework based on integer programming
Qi Li
Iowa State University, [email protected]
Guiping Hu
Iowa State University, [email protected]
Talukder Jubery
Iowa State University, [email protected]
Baskar Ganapathysubramanian
Iowa State University, [email protected]Follow this and additional works at:
http://lib.dr.iastate.edu/me_pubs
Part of the
Agricultural Science Commons
,
Applied Mechanics Commons
, and the
Plant
Breeding and Genetics Commons
The complete bibliographic information for this item can be found at
http://lib.dr.iastate.edu/
me_pubs/206
. For information on how to cite this item, please visit
http://lib.dr.iastate.edu/
howtocite.html
.
This Article is brought to you for free and open access by the Mechanical Engineering at Iowa State University Digital Repository. It has been accepted for inclusion in Mechanical Engineering Publications by an authorized administrator of Iowa State University Digital Repository. For more information, please [email protected].
A farm-level precision land management
framework based on integer programming
Qi Li1, Guiping Hu1
*, Talukder Zaki Jubery2, Baskar Ganapathysubramanian2
1 Department of Industrial and Manufacturing Systems Engineering, Iowa State University, Ames, Iowa,
United States of America, 2 Department of Mechanical Engineering, Iowa State University, Ames, Iowa, United States of America
Abstract
Farmland management involves several planning and decision making tasks including seed selection and irrigation management. A farm-level precision farmland management model based on mixed integer linear programming is proposed in this study. Optimal decisions are designed for pre-season planning of crops and irrigation water allocation. The model cap-tures the effect of size and shape of decision scale as well as special irrigation patterns. The authors illustrate the model with a case study on a farm in the state of California in the U.S. and show the model can capture the impact of precision farm management on profitability. The results show that threefold increase of annual net profit for farmers could be achieved by carefully choosing irrigation and seed selection. Although farmers could increase profits by applying precision management to seed or irrigation alone, profit increase is more signifi-cant if farmers apply precision management on seed and irrigation simultaneously. The pro-posed model can also serve as a risk analysis tool for farmers facing seasonal irrigation water limits as well as a quantitative tool to explore the impact of precision agriculture.
1. Introduction
Farmland management under climate change and population growth is a pressing challenge that is becoming increasingly important due to food security considerations. The Institute for Operations Research and the Management Sciences (INFORMS), the leading professional association in analytics and operations research along with industrial interests, encouraged researchers to address the problem of feeding millions of people throughout the world who face hunger every day. There has been a growing body of literature on crop rotations at a regional scale [1,2], land use patterns, and policy and environment issues on a farm scale [3]. Precision agriculture has attracted increasing attention in the community of farmland man-agement. Over the years, the precision agriculture philosophy has enriched from simply "farm-ing by soil" to a comprehensive system includ"farm-ing irrigation plann"farm-ing, phenotypic selection, vehicle guidance systems, product quality and environmental management etc. [4–6]. As the demand for agricultural products increases, water and arable land become significant factors to improved agricultural production. Each year, farmers have to make decisions about what
a1111111111 a1111111111 a1111111111 a1111111111 a1111111111 OPEN ACCESS Citation: Li Q, Hu G, Jubery TZ, Ganapathysubramanian B (2017) A farm-level precision land management framework based on integer programming. PLoS ONE 12(3): e0174680.
https://doi.org/10.1371/journal.pone.0174680 Editor: Juan J Loor, University of Illinois, UNITED
STATES
Received: September 22, 2016 Accepted: March 12, 2017 Published: March 27, 2017
Copyright:©2017 Li et al. This is an open access article distributed under the terms of theCreative Commons Attribution License, which permits unrestricted use, distribution, and reproduction in any medium, provided the original author and source are credited.
Data Availability Statement: All relevant data are
within the paper.
Funding: The authors received no specific funding
for this work.
Competing interests: The authors have declared
crops to plant given knowledge about the soil on their respective farms. Farmers need to select seed and plan for irrigation carefully to ensure maximum benefit from farming. Thus, crop planning and irrigation water management on a farm scale are imperative for improved agri-cultural productivity and sustainable development [7].
At the farm scale, farmers have a particularly strong incentive to optimize their water usage when the irrigation water price is high and the volume of available water is limited [8]. How-ever, optimal usage of irrigation water resources requires efficient techniques and decision making support. There are mainly two approaches for this. On one hand, seed hybride selec-tion is one method to improve water utilizaselec-tion. With the development of phenotype predic-tion and genotype selecpredic-tion, it is possible to utilize the high yield and drought resistant crop seeds. These new seed types give a farmer more flexibility to plant a variety of seeds on a farm, but also increase the difficulty for optimal pre-season seed planning. Alternatively, it is sug-gested that deficit irrigation is a more efficient method for water usage [9]. Deficit irrigation refers to the method that distributes a limited amount of irrigation water to satisfy essential water needs of plants [10]. Deficit irrigation could increase system benefits by saving water recourses, at the cost of individual benefits, by decreasing crop water allocation, especially dur-ing less critical periods of water demand. There are two major methods to implementdur-ing defi-cit irrigation for farmland. The first is to increase the interval between irrigation events. In other words, continue to irrigate with the same amount of water per irrigation as in the past but decrease the irrigation frequency (increase the number of days between irrigations). The second method of deficit irrigation is to irrigate at the same frequency as normal, but apply less water at each irrigation so that only a partial saturation level is achieved [11].
Mathematical programming has been widely used in farmland management, especially in irrigation management. Singh reviewed the literature in modeling, planning, and optimization of irrigation management with a focus on applications of different modeling techniques [12]. Sethi et al. developed a linear programming optimization model to find maximum annual net return for cropping and groundwater management [7]. The model was applied to a coastal river basin in India under different soil types, cropping patterns, and types of crops. Georgiou and Papamichail used simulated annealing and a gradient descent algorithm for reservoir and crop planning optimization [10]. Their method accounted for variable reservoir inflows and climate variability for crop planning. Wardlaw and Bhaktikul applied a genetic algorithm to optimize the delivery of water flows to minimize the distribution losses of an open race irriga-tion distribuirriga-tion system [13]. The major constraints in this study related to in-field soil mois-ture balances as well as canal capacities. Nagesh Kumar et al. used genetic algorithms for real-time reservoir operation management of multiple crops [14]. The study aimed to maximize the total yields from all crops considering reservoir inflow, the heterogeneous nature of soils, and crop response to the level of irrigation. Brown et al. used simulated annealing for on-farm irrigation scheduling considering seasonal water limits [8]. The objective was to maximize farm profit and was evaluated with a time-series simulation based on realistic plant growth models. Smout and Gorantiwar presented a water allocation linear programming model for optimizing the use of irrigation water to a medium irrigation scheme in India [15]. The model captured the deficit irrigation for each crop-soil-region combination. Yamout and El-Fadel developed a linear programming for setting policies for optimal water resources allocation on a regional scale [16]. Based on their study, the factors that greatly affect the water allocation scheme include profitability, public acceptability, and the effect of resources depletion.
It should be noted that most of existing studies focus on large scale management, such as, optimal irrigation and crop management on regional scale, and optimal scheduling for irriga-tion reservoir system. However, optimal on-farm level planning and irrigairriga-tion scheduling remain a challenge from the research and practical perspectives [4]. For the studies focused
on-farm level management, the granularity is typically a whole farm level, such as irrigation scheduling and crop rotation for the entire piece of land. Additional investigations are neces-sary to study the effect of the precision levels for on-farm management. In summary, majority of the literature focus on maximizing economic benefit, while maximizing yield and water use effectiveness were also adopted in several studies. Crop selection and irrigation management are among the main decisions to be made. Realistic constraints such as seasonal water limits, the heterogeneous nature of soils, and crop response to the level of irrigation applied are often considered. In this study, the proposed model aims at maximizing economic benefit by apply-ing optimal decisions on crop selection and irrigation management. Seasonal water limits, soils features are considered. In addition, spatial structure and management scales are also considered in the proposed model to achieve a farm-level precision land management.
Corn, which is widely used for grain processing, food, beverages, livestock feed, and etha-nol, takes up to one-third of cropland in the U.S. and is the nation’s biggest crop economically. Corn receives the most irrigation water overall of American crops: approximately 19 billion cubic meters annually [17]. Eighty-seven percent of irrigated corn in the U.S. is grown in high or extremely high water stress regions such as the Great Plains and the Central Valley in Cali-fornia, and over half of it depends on groundwater from the over-exploited High Plains aqui-fer. Extreme weather events due to climate change affect the corn industry significantly. For instance, irrigation water costs have soared to $0.89/cubic meter in 2015 from approximately $0.11/cubic meter in 2014 in the Fresno-based Westlands Water District due to severe drought in California. The devastating Midwest drought of 2012 drove corn prices to a record of $315/ metric ton. These facts provided motivations for this study.
Motivated by the gap between theoretical decision making challenges and the pressing application need in reality, the objective of this study is to develop a mixed integer linear pro-gramming model to provide decision support for customized precision farmland manage-ment. In the proposed model, decisions for pre-season seed selection and irrigation scheduling are made based on management properties such as types of soil, spatial structure, and manage-ment scales under a series of realistic constraints. Careful consideration was given to the model framework so that it could easily account for weather stochasticity in the future.
The remainder of the paper is organized as follows: in Section 2, the problem statement for the farm-level precision land management model is presented. The basic mixed integer linear programming model is introduced in Section 3. The authors illustrate the method with a case study in California and discuss the extension and modification of the basic model in Section 4. Finally, the paper concludes with a summary of research findings and potential research direc-tions in Section 5.
2. Problem statement
Farmland management involves a sequence of planning and decision-making processes, the primary decision includes the scales and options of management. This paper focuses on solv-ing two problems for farm-level precision land management. The first problem is to select the optimal crop management options within a customized management scale. The management options include seed type selection and irrigation frequency. The second problem is to choose the suitable management scale (size and shape) for these options. In other words, the model aims to assist the farmers to find the balance between precision level and management effort.
The "land unit" is defined as the minimum size over which management options are applied. The shape of a land unit is assumed to be square and the size of a land unit is informed by the measurement accuracy of soil types, agricultural working space, irrigation scale, and other physical limitations. Land unit could be viewed as the most precise block for a decision
making level in farmland management. On the other hand, "decision unit" is defined as the farmer chosen scale for practical land management, which is a trade-off between convenience and precision. The size of decision unit could be any integer multiple of a land unit while the shape of a decision unit is a rectangle. A decision unit could be as small as one land unit or as big as the whole farmland. All the treatments and management options such as seed type selec-tion and/or irrigaselec-tion frequency setting in a decision unit are the same (among all land units in that decision unit). Based on these definitions, the problems could be a restatement of how to choose the scale of the decision unit and how to make optimal management option deci-sions within each decision unit. The hierarchical structure between land units and decision units make the proposed model flexible such that it can be extended to a farm that contains multiple disjoint pieces of land as well as to apply it to larger scales.
Several assumptions were made in the proposed model. It is assumed that the irrigate sys-tem already exists and it could apply different management options for each decision unit. It is also assumed that soil types will only affect the ability of holding water; they have the same nutrition levels [18]. The amount of water used in each irrigation is based on soil types, and the soils will achieve their saturated level after each irrigation [19]. It is assumed that irrigation will stop when the crops are dead. It should be noted that additional spatial constraints are included in the case study section to achieve a comprehensive analysis.
3. Model formulation
In this section, the mixed integer linear programming model for farmland management prob-lem is introduced. The objective is to maximize the farmer’s annual net profit when consider-ing a specific farm.
3.1 Mathematical notations
The mathematical notations are summarized inTable 1.
3.2 Objective function
The objective is to maximize the farmer’s annual net profit, which is defined as the total reve-nues subtracted by total system costs during the farming process. The binary decision variable
xiurepresents whether management optioniis used in land unitu. The total revenues include
revenue from selling crop grain as well as net revenue from selling the by-product crop resi-dues. For example, corn stover, which is the residues after harvesting the corn grain, is an important feedstock for production of second generation biofuels [20]. Alpha (α) is the resi-dues index that is defined as the mass ratio between crop grain and biomass resiresi-dues. Beta (β) is the sustainability factor which is the percentage of biomass residue that has to be left in the field to sustain the soil nutrients. Evapotranspiration, also known as crop water use, is defined as the water removed from the soil by evaporation from the soil surface and transpiration by the plants. Evaporation can account for 20% to 30% of growing season evapotranspiration. Gamma (γ) is defined as the water use efficiency, the ratio between evapotranspiration and total purchased irrigation water.Table 2summarizes the mathematical formulation of compo-nents in the objective function.
A variety of system costs have been considered in the model including labor costs, irrigation costs, machinery costs, seed costs, chemicals costs, cash overhead, and non-cash overhead. Cash overhead consists of various cash expenses during the year that are assigned to the whole farm such as insurance, office expenses, machinery maintenance, and field supervisors’ salary. Non-cash overhead includes capital recovery cost (annual depreciation and interest costs) for equipment and other farm investments. In order to have a concise expression and focus on the
impact of irrigation water management, several costs including labor costs, machinery costs, seed costs, and chemicals costs are lumped into a single cost called "other farm operating costs". Irrigation cost includes water purchasing cost and a fixed cost of labor and equipment.
Corepresents the overhead cost per acre (cash and non-cash). The objective function is thus defined as follows. max xiu Z¼XI i¼1 XJ j¼1 XU u¼1xiuLjuðYijEPþYijEað1 bÞR b=ð1 aÞÞ XI i¼1 XJ j¼1 XU u¼1xiuLjuðC m ijEþC f ijEþWijC w=gÞ C0 A
Table 1. Notations for proposed model.
Subscripts
r 1,2,. . ., R irrigation frequency
s 1,2,. . ., S seed type
i(r, s) 1,2,. . ., I management option
j 1,2,. . ., J land condition (soil types)
m 1,2,. . ., M location of land unit in the horizontal axis
n 1,2,. . ., N location of land unit in the vertical axis
u(m, n) 1,2,. . ., U land unit (and its location)
v 1,2,. . ., V decision unit Binary decision Variables
xiu whether management option i is used in land unit u
yru whether irrigation frequency option r is used in land unit u
zsu whether seed type s is used in land unit u
Parameters
A size of total farmland
Bv set of land unit in decision unit v
E size of land unit
Co overhead cost (cash and non-cash)
Cw unit cost for water
Cf
ij fixed cost of each irrigation for management option i used for land condition j
Cm
ij other farm operating cost for management option i used for land condition j
Lju land conditions j for land unit u
Wij amount of water needed for irrigation when management option i used for land condition j
Yij unit maize yield when management option i used for land condition j
Y minimum yield requirement for the farmland
Bm budget limit for other farming cost
Bw budget limit for irrigation
Rb unit revenue for selling biomass
P unit market corn price
Wl irrigation water limitation per season
Wp unit pre-irrigation water amount
Z objective value
α residues index
β sustainability factor
γ water use efficiency
3.3 Constraints
The farming process requires upfront investment, which affects a farmer’s cash flow. Farmers set up budget limits for certain cost categories.Constraint 1ensures the total irrigation cost is below its budget. Constraint2ensures that other farm costs are below budget limit. No budget limit is set for overhead cost since it is independent from management decisions. For the con-sideration of food safety and a stable market, the government will encourage farmers to pro-duce at least certain amount of crop in some cases. Similar total yield constraints are needed when there is a contract for a yield mandate. These situations are indicated inConstraint 3. Meanwhile, as a vulnerable and valuable resource, the amount of irrigation water is often lim-ited in a growing season [8]. This irrigation water limitation is reflected inConstraint 4. Con-straint 5ensures that the management decisions of land units are the same within a certain decision unit.Constraint 6ensures that the irrigation frequency decisions are uniform within a certain decision unit.Constraint 7ensures that the seed type selection decisions are uniform within a certain decision unit. It is noteworthy that the decision unit for irrigation is not neces-sarily the same as the decision unit for seed type. Only one type of decision could be made for each land unit, as indicated in Constraints8and9. Constraints10and11govern that compre-hensive decisions should be chosen from the union feasible region for each individual deci-sion. The binary nature of decision variables are defined in theConstraint 12.
XI i¼1 XJ j¼1 XU u¼1xiuLjuðC f ijEþWijC w=gÞ Bw ð1Þ XI i¼1 XJ j¼1 XU u¼1xiuC m ijLjuEBm ð2Þ XI i¼1 XJ j¼1 XU u¼1xiuLjuYijEY ð3Þ XI i¼1 XJ j¼1 XU u¼1xiuLjuWij=gþW pAWl ð4Þ xiu¼xiu08u;u02Bv ð5Þ yru¼yru08u;u02Bv ð6Þ zsu¼zsu08u;u0 2Bv ð7Þ Table 2. Components in the objective function.
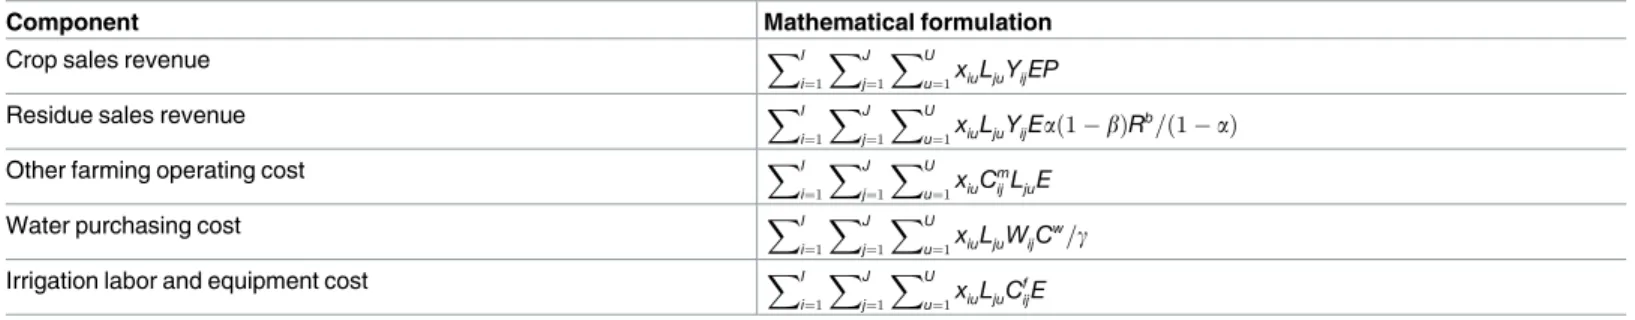
Component Mathematical formulation
Crop sales revenue XI
i¼1 XJ
j¼1 XU
u¼1xiuLjuYijEP
Residue sales revenue XI
i¼1 XJ j¼1 XU u¼1xiuLjuYijEað1 bÞR b=ð1 aÞ
Other farming operating cost XI
i¼1 XJ j¼1 XU u¼1xiuC m ijLjuE
Water purchasing cost XI
i¼1 XJ j¼1 XU u¼1xiuLjuWijC w=g
Irrigation labor and equipment cost XI
i¼1 XJ j¼1 XU u¼1xiuLjuC f ijE https://doi.org/10.1371/journal.pone.0174680.t002
XR r¼1yru¼18u ð8Þ Xs s¼1zsu¼18u ð9Þ xiuyru8u ð10Þ xiuzsu8u ð11Þ xiw; yrw;zsu2 f0;1g 8i;r;s;u ð12Þ
4. Case study
In California, the total area planted for field corn was 210 436 hectares (520,000 acres) with the highest corn grain production occurring in Central Valley. Meanwhile, the overextended Cen-tral Valley aquifer is one of the most vulnerable water resources, which could create additional risks for the $65 billion-a-year corn industry [17]. As an irrigated summer crop, the amount of irrigation applied to California field corn will largely determine how much water is available to the crop. Thus, it is imperative to implement precision farm management in this area. In this section, a farm located in Yolo County, Central Valley, California, is selected to conduct a case study and illustrate the proposed model. The size of the land is 65.56 hectares (162 acres) and the shape of the land is square. Extensions of the basic model on different implementation con-ditions are also discussed.
4.1 Data source
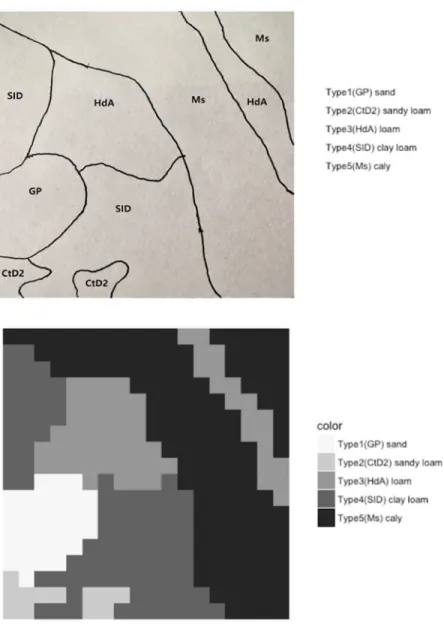
In the Central Valley, corn planting occurs from March through June and the time to mature is about 80 days to 130 days depending on the variety. Broadly, corn development can be divided into the vegetative stage that lasts through tassel and the reproduction stages that include silking, pollination, and grain filling. Since the plants don’t consume much water in the early vegetative stage (first 4 weeks) and do not need much irrigation, this study only con-siders the reproduction stages which involves irrigations (approximately 15 weeks). A variety of soil textures are present in the farms used for field corn production. Sandy soils are pre-ferred for early plantings because they warm rapidly in the spring. Heavier soils are productive, provided they are well drained and properly irrigated. The soil information up to 0.91 meters (36 inches) in depth is collected using the Web of Soil Survey. This information is used to define six integrated soil types (sand, loamy sand, sandy loam, loam, silt loam or clay loam, and clay) based on the Unified Soil Classification System (USCG). The water holding capacity of the soil types are adapted from literature [21,22]. As shown in the upper part ofFig 1, there are five different types of soil in this farmland. Type 1 is the sand soil and Type 5 is the clay soil. This piece of land is divided into 324 land units and each land unit is a square with an acreage of 0.2 hectares (0.5 acres). If there are more than one soil type in a land unit, majority vote is applied to decide the soil type for that land unit, as shown in the lower part ofFig 1.
The Central California Irrigation District (CCID) is one of the largest irrigation districts in the Central Valley, serving over 1,600 farms across more than 57870 hectares of prime farm-land. The price of irrigation water is volatile and varies significantly by location, water usage, and water type (well water or surface water). In this study, farmers use both well and surface
water at an average price of $0.073/cubic meters ($90/acre-foot). Seasonal irrigation water lim-its are set when insufficient water is available due to weather conditions and government regu-lations. For example, the CCID set seasonal irrigation water limits to be 2664 cubic meters (2.16 acre-feet) in 2014 and 3700 cubic meters (3 acre-feet) in 2015. The baseline of total water available is set to be 3083 cubic meters (2.5 acre-feet) per season in the case study. Six irrigation frequencies are available for selection (every day, every week, every other week, every three weeks, every four weeks, and never). Irrigation cost and overhead cost information are based on estimates from the Natural Resources Conservation Service (NRCS) and University of Cali-fornia Cooperative Extension [23]. Currently, almost all corn grown in California is irrigated by surface irrigation. In this study, the surge irrigation system is used with a water use effi-ciency of 0.6, meaning that 40% of the purchased water is lost during transportation, irrigation, and soil penetration. A pre-irrigation of 822 cubic meters (8 acre-inches) is applied in March. Other farm operating costs are estimated as $1333/hectare ($358 for machinery, $91 for labor, and $884 for seed and chemicals), and these costs are uniformly applied [24].
Fig 1. Schematic map (upper) and integrated map (lower) for soil types.
Researchers from the University of California, Davis, reported a yield range from 12.54 to 18.81 metric ton per hectare with a minimum 1131 cubic meters survival water requirement for corn. In this analysis, twelve candidate grain corn seeds are created: three seeds for each of four major seeds types, including stringy, drought, smart, and extravagant. These seeds have different levels of drought resistance and have a yield range from 13.17 to 18.81 metric ton per hectare [25]. These seeds share the same time needed to mature with a total evapotranspiration of approximately 63.5 cm. The planting density is on average 83950 per hectare for each seed type. The average annual price received by U.S. corn producers from marketing years 2000 to 2015 is $141/metric ton, with a range from $71.65/metric ton to $271.26/metric ton according to the National Agricultural Statistical Service (NASS) of the U.S. Department of Agriculture. The baseline for corn market price in the case study is set at $141/metric ton. Corn stover could be used to serve as an abundant source of winter feed for cattle, and can also be used as the feedstock for biofuel production. The annual corn stover yield is estimated based on corn grain yield with a residue harvest index of 0.5, meaning 50% of the above ground biomass is grain and the amount of corn stover is the same as grain [26]. Papendick and Moldenhauer [27] showed that a 30% removal rate results in 93% soil cover after residue harvest. Thus, the sustainability factor (β) is set to be 0.3. It is assumed that the farm under consideration does not have a baler and therefore prefers to sell unharvested stover and let the buyer do harvest-ing. The unit revenue for selling unharvested cornstalks is $35 per metric ton [28]. All cost data have been adjusted for inflation to 2015 U.S. dollars.
4.2 Results for Model I
Model with Constraints1to4, andConstraint 12is defined as the Model I. The objective func-tion and major constraints are consistent with the literature [7,15]. In Model I, the size of a decision unit is set to be equal to the land units. Spatial structure and management scales are included in other models which will be defined later.Fig 2shows that the managing option decisions are mainly chosen by the soil conditions; sandy land needs irrigation more fre-quently while clay land needs less irrigation. All decision unit chose the same seed type.
These results are consistent with a "farming by soil" philosophy [4]. Part of the sandy land is idle due to the total irrigation water amount limitation. The net profit for this 65.56 hectare of farmland is $29,615, which yields to an average profit of $451.85/hectare. In order to have a baseline for comparing with previous literature and different model settings, a baseline sce-nario is introduced. In the baseline scesce-nario, the size of a decision unit is set to be the entire land (uniform decisions for the whole farmland). The model yields to an average profit of $113.22/hectare under this scenario. University of California Cooperative Extension reported an average profit range of $72.65/hectare to $135.91/hectare under same corn price with simi-lar conditions [23]. The baseline scenario’s profit located at higher part of this range. The aver-age profit of $113.22/hectare from baseline scenario will be used for comparison between difference models.
Comparing results from Model I with the baseline scenario, although the Model I increase the profit significantly, these results require the most precise level of management, for exam-ple, valves in the surge irrigation system need to be switched at each irrigation. Model I should be regarded as the practice with highest precision requirements, which will serve as the upper bound on profitability.
4.3 Risk analysis
It should be noted that selection of modeling parameters is critical for the analysis results. In reality, the parameters in the model can exhibit great uncertainty due to market fluctuations,
and extreme weather events. Sensitivity analyses, which consider the influence of one parame-ter on the objective at a time by assuming other parameparame-ters as constant, have been adopted as a paradigm to evaluate uncertainties in the parameters and their influence [29]. The parame-ters under investigation include corn market priceP, irrigation water priceCw, other farm operating costCm
ij, overhead costC
o, water use efficiencyγ, and seasonal water limitWl. The
ranges of corn market pricePand irrigation water priceCware based on historical data, while the ranges of other parameters under investigation are±25% of the base level.
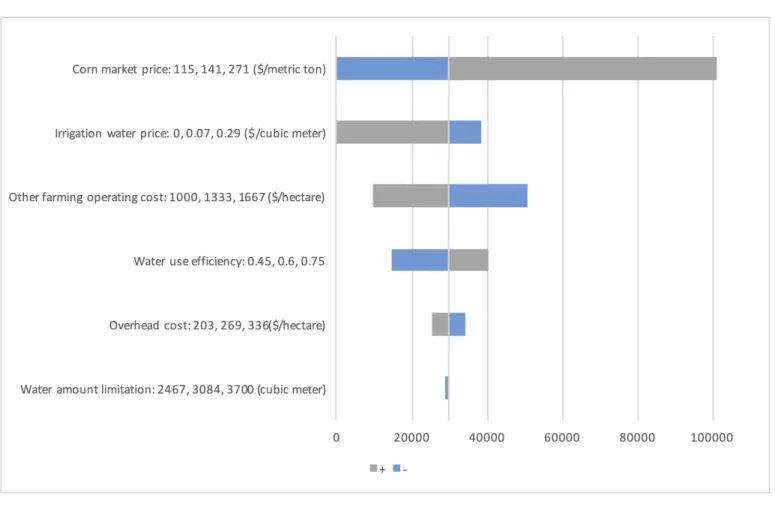
As shown inFig 3, the parameters with largest impact on annual net profit are corn market pricePand irrigation water priceCw. The significant variation of these two parameters leads to high leverage for the annual net profit. Corn market price is influential because it is the key factor for gross income. The trigger price of corn market price for growing is $115.35/metric ton; corn market price lower than this point will lead to insufficient profit to cover farm costs. On the other hand, the termination price of irrigation water price is $0.28/cubic meters; irriga-tion water price that is higher than this point will make farming unprofitable. Extremely high irrigation water prices due to special weather events will affect net profit significantly. The annual net profit is also sensitive to other farm operating costCm
ij, and water use efficiencyγ,
which gives us insight about potential directions to increase annual net profit.
Fig 2. Irrigation decisions for basic model.
Due to market fluctuations and climate change, making decisions under specific scenarios became a widely concerning problem. In 2014 and 2015, several California irrigation districts could not provide irrigation water for Class II lands, which refers to soils with moderate limita-tions that reduce the choice of plants or require moderate conservation practices. Farmers of these lands have to pay for private well water at an auction price over $0.41/cubic meters, and the water suffers a loss factor related to the field’s distance from the well source. A third of the Westlands district’s farmland (242811 hectares) were left unplanted in 2014 due to especially high irrigation water prices. The local government asked the farmers to conduct risk analysis before making decisions [30]. A risk analysis tool based on our basic model could be easily applied to these farmlands and give appropriate recommendations. The analysis shown already indicates that corn market prices and irrigation water prices are dominating parameters for annual net profit. The simultaneous change of corn market prices and irrigation water prices by assuming other parameters hold constant can give us insight about the profit region. As shown inFig 4, Region A is the non-profitable region and Region B is the profitable region. If the speculated corn market price is relatively low and the irrigation water price is relatively high, farmers should change the crop type or leave the land idle to avoid further loss.
4.4 Discussion
In this section, some special cases are discussed to illustrate the flexibility of the proposed model. Additional constraints are included to make the model robust under different realistic assumptions such as spatial structure and management scales.
Fig 3. Sensitivity analysis of model parameters on annual net profit.
Fig 4. Contour plot (upper) and surface plot (lower) for profit region. Region A is the non-profitable region and
Region B is the profitable region, the darkness indicates the profit level.
4.4.1 Effect of size and shape of decision unit. Spatial relationship among land units are
an essential part of the farmland model. In this section, the effect of size and shape of decision unit on annual profit are discussed. Even though precise farmland management will lead to more profit, it requires more management effort. The precision level and standardization level constitute a pair of tradeoffs. It is more realistic to make decisions on a larger scale and on a regular shape. In other words, each decision unit should contain multiple neighboring land units, and all land units in the same decision unit should share the same seed type and irriga-tion frequency. Three decision unit shape structures are investigated, namely square structure, row structure, and column structure. Meanwhile, several decision unit sizes are considered in order to find out the effect of scales.
Constraint 5is added to the Model I, this new set of constraints ensure that the manage-ment decisions are uniform within a certain decision unit. This new constrained model will be referred to as Model II. Model I can be viewed as a special case of Model II with the scale of decision units equal to the land unit.
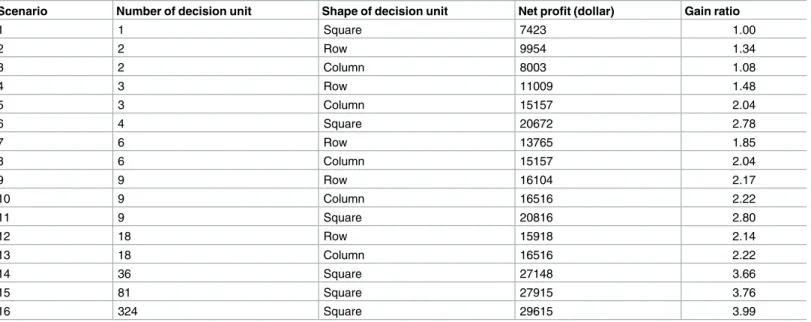
Sixteen scenarios are generated based on the size, shape, and number of decision units. The first scenario, which applies uniform decision for the whole farmland, is the baseline for com-parison as introduced earlier. The gain ratio is defined as the annual net profit ratio between a certain scenario and the first scenario.Table 3summarizes the annual net profit and gain ratio for each scenarios. As increasing the numbers of decision units (decreasing the size of decision units), the gain ratio is increased in general. These results indicate that detailed preci-sion farmland management will bring high net profit. It also shows that the square structure is preferred because it has a higher gain ratio for the same size of decision unit and it has better flexibility.Table 3also shows that the marginal benefit (of having more decision units) decreases. A highest gain ratio of 3.99 could be achieved by applying the philosophy of preci-sion farm management.
4.4.2 Special irrigation patterns. Up to this point, the model assumed that the decisions
about seed type selection and irrigation frequency design are made simultaneously within each decision unit. However, due to the limitation of irrigation system, applying different irrigation frequencies to each decision unit may be cumbersome. Motivated by this practical limit, now
Table 3. Effect of decision unit.
Scenario Number of decision unit Shape of decision unit Net profit (dollar) Gain ratio
1 1 Square 7423 1.00 2 2 Row 9954 1.34 3 2 Column 8003 1.08 4 3 Row 11009 1.48 5 3 Column 15157 2.04 6 4 Square 20672 2.78 7 6 Row 13765 1.85 8 6 Column 15157 2.04 9 9 Row 16104 2.17 10 9 Column 16516 2.22 11 9 Square 20816 2.80 12 18 Row 15918 2.14 13 18 Column 16516 2.22 14 36 Square 27148 3.66 15 81 Square 27915 3.76 16 324 Square 29615 3.99 https://doi.org/10.1371/journal.pone.0174680.t003
the model allows different precision levels (size and shape of decision unit) between seed type selection and irrigation frequency design. Variablesyruandzsuare included to indicate that
each decision unit for seed type selection could have multiple irrigation frequencies and vice versa. Constraints6to11are added to Model II, and this new model is referred to as Model III. Model II can be viewed as a special case of Model III with a certain irrigation pattern.
Although Model III could capture any regular size and shape of decision unit in theory, three special irrigation patterns are investigated considering the irrigation system limitation, namely, Pattern 1: same irrigation frequency for each row (contains eighteen land units); Pat-tern 2: same irrigation frequency for each column (contains eighteen land units); and PatPat-tern 3: same irrigation frequency for the whole farmland.
For each irrigation pattern, sixteen scenarios of seed type precision levels are investigated. These scenarios have the same definitions as in Model II. One dimension of precision manage-ment could be applied using Model III. On one hand, the authors want to find out the effect on annual profit by changing the precision level of seed type alone under certain irrigation pat-terns. On the other hand, the authors also want to investigate the effect on annual profit by changing the precision level of irrigation frequency alone under certain precision level of seed type selection. Under the same precision level of seed type selection, "relative gain for custom-ized irrigation" (RGI) is defined as the net profit ratio between the highest profit (from Pattern 1, Pattern 2 or Model II) and profit for Pattern 3.
Table 4summaries the annual net profit for three irrigation patterns under sixteen scenar-ios of seed type precision levels. As shown in the last column ofTable 4, the RGI ranges between 2.00 to 2.42, which means that if the farmers have already decided the precision level of seed types selection, approximately 100% to 142% increase of net profit could be achieved by applying customized irrigation management. These increases are more significant under square decision units for seed type selection. On the other hand, if the farmers only allow pre-cision management on seed type selection and use uniform irrigation frequency for the whole farmland (Pattern 3), the best gain ratio is 1.81. This result indicates that there is limited room
Table 4. Effects of special irrigation patterns.
Scenario Net profit (dollar) RGI
Pattern 1 Pattern 2 Pattern 3
1 15529 16516 7423 2.22 2 15041 16516 7423 2.22 3 14484 16516 7423 2.22 4 14814 16516 8100 2.04 5 15529 16516 7423 2.22 6 15529 16516 8781 2.35 7 15403 16516 8100 2.04 8 14590 16250 7423 2.19 9 16104 16516 8184 2.02 10 14610 15411 7592 2.18 11 15878 16533 9681 2.15 12 16104 16403 8201 2.00 13 15894 16516 7522 2.20 14 17345 15882 11235 2.42 15 17718 18150 12111 2.30 16 19001 18265 13404 2.21
Best gain ratio 2.56 2.46 1.81
for improving the net profit if farmers do not allow precision management on irrigation. When farmers allow some degree of precision management on irrigation (Pattern 1 and 2), the gain ratio will reach its upper bound at approximately 2.5.
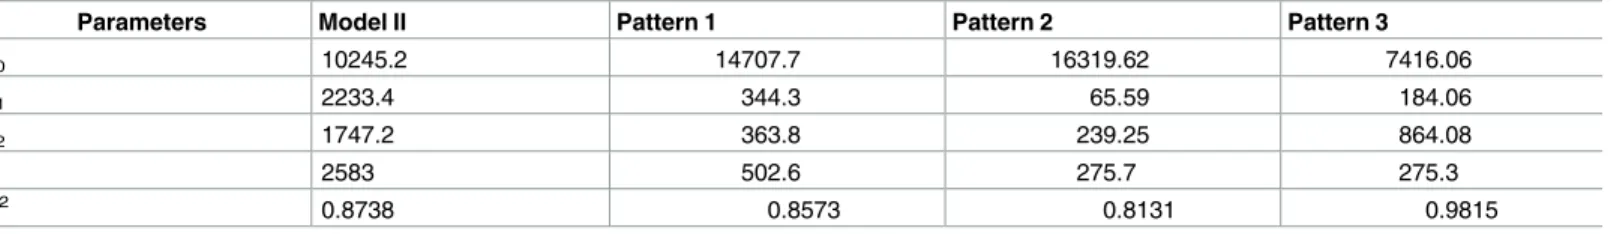
To find out the quantitative relationships between the annual net profit with the number and shape of decision units under each irrigation pattern, regression analyses is conducted. Based on the hereinabove data analysis, logarithmic functions could be used to capture the effect of increasing the number of decision units, and a square structure has higher annual net profit under similar conditions. The following linear regression model is selected because it fits the data well and is easy to interpret.
Pa¼b
0þb1lnðnÞ þb2lnðnÞIðShape¼squareÞ þε ð13Þ The response variablePais the annual net profit and the explanatory variablenis the num-ber of decision units.εis the random error that is not captured in the regression model, which is assumed to follow a normal distribution with mean zero and varianceσ2.I() is the indicator
function which takes value one when conditions are met and takes value zero when conditions are not met.β0could be interpreted as the baseline of annual net profit when there is only one decision unit.β1could be interpreted as the increment of annual net profit when the natural logarithm of the number of decision units increases by one. This increment will change toβ1+
β2when a square structure is selected. The best linear unbiased estimates and coefficient of determination (R2) are summarized inTable 5. These results show that choosing a square structure and having more decision units has a positive effect on the annual net profit. The effects of number and shape of decision unit are more significant when two dimensional preci-sion management is applied. A logarithmic function could describe the accelerated decline of the effects from the number of decision units on the annual net profit quite well.
In summary, farmers could gain an additional 10%-80% net profit by employing precision management on seed type selection under certain irrigation patterns, and farmers could gain as much as an additional 142% net profit by working precision management on irrigation under certain seed type selection policy. One-dimensional precision management is relatively easier to implement but has a lower net profit. Precision management for irrigation appears to be more beneficial.
Besides confirming the dominant effect of crop prices and yields on net profit as stated in literature [23], this case study shows that irrigation water price, spatial structure, and manage-ment scales are also influential factors. The results from this case study show great economic potential of precision farmland management, and this recommendation is consistent with the literature [8].
4.4.3 Potential for sustainable water usage. Although this study is mainly focused on
economic analysis, it is important to take environmental issues into consideration. Water resources are limited and vulnerable, and corn is a thirsty plant. General strategies for coping with limited water include deficit irrigation of crops which can be stressed without significant
Table 5. Summary of regression analysis.
Parameters Model II Pattern 1 Pattern 2 Pattern 3
β0 10245.2 14707.7 16319.62 7416.06 β1 2233.4 344.3 65.59 184.06 β2 1747.2 363.8 239.25 864.08 σ 2583 502.6 275.7 275.3 R2 0.8738 0.8573 0.8131 0.9815 https://doi.org/10.1371/journal.pone.0174680.t005
loss of yield or quality, improving irrigation efficiency, improving crop genetics to develop varieties more tolerant to water stress, or planting other crops.
Reducing water amounts below what is required for corn will result in biomass reduction and grain yield reduction. What is more, the irrigation systems commonly used for corn in California do not allow close management of water stress. Thus, significant water savings can’t be obtained by withholding water from the crop at present.
However, the method by which water is applied to the field could be improved. Strategies to maximize limited water include changes to irrigation management, design, or systems. Recall that in Model II and III, it is assumed that each land unit in a decision unit receives the same amount of water, which means some land units in a decision unit are over-irrigated and some water resources are wasted. Model I could eliminate this waste by having a land unit scale cus-tomized irrigation management.
Properly managed irrigation can apply a relatively uniform amount of water. However, application of high frequency may not be feasible with this system because of the labor input required for each irrigation. If farmers want to save water resources even further by applying deficit irrigation, new irrigation systems should be used such as sprinkler irrigation and travel-ing-gun irrigation. The proposed model could be easily modified to consider deficit irrigation. To illustrate this point, assume the irrigation technology could allow us to achieve at least par-tial saturation levels for a decision unit. Instead of assuming the corn cannot survive when it receives partial irrigation water, it is assumed that the yields of corn are depended by the satu-ration level. In other words, one more dimension of decision, the amount of irrigation water for each decision unit, are added in the model framework.
In summary, Model I is a special case of Model II with 324 decision units. Model II is a spe-cial case of Mode III with a certain irrigation pattern. These nested relationships indicate the flexibility of the proposed model.
5. Conclusions
In the study, a farm-level precision farmland management problem for pre-season seed type selection and irrigation water management is introduced. A mixed integer linear program is proposed with discussion on extensions and varieties of the basic model on different imple-mentation conditions. Farmland in California serves as a case study to test the model’s flexibil-ity and economical optimalflexibil-ity. The model gives qualitative descriptions and quantitative analysis for the management scale (number and shape of decision units). Special irrigation pat-terns are considered and the results show that the farmer’s annual net profit could be signifi-cantly increased by applying one or two dimensional precision management decisions based on the proposed model. This model also serves as a decision making and risk analysis tool for farmers facing seasonal irrigation water limits and extreme drought conditions.
Note that this study is subject to a number of limitations. Firstly, the weather conditions such as temperature and rainfall are not considered in this model. These weather parameters affect the evaporation level of plants, pre-irrigation amount, and moisture level of the soil sig-nificantly. In addition, as discussed in the risk analysis, the parameters are not certain. Thus, a linear programming model with constant coefficients cannot fully describe the decision mak-ing environment [31]. Other modeling methods such as stochastic programming, dynamic programming, and robust optimization could be investigated [26]. In addition, multi-period models are needed for deficit irrigation design and invest new irrigation system.
The authors are working on a modified model which could take multi-period decisions of the seed hybrid and plant population selection, and amount of irrigation water, taking uncer-tain weather conditions and market price into consideration. This modified model would
make the irrigation frequency and amount more flexible and precise. A stochastic program would be a natural fit to solve this problem; the first stage decision could be which type of plant seeds to grow while the other stage decisions could be the land management options such as irrigation amount for each irrigation.
The case study presented to illustrate and validate this optimization model only considers a certain piece of land. However, the shapes of farmland could affect the agricultural machinery paths and the homogeneous features of the soil could affect the shapes and sizes of decision units [32]. Motivated by finite element analysis, other future work includes develop models that allow different shapes and sizes of decision units in a piece of land. Last but not least, the proposed model could be used to evaluate other crops as well; and the interaction among plants such as plant population, leaf cover, and water competition could be stressed in future research.
Author Contributions
Conceptualization: QL GH TJ BG. Data curation: QL TJ BG. Formal analysis: QL GH TJ. Investigation: QL GH TJ BG. Methodology: QL GH TJ BG. Project administration: GH BG. Software: QL TJ. Validation: QL GH TJ BG. Writing – original draft: QL.Writing – review & editing: QL GH TJ BG.
References
1. Sarker R, Quaddus M. Modelling a nationwide crop planning problem using a multiple criteria decision making tool. Computers & Industrial Engineering. 2002; 42(2):541–53.
2. Tao F, Yokozawa M, Zhang Z. Modelling the impacts of weather and climate variability on crop produc-tivity over a large area: a new process-based model development, optimization, and uncertainties anal-ysis. agricultural and forest meteorology. 2009; 149(5):831–50.
3. Seppelt R, Voinov A. Optimization methodology for land use patterns—evaluation based on multiscale habitat pattern comparison. Ecological Modelling. 2003; 168(3):217–31.
4. McBratney A, Whelan B, Ancev T, Bouma J. Future directions of precision agriculture. Precision Agri-culture. 2005; 6(1):7–23.
5. Zhang N, Wang M, Wang N. Precision agriculture—a worldwide overview. Computers and electronics in agriculture. 2002; 36(2):113–32.
6. Bongiovanni R, Lowenberg-DeBoer J. Precision agriculture and sustainability. Precision agriculture. 2004; 5(4):359–87.
7. Sethi LN, Kumar DN, Panda SN, Mal BC. Optimal crop planning and conjunctive use of water resources in a coastal river basin. Water resources management. 2002; 16(2):145–69.
8. Brown PD, Cochrane TA, Krom TD. Optimal on-farm irrigation scheduling with a seasonal water limit using simulated annealing. Agricultural Water Management. 2010; 97(6):892–900.
9. Fereres E, Soriano MA. Deficit irrigation for reducing agricultural water use. Journal of experimental bot-any. 2007; 58(2):147–59.https://doi.org/10.1093/jxb/erl165PMID:17088360
10. Georgiou P, Papamichail D. Optimization model of an irrigation reservoir for water allocation and crop planning under various weather conditions. Irrigation Science. 2008; 26(6):487–504.
11. Ganji A, Ponnambalam K, Khalili D, Karamouz M. A new stochastic optimization model for deficit irriga-tion. Irrigation Science. 2006; 25(1):63–73.
12. Singh A. Irrigation planning and management through optimization modelling. Water resources man-agement. 2014; 28(1):1–14.
13. Wardlaw R, Bhaktikul K. Application of genetic algorithms for irrigation water scheduling. Irrigation and Drainage. 2004; 53(4):397–414.
14. Nagesh Kumar D, Raju KS, Ashok B. Optimal reservoir operation for irrigation of multiple crops using genetic algorithms. Journal of Irrigation and Drainage Engineering. 2006; 132(2):123–9.
15. Gorantiwar S, Smout I. Multilevel approach for optimizing land and water resources and irrigation deliv-eries for tertiary units in large irrigation schemes. II: Application. Journal of irrigation and drainage engi-neering. 2005; 131(3):264–72.
16. Yamout G, El-Fadel M. An optimization approach for multi-sectoral water supply management in the Greater Beirut Area. Water Resources Management. 2005; 19(6):791–812.
17. Barton B, Clark SE. Water & Climate Risks Facing US Corn Production: How Companies & Investors Can Cultivate Sustainability. A Ceres Report Boston, MA. 2014.
18. Eswaran H, Ahrens R, Rice TJ, Stewart BA. Soil classification: a global desk reference: CRC Press; 2002.
19. Saxton K, Rawls W. Soil water characteristic estimates by texture and organic matter for hydrologic solutions. Soil science society of America Journal. 2006; 70(5):1569–78.
20. Li Q, Hu G. Techno-economic analysis of biofuel production considering logistic configurations. Biore-source technology. 2016; 206:195–203.https://doi.org/10.1016/j.biortech.2016.01.101PMID:
26859327
21. Campbell GS. Soil physics with BASIC: transport models for soil-plant systems: Elsevier; 1985.
22. Saxton K, Rawls WJ, Romberger J, Papendick R. Estimating generalized soil-water characteristics from texture. Soil Science Society of America Journal. 1986; 50(4):1031–6.
23. Wright S, Klonsky K., Stewart D. and others. University of California Cooperative Extension 2015 Sam-ple Costs Produce Field Corn on Mineral Soils in the Sacramento Valley. 2015. Department of Agricul-tural and Resource Economics, UC Davis: Davis, CA. 2015.
24. Plastina A. Estimated Costs of Crop Production in Iowa, 2015. Iowa State University Extension & Out-reach. 2015.
25. Schwankl L, Fulton A. Corn ET Estimates 2015 [cited 2015 Feb.].http://ucanr.edu/sites/Drought/files/ 167003.pdf.
26. Li Q, Hu G. Supply chain design under uncertainty for advanced biofuel production based on bio-oil gas-ification. Energy. 2014; 74:576–84.
27. Papendick RI, Moldenhauer W. Crop residue management to reduce erosion and improve soil quality: Northwest. Conservation research report (USA). 1995.
28. Edwards W. Estimating a value for corn stover. Iowa State University Extension, Ag Decision Maker Document A1-70. 2014.
29. Li Q, Zhang Y, Hu G. Techno-economic analysis of advanced biofuel production based on bio-oil gasifi-cation. Bioresource technology. 2015; 191:88–96.https://doi.org/10.1016/j.biortech.2015.05.002
PMID:25983227
30. Vekshin A. California Water Prices Soar for Farmers as Drought Grows 2015 [cited 2016 Feb 2016].
http://www.bloomberg.com/news/articles/2014-07-24/california-water-prices-soar-for-farmers-as-drought-grows.
31. Itoh T, Ishii H, Nanseki T. A model of crop planning under uncertainty in agricultural management. Inter-national Journal of Production Economics. 2003; 81:555–8.
32. Spekken M, de Bruin S. Optimized routing on agricultural fields by minimizing maneuvering and servic-ing time. Precision agriculture. 2013; 14(2):224–44.