FINANCIAL REPORTING STANDARDS AND TECHNIQUES THROUGH CASE ANALYSES
By:
Alexandria Marquart
A thesis presented in partial fulfillment of requirements for the Sally McDonnell Barksdale Honors College at The University of Mississippi.
Oxford, Mississippi May 2019
Approved by: __________________________ Advisor: Dr. Victoria Dickinson __________________________ Reader: Dr. Mark Wilder
© 2019
Alexandria Paige Marquart ALL RIGHTS RESERVED
ABSTRACT
ALEXANDRIA MARQUART: FINANCIAL REPORTING STANDARDS AND TECHNIQUES THROUGH CASE ANALYSES
(Under the direction of Victoria Dickinson)
During my time at the University of Mississippi, I joined The Sally McDonnell Barksdale Honors College (SMBHC) through the junior year entry program, while studying accountancy in The Patterson School of Accountancy. The opportunities provided by the SMBHC were endless, including the option of completing an alternate thesis. The alternate thesis truly changed the direction of my career and success in my accounting academic courses. On a bi-weekly basis for one academic year, I researched and analyzed twelve unique case studies to further my knowledge of accounting
principles and standards. These cases helped me explore the unique challenges that arise throughout different clients in the work environment and showed me how to determine a reasonable solution for these issues. Every week without a case, I was granted the
opportunity to build relationships with accounting firms and professionals throughout the world. Dr. Dickenson encouraged students to connect with the professionals and attend case competitions, while challenging our minds throughout the cases. This course, the Honors College, and Dr. Dickenson all allowed me to connect with firm employees and recruiters on a more specialized, one-on-one basis, and ultimately led me to an internship and future career at KPMG in the St. Louis, Missouri office. Throughout my internship, I was able to grasp many of concepts discussed as results of the following case studies. My performance and understanding led me to accept a full time job with KPMG and further my academic career at the Patterson School of Accountancy’s Data and Analytics Master’s Program.
© 2019 Alexandria Marquart ALL RIGHTS RESERVED
TABLE OF CONTENTS
CASE 1: Analysis Comparing Glenwood and Eads Heating, Inc………...…………1
CASE 2: Profitability and Earnings Persistence………....………14
CASE 3: Accounts Receivable………,……….………20
CASE 4: Diluted Earnings Per Share………..…...32
CASE 5: Property, Plant and Equipment……….………..37 CASE 6: Research and Development Costs……….……….….……...49 CASE 7: Data Analytics………..………..58
CASE 8: Long-Term Debt……….…...……...67
CASE 9: Shareholders’ Equity……….……….77
CASE 10: Marketable Securities……….…..83
CASE 11: Deferred Income Taxes.……….…………..92
LIST OF TABLES AND CHARTS
Case 1: Analysis Comparing Glenwood and Eads Heating, Inc. 1
Table 1-1: Analysis of Financial Ratios.……….……….…3
Table 1-2: First-Year Transactions – Glenwood..………...5
Table 1-3: First-Year Transactions – Eads………..5
Table 1-4: Income Statement –Glenwood………..6
Table 1-5: Income Statement –Eads………...7
Table 1-6: Statement of Retained Earnings –Glenwood………8
Table 1-7: Statement of Retained Earnings –Eads……….8
Table 1-8: Balance Sheet – Glenwood……….……...9
Table 1-9: Balance Sheet –Eads………...10
Table 1-10: End-of-Year Transactions – Glenwood………..11
Table 1-11: End-of-Year Transactions – Glenwood (Continued)…..……….…………..12 Table 1-12: End-of-Year Transactions –Eads…….………..12 Table 1-13: End-of-Year Transactions – Eads (Continued)….….………13 Case 3: Accounts Receivable 20
Table 3-1: T-Account –Provision for Bad and Doubtful Debts………27
Table 3-2: Bad-Debt Journal Entries……….28 Table 3-3: T-Account –Provision for Sales Returns………...…..29
Table 3-4: Sales Returns Journal Entries……….……..30
Table 3-5: T-Account –Trade Receivables, Gross………31 Table 3-6: Gross Trade Receivables Journal Entries ………31 Case 5: Property, Plant and Equipment 37
Table 5-1: Straight-Line Depreciation Table………...44
Table 5-2: Double-Declining Depreciation Table………...45
Table 5-3: Straight-Line Depreciation: Gain/Loss on Disposal………..…..46
Table 5-4: Double-Declining Depreciation: Gain/Loss on Disposal……….47
Case 6: Research and Development Costs 49
Table 6-1: T-Account –Product and Software Development, Net………53
Table 6-2: Comparative Research and Development Schedule……….56
Table 6-3: Comparative Schedule of Net Assets and Total Assets………...57
Table 6-4: Comparison of Proportion and R&D to Net Sales………...57
Case 8: Long-Term Debt 67
Table 8-1: Journal Entry for Issuance of Notes at Par ………...71
Table 8-2: Journal Entry to Record Annual Interest Payment on Note Outstanding.…....71
Table 8-3: Journal Entry to Record Retirement of Notes……….…….72
Table 8-4: Journal Entry to Record Interest Expense on Notes ……..………..73
Table 8-5: Journal Entry to Record Issuance of Notes at a Discount……..………..74
Table 8-6: Comparative Schedule of Effective Interest Rate...……….75
Case 9: Shareholders’ Equity 67
Table 9-1: Comparative Schedule of Shareholders’ Equity………..81
Executive Summary
The financial statement comparisons between Glenwood Heating, Inc. and Eads Heating, Inc. will be useful for potential investors while evaluating each company. Investors will see faithful and reliable information to help them decide which company will use their money in the best way possible. Each heating company began operations at the beginning of 20X1, which leads their numbers to be similar in the beginning
transactions. However, as the companies continue business, certain numbers and ratios prove that each company has its’ own strengths and weaknesses.
Overall, Glenwood’s financial reports show a greater net profit along with higher
retained earnings for the first year of operations. Yet, Eads Heating, Inc. has greater cash flows and a smarter lease contract, both advantages for this startup company, meaning the company has a probable chance at being more successful in the future.
Presented in this document are the Multistep Income Statements, Statements of Retained Earnings, and Classified Balance Sheets for each company. Before the financial reports, a chart with key ratios will be shown along with a ratio analysis explaining the meaning of the ratios.
Analysis and Investment Decision
Looking at the ratios for each company, I believe Eads Heating, Inc. is the better investment in terms of long-term success. Investors must look at current financial reports, but keep in mind that future profits will benefit the company, investors, and shareholders most in the long run. Glenwood proves to be more profitable in the first year with higher a gross profit margin, return on equity (ROE), and earnings per share (EPS). However, Glenwood’s low cash balance, lower liquidity, and possible fluctuating rent on equipment
leads me to the conclusion that Eads Heating, Inc. is the better company to invest in. Eads Heating, Inc. will maintain a more stable profit because of their larger cash balance (explained further on page 10) and lease agreement with set terms.
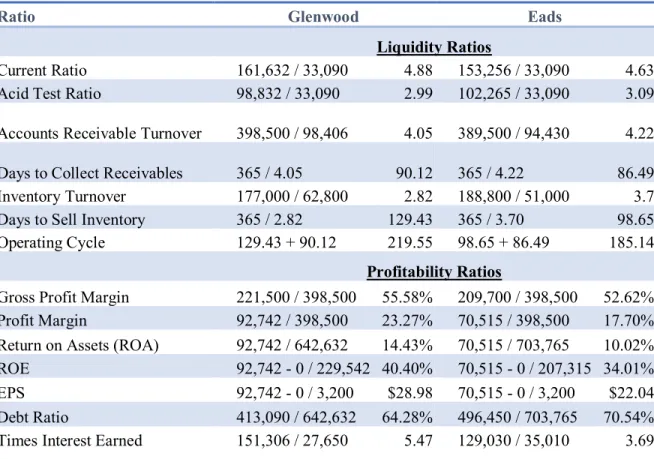
Table 1-1: Analysis of Financial Ratios Ratios
Ratio Glenwood Eads
Liquidity Ratios
Current Ratio 161,632 / 33,090 4.88 153,256 / 33,090 4.63 Acid Test Ratio 98,832 / 33,090 2.99 102,265 / 33,090 3.09 Accounts Receivable Turnover 398,500 / 98,406 4.05 389,500 / 94,430 4.22 Days to Collect Receivables 365 / 4.05 90.12 365 / 4.22 86.49 Inventory Turnover 177,000 / 62,800 2.82 188,800 / 51,000 3.7 Days to Sell Inventory 365 / 2.82 129.43 365 / 3.70 98.65 Operating Cycle 129.43 + 90.12 219.55 98.65 + 86.49 185.14
Profitability Ratios
Gross Profit Margin 221,500 / 398,500 55.58% 209,700 / 398,500 52.62% Profit Margin 92,742 / 398,500 23.27% 70,515 / 398,500 17.70% Return on Assets (ROA) 92,742 / 642,632 14.43% 70,515 / 703,765 10.02% ROE 92,742 - 0 / 229,542 40.40% 70,515 - 0 / 207,315 34.01% EPS 92,742 - 0 / 3,200 $28.98 70,515 - 0 / 3,200 $22.04 Debt Ratio 413,090 / 642,632 64.28% 496,450 / 703,765 70.54% Times Interest Earned 151,306 / 27,650 5.47 129,030 / 35,010 3.69
Liquidity Ratio Analysis
Using ratios is a simpler way to compare the two companies. Looking at the current ratio above, Eads and Glenwood Heating have similar liquidity rates. Glenwood has a higher liquidity rate by .25, which is a positive attribute for Glenwood. However, Eads’ acid-test ratio is greater by .10, meaning the company is more likely to pay off its
Glenwood by approximately 30 days. An important factor for investors is Eads’ ability to receive cash quicker and sell more inventory roughly a month in advance of Glenwood.
Profitability Ratio Analysis
Regarding the profitability ratios, investors see that Glenwood has a higher profit margin and that Eads has a higher debt ratio. However, investors need to keep in mind that Eads Heating, Inc. only has a higher debt ratio because they have higher total liabilities and total assets due to their leased equipment. Due to the fact that their equipment has set terms, Eads is still the smarter investing decision. Eads also uses the double-declining balance method for delivery equipment depreciation. This method depreciates most of the fixed asset during the first few years of its useful life, meaning the book value of the asset will decrease each year. As depreciation decreases, net income will begin to increase therefore making future profitability greater for Eads in the years to come.
Table 1-2: Glenwood Heaters, Inc. First-Year Transactions
Table 1-3: Eads Heaters, Inc. First-Year Transactions Cash
Accounts
Receivable Inventory Land Building Equipment
Accounts
Payable Notes Payable Interest Payable Common Stock Retained Earning No. 1 $160,000 $160,000 No. 2 400,000 $400,000 No. 3 (420,000) $70,000 $350,000 No. 4 (80,000) $80,000 No. 5 $239,800 $239,800 No. 6 $398,500 $398,500 No. 7 299,100 (299,100) No. 8 (213,360) (213,360) No. 9 (41,000) (20,000) (21,000) No. 10 (34,200) (34,200) No. 11 (23,200) (23,200) No. 12 $6,650 (6,650) Balance $47,340 $99,400 $239,800 $70,000 $350,000 $80,000 $26,440 $380,000 $6,650 $160,000 $313,450 Glenwood Heating, Inc. Transactions (A)
Assets Liabilities Equity
Cash
Accounts
Receivable Inventory Land Building Equipment
Accounts
Payable Notes Payable Interest Payable Common Stock Retained Earning No. 1 $160,000 $160,000 No. 2 400,000 $400,000 No. 3 (420,000) $70,000 $350,000 No. 4 (80,000) $80,000 No. 5 $239,800 $239,800 No. 6 $398,500 $398,500 No. 7 299,100 (299,100) No. 8 (213,360) (213,360) No. 9 (41,000) (20,000) (21,000) No. 10 (34,200) (34,200) No. 11 (23,200) (23,200) No. 12 $6,650 (6,650)
Eads Heating, Inc. Transactions (A)
First-Year Transaction Notes
Notice the two charts of first-year operation transactions are identical, except for the company name. These initial transactions will lead us to the starting balances in the financial statements.
Table 1-4: Glenwood Heaters, Inc. Multistep Income Statement Glenwood
Income Statement
For the Year Ended December 31, 20X1
Sales $398,500
Cost of Goods Sold (177,000)
Gross Profit 221,500
Operating Expenses
Rent Expense $16,000
Depreciated Expense - Building 10,000 Depreciated Expense - Equipment 9,000
Bad Debt Expense 994
Other Operating Expenses 34,200 (70,194)
Income from Operations 151,306
Other Expenses and Losses
Interest Expense (27,650)
Income before Income Tax 123,656
Income Tax (30,914)
Net Income for the Year $92,742.00
Earnings per Share $28.98
Multistep Income Statement Notes
Looking at each company’s income statement (Eads’ income statement below),
take note that the companies began making different accounting decisions. For example, Glenwood’s manager estimates 1 percent of ending accounts receivable will be
will be uncollectable. This leads to a difference of $3,976 in the Bad Debt Expense account making Glenwood’s income higher. Also, the earnings per share is very high for
Glenwood, meaning the company is profitable, which is an advantage for investors and shareholders.
Table 1-5: Eads Heaters, Inc. Multistep Income Statement Eads
Income Statement
For the Year Ended December 31, 20X1
Sales $398,500
Cost of Goods Sold (188,800)
Gross Profit 209,700
Operating Expenses
Depreciated Expense - Building $10,000 Depreciated Expense - Equipment 20,000 Depreciated Expense - Lease Equipment 11,500
Bad Debt Expense 4,970
Other Operating Expenses 34,200 (80,670)
Income from Operations 129,030
Other Expenses and Losses
Interest Expense (35,010)
Income before Income Tax 94,020
Income Tax (23,505)
Net Income for the Year $70,515.00
Earnings per Share $22.04
Multistep Income Statement Notes
On another note, Eads’ company manager decides to use the double-declining
straight-line method making Glenwood’s depreciation on delivery equipment to be $11,000 cheaper, or $9,000. With this information, investors will see that Glenwood is more profitable than Eads by $22,227 in the first year of operations. However, the 8-year leased equipment purchased by Eads will be a future advantage as far as cash flows. It looks like Eads is far less profitable, but a main factor is because the leased equipment is on the company’s books as if Eads Heating, Inc. purchased it themselves.
Table 1-6: Glenwood Heating, Inc. Statement of Retained Earnings Glenwood Heating, Inc.
Retained Earnings Statement For the Year Ended December 31, 20X1
Retained Earnings, January 1, as reported $0
Add: Net Income 92,742
Less: Dividends (23,200)
Retained Earnings, December 31 $69,542
Table 1-7: Eads Heating, Inc. Statement of Retained Earnings Eads Heating, Inc.
Retained Earnings Statement For the Year Ended December 31, 20X1
Retained Earnings, January 1, as reported $0
Add: Net Income 70,515
Less: Dividends (23,200)
Statement of Retained Earnings Notes
The comparison between the two statements of retained earnings simply shows that the retained earnings for Glenwood Heating, Inc. is higher in alignment with net income. Many investors can look at these numbers and see that Glenwood is more profitable and therefore should choose to invest in Glenwood Heating, Inc.
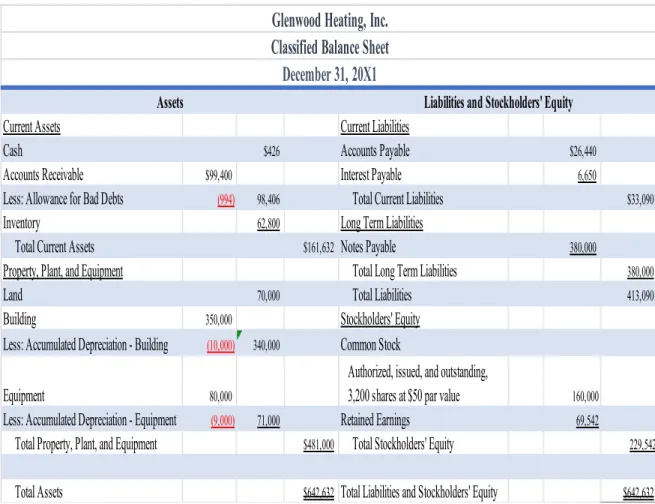
Table 1-8: Glenwood Heating, Inc. Balance Sheet
Current Assets Current Liabilities
Cash $426 Accounts Payable $26,440
Accounts Receivable $99,400 Interest Payable 6,650
Less: Allowance for Bad Debts (994) 98,406 Total Current Liabilities $33,090 Inventory 62,800 Long Term Liabilities
Total Current Assets $161,632 Notes Payable 380,000
Property, Plant, and Equipment Total Long Term Liabilities 380,000
Land 70,000 Total Liabilities 413,090
Building 350,000 Stockholders' Equity Less: Accumulated Depreciation - Building (10,000) 340,000 Common Stock
Equipment 80,000
Authorized, issued, and outstanding,
3,200 shares at $50 par value 160,000 Less: Accumulated Depreciation - Equipment (9,000) 71,000 Retained Earnings 69,542
Total Property, Plant, and Equipment $481,000 Total Stockholders' Equity 229,542 Total Assets $642,632 Total Liabilities and Stockholders' Equity $642,632
Assets Liabilities and Stockholders' Equity
Classified Balance Sheet
Glenwood Heating, Inc.
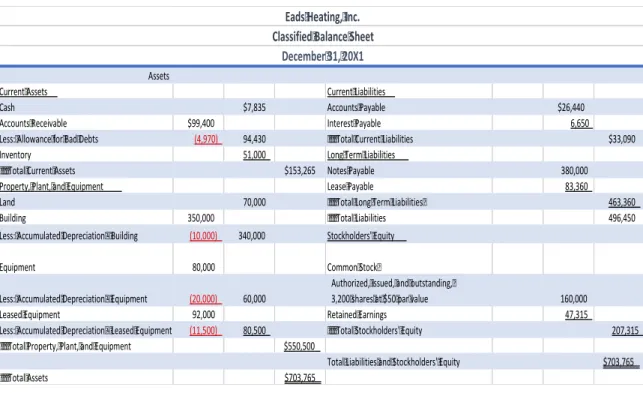
Table 1-9: Eads Heating, Inc. Balance Sheet
Balance Sheet Notes
As we look at the two balance sheets, notice that Eads Heating, Inc. has a higher total assets balance because of their leased equipment. Having large account balances in the Leased Equipment and Lease Payable accounts, the cash flows will be higher for Eads Heating, Inc. Referring to the acid test ratio, Eads’ ratio is a little higher than
Glenwood’s ratio--meaning Eads has a better change at paying off their liabilities. This
leads us to conclude that Eads company is able to pay their debt obligations while having a better safety margin. When looking at the cash balance, we see that Eads balance is much greater than Glenwood’s cash balance. Investors should make note of this and
recall that a startup company with little cash could potentially struggle making payments, especially because Glenwood’s operating cycle is 34.41 days longer than Eads.
Current Assets Current Liabilities
Cash $7,835 Accounts Payable $26,440
Accounts Receivable $99,400 Interest Payable 6,650
Less: Allowance for Bad Debts (4,970) 94,430 Total Current Liabilities $33,090 Inventory 51,000 Long Term Liabilities
Total Current Assets $153,265 Notes Payable 380,000
Property, Plant, and Equipment Lease Payable 83,360
Land 70,000 Total Long Term Liabilities 463,360
Building 350,000 Total Liabilities 496,450
Less: Accumulated Depreciation - Building (10,000) 340,000 Stockholders' Equity
Equipment 80,000 Common Stock
Less: Accumulated Depreciation - Equipment (20,000) 60,000
Authorized, issued, and outstanding,
3,200 shares at $50 par value 160,000
Leased Equipment 92,000 Retained Earnings 47,315
Less: Accumulated Depreciation - Leased Equipment (11,500) 80,500 Total Stockholders' Equity 207,315 Total Property, Plant, and Equipment $550,500
Total Liabilities and Stockholders' Equity $703,765
Total Assets $703,765
Assets
Eads Heating, Inc. Classified Balance Sheet
Transactions
The following tables show all of the transactions throughout the year to compute the year-end balances for each heating company. Notice transaction 4 where each company’s management decided on different terms for the equipment. Glenwood chose
to simply rent the equipment, whereas Eads chose to lease the equipment.
Table 1-10: Glenwood Heaters, Inc. End-of-Year Transactions
Transaction Cash Accounts Receivable Allowance for Bad
Debts Inventory Land Building
Accumulated Depreciation Building Equipment Accumulated Depreciation Equipment Balances Part A $47,340 $99,400 $239,800 $70,000 $350,000 $80,000
Part B (1) Bad Debts ($994)
Part B (2) COGS (177,000) Part B (3) Depreciation Building $10,000 Equipment ($9,000) Part B (4) Equipment Rental Payment (16,000) Part B (5) Income Tax
Balances $31,340 $99,400 ($994) $62,800 $70,000 $350,000 ($10,000) $80,000 ($9,000)
Glenwood Heaters, Inc. B Transactions
Table 1-11: Glenwood Heaters, Inc. End-of-Year Transactions (Continued)
Table 1-12: Eads Heaters, Inc. End-of-Year Transactions
Balances $ 31,340.00 $ 99,400.00 $ (4,970.00) $51,000.00 $ 70,000.00 $ 350,000.00
Liabilities Stockholders' Equity
Accounts Payable
Interest
Payable Note Payable
Lease Payable Common Stock Retained Earnings Balances Part A $26,440 $6,650 $380,000 $160,000 $313,450
Part B (1) Bad Debts (4,970)
Part B (2) COGS (188,800) Part B (3) Depreciation Building (10,000) Equipment (20,000) Part B (4) Equipment Rental Payment $83,360 (18,000)
Part B (5) Income Tax (23,505)
Balances $ 26,440.00 $ 6,650.00 $ 380,000.00 $83,360.00 $160,000.00 $ 48,175.00
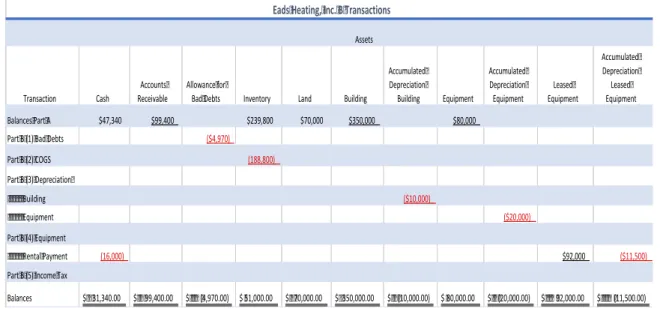
Transaction Cash
Accounts Receivable
Allowance for
Bad Debts Inventory Land Building
Accumulated Depreciation Building Equipment Accumulated Depreciation Equipment Leased Equipment Accumulated Depreciation Leased Equipment Balances Part A $47,340 $99,400 $239,800 $70,000 $350,000 $80,000
Part B (1) Bad Debts ($4,970)
Part B (2) COGS (188,800) Part B (3) Depreciation Building ($10,000) Equipment ($20,000) Part B (4) Equipment Rental Payment (16,000) $92,000 ($11,500)
Part B (5) Income Tax
Balances $31,340.00 $ 99,400.00 $ (4,970.00) $51,000.00 $70,000.00 $350,000.00 $ (10,000.00) $80,000.00 $ (20,000.00) $ 92,000.00 $ (11,500.00)
Eads Heating, Inc. B Transactions
Table 1-13: Eads Heaters, Inc. End-of-Year Transactions Balances $31,340 $99,400 ($994) $62,800 $70,000 Accounts Payable Interest Payable Note Payable Common Stock Retained Earnings Balances Part A $26,440 $6,650 $380,000 $160,000 $313,450
Part B (1) Bad Debts (994)
Part B (2) COGS (177,000) Part B (3) Depreciation Building (10,000) Equipment (9,000) Part B (4) Equipment Rental Payment (16,000)
Part B (5) Income Tax (30,914)
Balances $26,440 $6,650 $380,000 $160,000 $69,542
Executive Summary
Throughout this case, “Molson Coors Brewing Company – Profitability and Earnings Persistence,” I successfully explained the type of information classified income
statements provide and achieved a better understanding of specific income statement items and how to account for them through “Other Expenses and Losses” and “Other Revenues and Gains” on the income statement. With a better understanding of these
items, investors should be able to determine the reasoning behind reporting special items as an operating expense, to calculate the effective tax rate of a company, and to
understand other disclosure information while evaluating a company’s profitability. Specifically, this case provides financial statement users with decision-useful information that can be found in the financial statements notes. Although, Molson Coors should provide the maximum amount of information on the face of the financial statements rather than bury special items in the note disclosures.
Analysis
The Molson Coors Brewing Company case taught me about accounting for special items. I learned about reoccurring special items and how to account for them with “Other Expenses and Losses” and “Other Revenues and Gains” on the income statement.
It was interesting to read the company’s validation for listing the special items as
operating expenses in their notes. In this case, I explained my opinion on the subject. I also learned how to explore and collect information from a company’s notes during this
case. Being emphasized in all of my classes, I was excited to navigate through notes and understand the importance reading the notes diligently.
1. What are the major classifications on an income statement?
The major classifications on an income statement are revenue, expenses, gains and losses. The sections on an income statement are operating, non-operating, income tax, discontinued operations, non-controlling interest, and earnings per share. When setting up a multi-step income statement, the order should follow:
• Sales
• Cost of Goods Sold • Gross Profit
• Selling and Administrative Expenses • Income from Operations
• Other Revenues and Gains • Other Expenses and Losses • Earning Before Tax
• Tax
• Net Income
• Earnings per Share / Diluted Earnings per Share (if necessary)
2. Explain why, under U.S. GAAP, companies are required to provide “classified” income statements.
Under U.S. GAAP, companies are required to provide “classified” income
statements to assist investors and shareholders on evaluating each individual department, which sections are bringing in high profits and which ones are bringing in low profits. This information also helps readers estimate future cash flows.
3. In general, why might financial statement users be interested in a measure of persistent income?
Persistent income is the income or earnings that are consistent throughout the accounting periods of a company. Financial statement users are interested in persistent income to see how the departments are progressing over time. If departments are continuously bringing in revenue, readers are more likely to invest in the company.
4. Define comprehensive income and discuss how it differs from net income. Comprehensive income is the change in equity (net assets) of an entity during a period from transactions, other events, and circumstances from non-owner sources. It includes all changes in equity during a period except those relating from investments by owners and distributions to owners. Comprehensive income has unrealized holding gains and losses and available for sale securities, which is not considered a part of net income.
Process and Analysis
1. The income statement reports “Sales” and “Net Sales.” What is the difference? Why does Molson Coors report these two items separately?
Sales is the number of units sold multiplied by the selling price for each unit. This company does not include sales returns and allowances and sales discounts in their sales balance. That being said, net sales in this case scenario are sales less the excess taxes on sales. Alcohol and shipment tax are referred to as excess tax.
2. Consider the income statement item “Special items, net” and information in Notes 1 and 8.
Special items are the charges incurred or benefits realized that are not indicative of the company’s core operations. The special items included in Molson Coors
Brewing Company are listed:
• infrequent or unusual items
• Impairment or asset abandonment-related losses
• Restructuring charges and other atypical employee-related cost
• Fees on termination of significant operating agreements and gains (losses) on disposal of investments
ii. Explain why the company reports these on a separate line item rather than including them with another expense item. Molson Coors classifies these special items as operating expenses. Do you concur with this classification? Explain.
The company reports these special item expenses on a separate line rather than including them with a different expense item because of persistent income, which is defined above. I disagree with the classification of Molson Coors special items as operating expenses because the special items are not directly associated with the production of goods or services.
3. Consider the income statement item “Other income (expense), net” and the information in Note 6. What is the distinction between “Other income (expense), net” which is classified as a nonoperating expense, and “Special items, net” which Molson Coors classifies as operating expense?
“Other income (expense), net” is classified as a non-operating expense because all
Coors reports their special items as operating expenses because they believe these items could be reoccurring in the future.
4. Refer to the statement of comprehensive income. What is the amount of
comprehensive income in 2013? How does this amount compare to net income in 2013?
The amount of comprehensive income in 2013 is $765,400,000. The difference between net income and comprehensive income takes place due to the dirty surplus. Dirty surplus items are unrealized gains and losses that are listed on the statement of
shareholders’ equity rather than the income statement. The dirty surplus items are listed
under “Other comprehensive income (loss), net of tax,” which can be located on Molson
Coors’ comprehensive income statement.
5. Consider the information on income taxes, in Note 7. What is Molson Coors’ effective tax rate in 2013?
Molson Coors’ effective tax rate in 2013 is the income tax expense divided by the
pre-tax income. This means $84,000,000 (tax expense) / $654,500,000 (pre-tax income) which equals 12.8%.
Executive Summary
With headquarters located in London, England, Pearson is an international company with businesses relating to education, business information, and consumer publishing. Pearson’s direct operations provide learning materials, technology,
assessments, and services to educational institutions, corporations and professional organizations, as well as teachers and students of all ages. Being an international company, Pearson plc accepts multiple currency exchange rates, which is shown throughout this case. Overall, the Pearson case explains in depth the various types of receivables, how to estimate allowances for doubtful accounts and sales returns and allowances, as well as how to account for the receivables through journal entries and T-accounts.
Analysis
In the Pearson plc—Accounts Receivable case, I broadened my knowledge of accounts receivable terminology, allowance usage, and journal entries by taking a closer look at hands on receivables. I found it interesting that accounting terminology varies across the world, such as the “allowance” term in the U.S. being the same as a
“provision” in the U.K. The Pearson case also encouraged me to research more about
foreign currency exchange rates. Finally, seeing the different movements on the provision for bad debt and doubtful accounts helped me infer what detailed information companies truly use to reach their end-of-year balances, rather than being given a simplified version from a textbook.
1. What is an account receivable? What other names does this asset go by?
A receivable is defined as a financial asset with claims against customers and others for money, goods, or services. However, an account receivable is a short-term asset obligation where a customer orally promises to pay for goods and services sold. Another, more general, name for an account receivable is a trade receivable. Trade receivables are defined as customers owing amounts to a business for the goods or services provided by that business. Trade receivables can be accounts or notes receivable.
2. How do accounts receivable differ from notes receivable?
Accounts receivable differ from notes receivable in a few ways. An account receivable reflects an oral promise, is a current asset, and is generally paid within a nonspecific due date period. A sale in which a customer pays with credit increases an account receivable, and typically does not collect interest revenue. For example, The University of Mississippi purchases a $250 textbook on account from Pearson. Pearson’s
account receivables will increase by $250 and their textbook inventory will decrease by $250. The University of Mississippi will then have an obligation to pay Pearson $250 in the next 30 to 60 days.
A note receivable is a written promise, can be current or noncurrent, and has a specific maturity date for the note plus interest accrued. Interest for notes receivable is usually collected periodically throughout the loan. For example, if Pearson lends $1,000 to a client with a written agreement that the client will pay the company back, plus a 6% semiannual interest rate, then Pearson records a $1,000 increase in notes receivable and will expect to earn $60 in interest revenue twice a year.
3. What is a contra account? What two contra accounts are associated with
Pearson’s trade receivables (see Note 22)? What types of activities are captured in each of these contra accounts? Describe factors that managers might consider when deciding how to estimate the balance in each of these contra accounts.
A contra account is an account that reduces an asset, liability, or owners’ equity
account on the balance sheet. Contra accounts can also contradict income statement accounts. For example, the sales return and allowances account, which is a contra account, reduces the sales account on the income statement. The two contra accounts for Pearson’s trade receivables are allowance for sales returns and allowances and allowance
for doubtful accounts, which is noted in footnote 22.
The first type of activity captured in the allowance for sales returns and
allowances contra account is the estimated sales returns and allowances for the period. At the end of the period, you will find the actual amount of sales returns and allowances. The actual amount of sales returns and allowances decreases the amount of the balance in the allowance account.
Similar to the first type of activity captured above, the allowance for doubtful accounts, which is a contra accounts receivable account, estimates bad debts using a percentage of receivables. This estimate becomes the balance for this contra account. During the period, the actual write-off amounts, or the uncollectable amounts, decrease the balance in the allowance for doubtful accounts.
Some factors that managers might consider when deciding how to estimate the balance in these contra accounts is using previous year actual amounts of bad debts and
sales returns and allowances. Managers should also consider current economic conditions and how material their product or service is to their target market.
4. Two commonly used approaches for estimating uncollectible accounts receivable are the percentage-of-sales procedure and the aging-of-accounts procedure. Briefly describe these two approaches. What information do managers need to determine the activity and final account balance under each approach? Which two approaches do you think results in a more accurate estimate of net accounts receivable?
The percentage-of-sales procedure provides a reasonably accurate estimate of the receivables’ realizable value, without identifying specific accounts. This method may be
applied using one composite rate that reflects an estimate of the uncollectible receivables. Estimating bad debt expense with a focus on the income statement, the percentage-of-sales for example, is still used today; however, recent accounting rules state it is not appropriate. Although the percentage-of-sales method provides better matching of bad debt expense to sales, the balance in the allowance typically does not provide a faithful estimate of the net realizable value.
The aging-of-accounts procedure applies a different percentage based on past experience to the various age categories and identify which accounts require special attention. Age categories are based on the extent to which specific accounts are past due; categories range from “under 30 days” up to “over 120 days.” That being said, the longer
a receivable is outstanding, the higher the percentage estimate to be uncollectible. During calculation, this percentage uses historical loss rates.
Under the percentage-of-sales procedure, managers need to determine the total amount of credit sales and an estimated uncollectable percentage, which can be found by an analyst. After finding these numbers, multiply the two together and that number tells management the estimate of bad debt expense.
The aging-of-accounts procedure requires more information to calculate the estimated uncollectible accounts receivable. First, management needs to use accounts receivable information to determine how many customers have receivables outstanding and the total for each age category. Then, management will need to find an estimated uncollectible percentage and multiply the percentage by the total receivable amount from each age category. The number found is the required balance in the allowance account for the certain age categories. After each age category allowance balance is obtained,
management will need to add the numbers together to discover the year-end balance of allowance for doubtful accounts.
As mentioned earlier, the percentage-of-sales procedure does not provide a representationally faithful estimate of net realizable value. Therefore, I believe the aging-of-accounts procedure will result in a more accurate estimate of net accounts receivable.
5. If Pearson anticipates that some accounts will be uncollectible, why did the company extend credit to those customers in the first place? Discuss the risks that managers must consider with respect to accounts receivable.
Although some accounts will be uncollectible, Pearson still extends credit to these customers because it is difficult to predetermine who will break their promises to pay before the sale is made. It is unlikely that Pearson would review each customer’s credit
score for their goods and services, as some real estate or auto businesses do with large purchases. Pearson may strategize by hiring someone to observe the accounts receivable and to ensure that customers pay their uncollectible accounts on time, or just in general. Pearson may also look at previous financial statements to consider if a customer should be allowed to purchase with credit or not. Managers risk losing cash for the company by not closely watching accounts receivable and decreasing net income by selling goods or services to customers with uncollectible accounts. They also risk negatively effecting cash flows if sales revenue is increasing yet cash is decreasing.
6. Note 22 reports the balance in Pearson’s provision for bad and doubtful debts (for trade receivables) and reports the account activity (“movements”) during the year ended December 31, 2009. Note that Pearson refers to the trade receivables contra account as a “provision.” Under U.S. GAAP, the receivables contra account is typically referred to as an “allowance” while the term provision is used to
describe the current-period income statement charge for uncollectible accounts (also known as bad debt expense).
i. Use the information in Note 22 to complete a T-account that shows the activity in the provision for bad and doubtful account during the year. Explain, in your own words, the line items that reconcile the change in account during 2009.
Table 3-1: T-Account -- Provision for Bad and Doubtful Debts Provision for Bad and Doubtful Debts (£)
72,000,000 5,000,000 26,000,000 20,000,000 3,000,000 £76,000,000
During 2009, the provisions for bad and doubtful debts account changes as line items affect the account. The beginning balance of £72,000,000 comes from the 2008 provision for bad and doubtful debts ending balance. The first
transaction is for a gain on exchange differences of £5,000,000. To explain exchange differences, Pearson accepts payments in dollars ($) from the U.S., who experience a higher exchange rate than pounds (£). Once the company converts the dollars to pounds to match their other financial statements and sales, Pearson will record a gain on foreign exchange currencies. Next, the income statement movement transaction of £26,000,000 is to record the actual bad debt expenses that are increasing expenses on the income statement. The third transaction of £20,000,000 is for utilizing the estimated amount of bad debt provisions, or writing off the account receivable that is uncollectible. The final transaction of £3,000,000 is for acquisition through business combination, meaning Pearson acquired another business type or segment of a business and used the book value of that businesses’ bad debts as well.
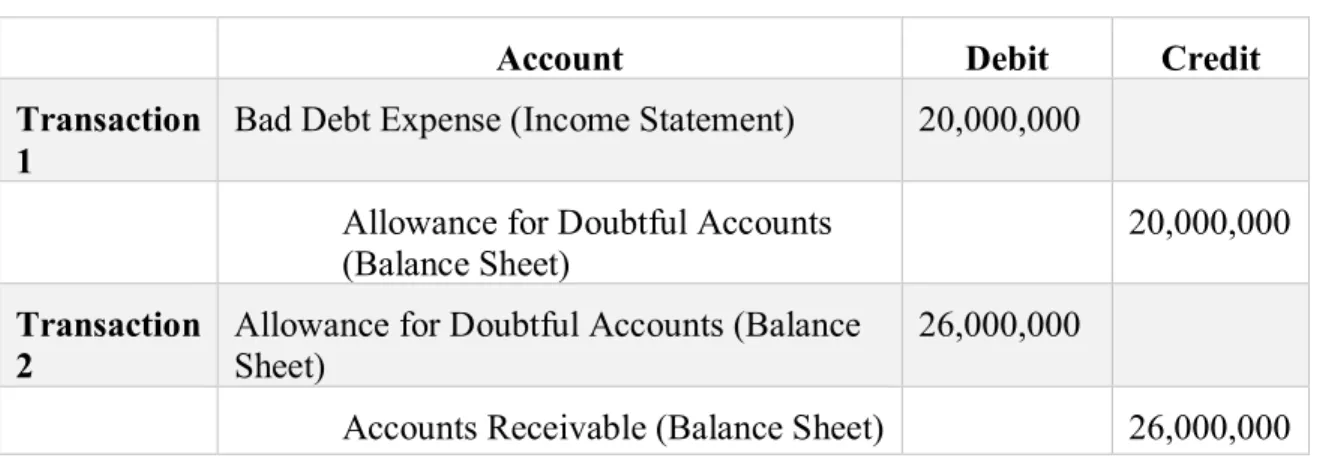
ii. Prepare the journal entries that Pearson recorded during 2009 to capture 1) bad and doubtful debts expense for 2009 (that is, the “income statement movements”) and 2) the write-off of accounts receivable (that is, the amount “utilised”) during 2009. For each account in your journal entries, note whether the account is a balance sheet or income statement account.
Note these transaction use pounds (£) for currency. Table 3-2: Bad-Debt Journal Entries
iii. Where in the income statement is the provision for bad and doubtful debts expense included?
In the income statement, the provision for bad and doubtful debts expense is typically included with operating expenses, specifically the selling and
administrative expenses. However, the provision for bad and doubtful debts on a sale that is not within the company’s primary selling activity, the expense could be recorded as a non-operating expense in other expenses and losses.
Account Debit Credit
Transaction 1
Bad Debt Expense (Income Statement) 20,000,000 Allowance for Doubtful Accounts
(Balance Sheet) 20,000,000
Transaction
2 Allowance for Doubtful Accounts (Balance Sheet) 26,000,000
7. Note 22 reports that the balance in Pearson’s provision for sales returns was £372,000,000 at December 31, 2009 and £354,000,000 at December 31, 2009. Under U.S. GAAP this contra account is typically referred to as an “allowance” and reflects the company’s anticipated sales returns.
i. Complete a T-account that shows the activity in the provision for sales returns account during the year. Assume that Pearson estimated returns relating to 2009 Sales to be £425,000,000. In reconciling the change in the account, two types of journal entries are required, one to record the
estimated sales returns for the period and one to record the amount of actual book returns.
The ending balance for 2008 was £372,000,000, which becomes the beginning balance for 2009. Pearson estimated that returns relating to 2009 Sales to be £425,000,000. Since we know the ending balance, we just add the two given numbers and subtract the current balance to find the actual amount of returns. On the next page, these steps are shown in the provisions for sales returns T-account. Table 3-3: T-Account – Provision for Sales Returns
Provision for Sales Returns (£) 372,000,000 425,000,000 443,000,000
£354,000,000
ii. Prepare the journal entries that Pearson recorded during 2009 to capture, 1) the 2009 estimated sales returns and 2) the amount of actual book returns
during 2009. In your answer, note whether each account in the journal entries is a balance sheet or income statement account.
The amount of 2009 estimated sales returns will appear directly below sales revenue on the income statement. Sales returns will be subtracted from sales revenue to determine net sales for 2009.
Table 3-4: Sales Returns Journal Entries
8. Create a T-account for total or gross trade receivables. Analyze the change in this T-account between December 31, 2009 and 2009. Assume that all sales in 2009 were on account. You may also assume that there were no changes to the account due to business combinations or foreign exchange rate changes. Prepare the journal entries to record the sales on account and accounts receivable collection activity in this account during the year.
The T-account showing all changes in the gross trade receivables between December 31, 2008 to 2009 is shown at the top of the next page. The beginning balance of £1,342,000,000 is the 2008 ending balance. The £5,642,000,000 is the total sales for the year, since all sales were made on credit. Next, the cash collections must be
Account Debit Credit
Transaction 1
Sales Returns and Allowance (Balance Sheet)
425,000,000 Allowance for Sales Returns and
Allowances (Balance Sheet) 425,000,000 Transaction
2
Allowance for Sales Returns and Allowances (Balance Sheet)
443,000,000 Accounts Receivable (Balance
Sheet)
computed. The cash collection is the difference between the previous year’s ending accounts receivable balance and the current year balance plus total sales, which is £5,682,000 for Pearson plc. Then, as calculated earlier, the write-off amount of
£20,000,000 is credited to the gross accounts receivable account. Lastly, the actual sale returns of £443,000,000 is credited to the account. After the T-chart transactions are complete, Pearson determines their Gross Accounts Receivable amount.
Table 3-5: T-Account – Trade Receivables, Gross Gross Accounts Receivable (£) 1,342,000,000 5,624,000,000 5,682,000,000 20,000,000 443,000,000 £821,000,000
Table 3-6: Gross Trade Receivables Journal Entries
Account Debit Credit
Transaction 1 Accounts Receivable 5,624,000,000
Sales Revenue 5,624,000,000
Transaction 2 Cash 5,682,000,000
Executive Summary
This case demonstrates the accomplishment a difficult task regarding financial accounting and reporting. A strenuous concept on this topic is diluted earnings per share (EPS). A financial calculation titled basic earnings per share is a much simpler formula, net income less preferred dividends divided by the weighted-average number of shares outstanding, and is always presented on the face of the income statement. However, diluted earnings per share remains far more complex. Diluted earnings per share includes the effect of all potentially dilutive common shares that were outstanding during the period. Generally, companies with complex capital structures will report both basic and dilutive EPS. Complex capital structures exist when a corporation has convertible securities, options, warrants, or other rights that once used could dilute EPS. I will show how to calculate basic and diluted EPS through problem 16-8 in the 16th edition of Intermediate Accounting.
Analysis
Throughout this case, I furthered my knowledge of diluted earnings per share. I realized when you use preferred stock dividends in the numerator and when you convert it to common shares to be used in the denominator. Diluted earnings per share is a key factor of the financial statements for investors to take into account for usual circumstances, such as a company needing to convert all securities for financial support.
Problem 16-8
Note: Diluted EPA is similar to computing basic EPS except diluted EPS includes the effects of all potentially dilutive common shares that were outstanding during the period. When diluted EPS is higher than basic EPS this is called antidilutive EPS. If this occurs, one should not record diluted EPS on the income statement.
EPS = Net Income – Preferred Dividends Weighted-Average Number of Shares Outstanding - Impact of
Convertibles - Impact of Options, Warrants, and Other Dilutive Securities Basic Earnings Per Share
Diluted Earnings Per Share
Part A: Compute basic earnings per share. The basic EPS formula is shown above.
Basic EPS = $1,200,000 – (4,000,000 x .06) = 960,000 = $1.60
$6,000,000 / 10 600,000
To explain in further detail, follow the provided steps:
1. Know the numerator is net income less preferred stock dividends divided
by the weighted-average shares outstanding.
2. Net income of $1,200,000 is given in the problem. However, preferred
dividends must be calculated. We know there are $6,000,000 in convertible, cumulative preferred stock and that the stock is 6% convertible to common
stock. Each share converts into 3 shares of common stock, although that is not necessary for part a of the problem.
3. To calculate preferred stock dividends, we multiply the four million by 6%
to get 240,000 preferred dividends. 4. Add the numerator to get $960,000.
5. Next, know the denominator, or weighted-average shares outstanding is relating to common stock shares outstanding.
6. To calculate the number of common stock shares outstanding, take the common stock price of six million and divide it by the per share price of $10. This should equal $600,000 for the denominator.
7. Divide the numerator, $960,000, by the denominator of $600,000 to reach basic earnings per share of $1.60.
Part B: Compute the diluted earnings per share for 2018. The diluted EPS is shown above; however, diluted earnings per share can be vague. Take note that for this equation, the numerator will consist of net income plus the interest savings, which will be explained further in the steps below.
Diluted EPS = $1,200,000 + $84,000 = $1,284,000 = $1.62 600,000 + 15,000 + 60,000 + 120,000 795,000
The calculation is not as simple as it looks. The steps below further explain the problem: 1. First, note that because the preferred stock is convertible and cumulative, you
would not take the preferred stock dividends into account. In this situation, diluted EPS assumes that all convertibles will be converted at the beginning of the period.
2. Take net income and add interest savings which will be 7 percent of $2,000,000. Then, multiply the number you get by .60 (1 less the tax rate) to account for tax. 3. To get the number of shares (15,000) you will need to use the formula by taking
the market price (which is given to us as $25) less the option price (which is given to us at $20) and then divide by the market price again. Once you’ve reached this
number, which should be .02, you multiply by the number of options (which is given to us at 75,000). This calculation should give you the number of shares at 15,000.
4. The 120,000 shares come from converting our preferred stock to common stock. Calculate this by taking $4,000,000 and dividing by 100. After you get that calculation, multiply by 3 to get 120,000. Multiplying by 3 shares shows that each convertible, cumulative preferred stock is converted into 3 shares of common stock.
5. To calculate the number of common stock shares outstanding, take the common stock price of six million and divide it by the per share price of $10. This will equal 600,000 shares added to the denominator.
Note: You will not report diluted EPS on the income statement because it is antidilutive.
Executive Summary
Being founded in 1932, Palfinger is a manufacturing company with headquarters located in Austria. This company manufactures hydraulic lifting, loading, and handling solutions worldwide. Palfinger primarily serves
construction, transport, agriculture and forestry, recycling, and haulage industries. This large company offers various products for consumers, such as knuckle boom cranes, timber and recycling cranes, telescopic cranes and many other products. Palfinger prepares its financial statements in accordance with the IFRS. In this case, I calculated gains and losses and determined which depreciation methods best benefit the company. This case focuses on two main depreciation methods: straight-line depreciation and double-declining-balance depreciation.
Analysis
The Palfinger case reviewed my knowledge of property, plant, and equipment assets and depreciation methods. This case also helped further my knowledge of the depreciation methods as far as understanding what each depreciation method truly represents when applying it to a company. I learned about how to best calculate gains and losses when taking net present value and book value into consideration as well. Finally, I found it interesting to determine what a company’s options are when it comes to deciding between a major
account for this information and sub-accounts, such as construction in progress, for users.
1. Based on the description of Palfinger, what sort of property and equipment do you think the company has?
Being a manufacturing company for lifting, loading, and handling solutions worldwide, Palfinger has a lot of property, plant, and equipment (PP&E). The company’s PP&E can range from multiple types of cranes, forklifts, and electric pulleys to
warehouses, wire rope, and company trucks.
2. The 2007 balance sheet shows property, plant, and equipment of €149,990. What does this number represent?
Palfinger’s 2007 balance sheet shows property, plant, and equipment of €149,990.
This number represents the net amount of their land, buildings, vehicles, various
inventories, and portions of overhead the company owns. These items are usually fixed or long-term, tangible assets.
3. What types of equipment does Palfinger report in notes to the financial statements?
In the notes, Palfinger reports fixtures, fittings, and equipment for three to nine years under equipment. Fixtures, fittings, and equipment are used in valuing, selling, or liquidating a company or building. These types of equipment include movable furniture,
fixtures, or other equipment that have no permanent connection to the structure of a building or utilities. A few example items are desk chairs, tables, or computers.
4. In the notes, Palfinger reports “Prepayments and assets under construction.” What does this subaccount represent? Why does this account have no accumulated depreciation? Explain the reclassification of €14,958 in this account during 2007.
In the notes, Palfinger reports “Prepayments and assets under construction.” This sub-account represents the construction in progress, meaning it has no accumulated depreciation yet. The reason this sub-account has no depreciation is because the prepayments are not used or acquired yet, and the assets under construction are not complete yet. In accounting, an asset cannot depreciate until it is ready for intended use. The reclassification of €14,958 in this account during 2007 is because the prepayment or
asset under construction became ready for use during 2007.
5. How does Palfinger depreciate its property and equipment? Does this policy seem reasonable? Explain the trade-offs management makes in choosing a depreciation policy.
Palfinger depreciates its property and equipment using the straight-line method over the estimated useful life of the relevant asset. This policy seems reasonable if there is an equal ware of the product throughout its lifespan. However, if the asset is noticeably depreciating in the first couple years and then subtly depreciates after that, it would be better to depreciate the asset using a different method such as, declining balance or double-declining balance. The depreciation methods will vary on the type of company
and how frequently management requires the PP&E asset(s) to be used. The different types of depreciation include: straight line, declining balance (or double declining balance), sum-of-the-years’ digits, and units of production.
6. Palfinger routinely opts to perform major renovations and value-enhancing modifications to equipment and buildings rather than buy new assets. How does Palfinger treat these expenditures? What is the alternative accounting treatment?
This company routinely opts to perform major renovations and value-enhancing modifications to equipment and buildings rather than buy new assets. Therefore,
Palfinger is treating these expenditures by capitalizing the new cost of these improvements while keeping the carrying amount of the old asset on the books to increase the assets useful life. The justification for this approach is that the assets are sufficiently depreciated to reduce its carry amount to almost zero, or as close as it can get to zero. However, another option for Palfinger is to charge the cost to the accumulated depreciation account. This means when the company does not improve the quantity or quality of the asset itself but instead extends its useful life, the company debits the expenditure to “Accumulated depreciation” rather than to an asset account. The theory
behind this approach is that the replacement extends the useful life of the asset and thereby recaptures some or all of the past depreciation. The net carrying amount of the asset is the same whether debiting the asset or accumulated depreciation. A final option for Palfinger is to use the substitution approach. The substitution approach is
advantageous if the carry amount of the old asset is available. Overall this approach simply removes the cost of the old asset and replaces it with the cost of the new asset.
However, if Palfinger cannot determine the carry amount of the old asset, the company must use one of the previous approaches.
7. Use the information in the financial statement notes to analyze the activity in the “Property, plant and equipment” and “Accumulated depreciation and impairment” accounts for 2007. Determine the following amounts:
i. The purchase of new property, plant and equipment in fiscal 2007.
The amount of additions included in the 2007 acquisition cost is €61,444. ii. Government grants for purchases of new property, plant and equipment in 2007. Explain what these grants are and why they are deducted from the property, plant and equipment account.
Government grants are used to fund new property, plant and equipment regarding construction and purchases. These grants are allocated in the
Construction in Progress account over the periods that Palfinger recognizes expenses for the grants intended costs. Once the grant is deducted from the carrying amount of the asset, the amount is recognized over the period of revenue recognition, or the assets expected revenue less related costs. The government grants for purchases of new property, plant, and equipment is a deduction of €733 for 2007.
iii. Depreciation expense for fiscal 2007.
The depreciation expense for the fiscal year is €12,557 for 2007, as found
iv. The net book value of property, plant and equipment that Palfinger disposed of in fiscal 2007.
The net book value of property, plant, and equipment that Palfinger disposed of in the 2007 fiscal year is €12,298. The company should use the total
number found in the Disposals row since there is no cost or accumulated depreciation for the individual assets.
8. The statement of cash flows (not presented) reports that Palfinger received proceeds on the sale of property, plant and equipment amounting to €1,655 in fiscal 2007. Calculate the gain or loss that Palfinger incurred on this transaction.
The statement of cash flows reports that Palfinger received proceeds on the sale of property, plant, and equipment amounting to €1,655 in the fiscal 2007. The revenue
received is then subtracted from the disposal cost of the asset, which was found to be €12,298. The difference of €10,643 is represented as a loss on the disposal of plant assets.
In economic terms, this loss represents the difference between the total revenue received from the sale of the property, plant, and equipment and the total costs, including
opportunity costs, of all the resources used by the firm. An opportunity cost is the value of a trade-off when a decision needs to be made. Economic losses are useful when comparing decisions with multiple variables that will affect profit. In this situation, Palfinger most likely decided that selling the PP&E asset was the best option for the firm when thinking about the asset’s costs.
9. Consider the €10,673 added to “Other plant, fixtures, fittings, and equipment” during fiscal 2007. Assume that these net assets have an expected useful life of five years and a salvage value of €1,273. Prepare a table showing the depreciation expense and net book value of this equipment over its expected life assuming that Palfinger recorded a full year of depreciation in 2007 and the company uses:
i. Straight-line depreciation
The straight-line depreciation for “Other plant, fixtures, fittings, and equipment” during the fiscal 2007 is calculated by taking the net present value of the asset less the estimated salvage value, and then dividing that number by the expected useful life number of years. This depreciation method uses a constant yearly depreciation. The table on the next page shows that the depreciation expense remains the same throughout all years. Please note, while formatting the cells to show currency for the first row of numbers, excel places the Austria currency sign behind the numbers.
Table 5-1: Straight-line Depreciation Table
Year Value of Assets
Depreciation Expense Accumulated Depreciation (End of Year) Book Value (End of Year)
0
10,673
€
0
€
0
€
10,673
€
1
10,673
1,880
1,880
8,793
2
8,793
1,880
3,760
6,913
3
6,913
1,880
5,640
5,033
4
5,033
1,880
7,520
3,153
5
3,153
1,880
9,400
1,273
ii. Double-Declining Balance Depreciation
The double declining method for “Other plant, fixtures, fittings, and
equipment” is quite different than the straight-line method. With this method, first
one must calculate a rate for the depreciation. This rate is calculated by taking one-hundred percent divided by the expected useful life number of years, in this case the number of years will be 5. This number will then be multiplied by 2 due to emphasize that this is the “double” declining method. In this case scenario, the
rate would be 40 percent (calculated as 1 divided by 5, then multiplied by 2). To determine the depreciation expense for each year, multiply the value of the asset each year by the 40 percent rate. Notice at the end of year 5, the ending book value must equal the salvage value. Therefore, the depreciation expense must be adjusted to €110. Again, please note, while formatting the cells to show currency
for the first row of numbers, excel places the Austria currency sign behind the numbers.
Table 5-2: Double Declining Depreciation Table
Year Value of Asset
Depreciation Expense
Accumulated Depreciation (End of Year) Book Value (End of Year)
0
10,673
€
0
€
0
€
10,673
€
1
10,673
4,269
4,269
6,404
2
6,404
2,562
6,831
3,842
3
3,842
1,537
8,368
2,305
4
2,305
922
9,290
1,383
5
1,383
110
9,400
1,273
10. Assume that the equipment from part i. was sold on the first day of fiscal 2008 for proceeds of €7,500. Assume that Palfinger’s accounting policy is to take no depreciation in the year of sale.
i. Calculate any gain or loss on this transaction assuming that the company used straight-line depreciation. What is the total income statement impact of the equipment for the two years that Palfinger owned it? Consider the gain or loss on disposal as well as the total depreciation recorded on the
equipment.
Below, a table was used to calculate the gain or loss found from the sale of equipment. The equipment, from part I, was sold on the first day of fiscal 2008 for proceeds of €7,500. The income statement impact of the equipment for the two
years that Palfinger owned it is that the company will only record depreciation for one year, until putting the gain or loss under other gains and losses on the income statement. Again, please note, while formatting the cells to show currency for the first row of numbers, excel places the Austria currency sign behind the numbers. Table 5-3: Straight-line Depreciation: Gain/Loss on Disposal
Cost of Asset 10,673 €
Less: Depreciation -1,880
Net Book Value 8,793
Less: Cash Received -7,500
Loss on Sale 1,293 €
ii. Calculate any gain or loss on this transaction assuming the company used double-declining-balance depreciation. What is the total income statement impact of this equipment for the two years that Palfinger owned them? Consider the gain or loss on disposal as well as the total depreciation recorded on the equipment.
The income statement impact of the equipment for the two years that Palfinger owned it is that the company will only record depreciation for one year, until putting the gain or loss under other gains and losses on the income
statement. Again, please note, while formatting the cells to show currency for the first row of numbers, excel places the Austria currency sign behind the numbers. Table 5-4: Double Declining Depreciation: Gain/Loss on Disposal
Double Declining Balance Gain on Sale of Asset
Cost of Asset 10,673 €
Less: Depreciation -4,269
Net Book Value 6,404
Less: Cash Received -7,500
Gain on Sale 1,096 €
iii. Compare the total two-year income statement impact of the equipment under the two depreciation policies. Comment on the difference.
The difference between the two-year income statement impact of the equipment under the two depreciation policies is that the straight-line method will be under the “Other revenues and gains” and the double declining balance method
income statement and decreases a company’s net income. Under straight-line
depreciation, the depreciation expense will be lower; however, this method shows a loss on the income statement which will decrease net income. Using the double-declining balance method, the depreciation expense is higher; yet, Palfinger will report a gain on the income statement. Overall, each method affects tax expense, depreciation expense, and net income differently, which is something the
Executive Summary
Volvo Group is a case to inform on research and development costs since the company is constantly looking for innovative automobile ideas. With headquarters in Torslanda, Sweden, Volvo Group supplies commercial vehicles including trucks, buses, construction equipment, engines and drive systems. This company invests roughly 13 billion Swedish Krona in research and development activities to achieve new technical breakthroughs. The company focuses mainly on reducing environmental impact and meeting future emissions and other regulations globally. Volvo Group also employs around 90,000 people around the world with production facilities in 19 countries, and sales activities in roughly 180 countries. Volvo is a company that strives to find modern developments to improve the automobile industry.
Analysis
The Volvo Group taught me about the IFRS and GAAP in a real situation. After researching information about both of these different accounting principles, I now understand more about how each method is used and why it is used for that way. I also learned about how intangible assets are accounted for and how companies determine different ways to amortize these assets. Research and development costs can be very detrimental to a company, so keeping financials accurate and doing impairment test on indefinite intangible assets at appropriate times is a crucial part of businesses. I also enjoyed searching through the financials, determining what numbers to use, and then applying that knowledge by finding proportions of R&D costs incurred. This case gave me an overall better understanding of R&D costs and how to apply them.
1. The 2009 income statement shows research and development expenses of SEK 13,193 (millions of Swedish Krona). What types of costs are likely included in these amounts?
Research and development costs are the innovation and investigation of activities a business conducts to improve existing products and procedures to lead to the
development of new products and procedures. This amount on Volvo’s income statement
most likely includes materials, equipment, and facilities that are currently in use. Some other R&D costs are personnel expenses like salaries and wages, purchased intangibles, contract services that are in connection with the project, and a reasonable allocation of indirect costs. The allocation of indirect costs does not include general and administrative costs unless these costs are clearly related to the R&D project.
2. Volvo Group follows IAS 38—Intangible Assets, to account for its research and development expenditures (see IAS 38 excerpts at the end of this case). As such, the company capitalizes certain R&D costs and expenses others. What factors does Volvo Group consider as it decides which R&D costs to capitalize and which to expense?
To account for its research and development expenditures, Volvo Group follows IAS 38, while capitalizing certain R&D costs and expensing others. Volvo Group mentions in their notes that the acquisition value for intangible assets should be amortized over the estimated useful life of the assets. Next, in order for the development expenditures to be reported as assets, certain criteria must be met as stated in IAS 38. This criteria for the expenditures are to prove the technical functionality of a new product or software before
its development is reported as an asset. In general, expenditures are capitalized only during the development phase of the asset, or intangible assets. Other research and development expenses are charged to income as incurred. If Volvo Group is using IAS 38, the company must follow all criteria rules that IAS 38 requires, which can be difficult to apply in certain case scenarios.
3. The R&D costs that Volvo Group capitalizes each period (labeled Product and software development costs) are amortized in subsequent periods, similar to other capital assets such as property and equipment. Notes to Volvo’s financial statements disclose that capitalized product and software development costs are amortized over three to eight years. What factors would the company consider in determining the amortization period for particular costs?
The research and development costs that Volvo Group capitalizes each period are amortized in subsequent periods, similar to other capital a