HOW DOES COMPETITION IMPACT
BANK RISK-TAKING?
Gabriel Jiménez, Jose A. Lopez
and Jesús Saurina
Documentos de Trabajo
N.º 1005
HOW DOES COMPETITION IMPACT BANK RISK-TAKING?
(*) (**)Gabriel Jiménez
BANCO DE ESPAÑA
Jose A. Lopez
FEDERAL RESERVE BANK OF SAN FRANCISCO
Jesús Saurina
BANCO DE ESPAÑA
(*) The views expressed here are those of the authors and not necessarily those of the Banco de España, the Eurosystem, the Federal Reserve Bank of San Francisco or the Federal Reserve System. We thank John Boyd and Gianni de Nicoló for their many useful comments and suggestions on earlier drafts of this paper. We also thank seminar participants at the International Monetary Fund; the Federal Reserve Board of Governors; the Federal Reserve Bank of Chicago’s 43rd Conference on Bank Structure and Competition; the Bank of Finland-JFS Conference on Financial Instability, Supervision and Central Banks; the Bank of Portugal Conference on Bank Competition, Financial Stability and Regulatory Implications; and the 2008 American Finance Association meeting for very useful comments. In particular, we are indebted to Antonio Antunes, Rima Turk Ariss, Allen Berger, Lamont Black, Arnoud Boot, Mark Carey, Olivier De Jonghe, Robert DeYoung, Enrica Detragiache, Astrid Dick, Mark Flannery, Iftekhar Hasan, Christopher James, Jan Pieter Krahnen, Loretta Mester, Rafael Repullo, Nuno Ribeiro, Vicente Salas, Joao Santos, Miguel Segoviano and Javier Suárez for helpful comments.
(**) E-mail addresses
Documentos de Trabajo. N.º 1005 2010
The Working Paper Series seeks to disseminate original research in economics and finance. All papers have been anonymously refereed. By publishing these papers, the Banco de España aims to contribute to economic analysis and, in particular, to knowledge of the Spanish economy and its international environment.
The opinions and analyses in the Working Paper Series are the responsibility of the authors and, therefore, do not necessarily coincide with those of the Banco de España or the Eurosystem.
The Banco de España disseminates its main reports and most of its publications via the INTERNET at the following website: http://www.bde.es.
Reproduction for educational and non-commercial purposes is permitted provided that the source is acknowledged.
© BANCO DE ESPAÑA, Madrid, 2010 ISSN: 0213-2710 (print)
ISSN: 1579-8666 (on line) Depósito legal: M. 15712-2010
Abstract
A common assumption in the academic literature is that franchise value plays a key role in limiting bank risk-taking. As market power is the primary source of franchise value, reduced competition in banking markets has been seen as promoting banking stability. We test this hypothesis using data for the Spanish banking system. We find that standard measures of market concentration do not affect bank risk-taking. However, we find a negative relationship between market power measured using Lerner indexes based on bank-specific interest rates and bank risk. Our results support the franchise value paradigm.
Keywords: bank competition, franchise value, Lerner index, credit risk, financial stability.
1 Introduction
A common assumption in the academic literature is that excessive competition among banks could threaten the solvency of particular institutions and hamper the stability of the entire banking system at an aggregate level. Competition arising from the liberalization of the banking system should erode the value of a bank’s charter by reducing monopoly rents and encourage it to pursue riskier policies in an attempt to maintain its former profits, as per Keeley (1990). Examples of riskier policies are taking on more credit risk in the loan portfolio, lowering capital levels, or both. These riskier policies should also increase the probability of banks experiencing higher non-performing loan ratios and correspondingly more bank bankruptcies. In contrast, restrained competition should encourage banks to protect their higher franchise values by pursuing safer strategies that contribute to the stability of the whole banking system. This franchise value paradigm has been widely supported both theoretically and empirically in the banking literature.
More recently, Boyd and De Nicoló [BDN (2005)] proposed an interesting and challenging new viewpoint. Within their model, less competition among banks could result in higher interest rates being charged on business loans, which might result in raising the credit risk of borrowers as a result of moral hazard issues [as in Stiglitz and Weiss (1981)]. The increase in firm default risk could lead to higher non-performing loan ratios and greater bank instability. The authors argue that this “loan market channel” could eliminate the trade-off between competition and financial stability implied by the “deposit channel” derived from the franchise value paradigm. Their proposed risk-shifting paradigm argues that increased competition across both the loan and deposit markets could decrease borrower credit risk and enhance financial stability. In fact, Boyd, De Nicoló and Al Jalal (2006) as well as De Nicoló and Loukoianova (2007) provide empirical evidence of a positive relationship between banking market concentration and bank risk-taking.
In this paper, we examine empirically the relationship between bank competition and risk-taking. Specifically, we examine whether the relationship is positive, as suggested by the franchise value paradigm, or negative, as in the BDN model. We also examine whether the relationship is nonlinear, as suggested very recently by Martínez-Miera and Repullo (2008). We conduct our analysis within the Spanish national banking system, which allows us to use the detailed banking databases maintained by the Banco de España, the primary bank regulatory agency in Spain. These data allow us to construct the most appropriate empirical measures used to date in examining this key policy relationship.
We take advantage of the Banco de España’s interest rate database that contains monthly information about the marginal interest rates charged by each bank for several banking products, such as commercial loans and deposits. We use this information to construct Lerner indexes for different banking products as our explanatory variables and direct measures of market power and competition. In addition to these measures of market power, we also examine standard proxies of market concentration, such as Herfindahl-Hirschmann indexes and the number of banks operating in a market as explanatory variables, although these results are not statistically significant in general. We also use the Banco de España’s credit register database to extract banks’ risk premiums from the former marginal interest rates and to obtain banks’ commercial non-performing loan ratios (NPL), which are our main empirical measure of bank risk.
Our empirical results suggest a negative relationship between market power and risk-taking. As bank market power increases (or as competition decreases), bank risk-taking declines. These results do not support the risk-shifting paradigm in the BDN model. Furthermore, we find little evidence of a U-shaped relationship between competition and risk. In summary, our empirical results for the Spanish banking system provide evidence in support of the franchise value paradigm.
The paper is organized as follows. Section 2 contains a brief discussion of the theoretical and empirical literature on the topic. In Section 3, we present our databases, variables and methodology used to empirically examine the trade-off between competition and bank risk. In Sections 4 and 5, we present the baseline results and several robustness exercises, and Section 6 concludes.
2 Literature review
2.1 Theoretical literature
The franchise value paradigm for bank risk-taking, both with and without government regulation, is well established in the banking literature. Simply stated, the idea is that banks limit their risk-taking in order to protect the quasi-monopoly rents granted by their government charters. Increased competition would erode these rents and the value of the charters, which would likely lead to greater bank risk-taking and greater financial instability.
Marcus (1984) used a one-period model to show that franchise value declines as a bank engages in riskier policies. Dermine (1986) extended the Klein-Monti model to incorporate bankruptcy risk and deposit insurance and found a negative relationship between the level of bank credit risk and its deposit market power. Chan, Greenbaum and Thakor (1986) showed that increased competition erodes the surplus that banks can earn by identifying high-quality borrowers. The reduction in value leads banks to reduce their screening of potential borrowers and, thus, overall portfolio credit quality declines. Keeley (1990), following Furlong and Keeley (1989), used a state preference model with two periods to show that a decline in franchise value enhances bank risk-taking. Broecker (1990) showed that increased competition, measured as an increased number of banks, had a negative effect on the average credit-worthiness of the banking system. Besanko and Thakor (1993) showed that increased competition erodes informational rents originated from relationship banking and enhances risk-taking by banks. In a context of asymmetric information, Marquez (2002) showed that an increase in the number of banks in a market disperses the borrower-specific information and will result in higher funding costs for low-quality borrowers but also in a higher access to credit for low-quality borrowers.
Using a dynamic optimization model with an infinite horizon, Suárez (1994) showed a trade-off between market power and solvency. If the market power of the bank decreases, the incentive to engage in riskier policies increases significantly. As the franchise value of the bank is a component of bankruptcy costs, it should encourage the bank to carry out prudent policies that increase the solvency of the bank.1 Matutes and Vives (1996 and 2000) showed
in a framework of imperfect competition (i.e., product differentiation) that higher market power reduces a bank’s default probability. Hellmann, Murdock and Stiglitz (2000) in a dynamic model of moral hazard showed that competition can have a negative impact on prudent bank behavior. Capital requirements are not enough to reduce the gambling incentives and they need to add deposit rate controls as a regulatory instrument. Building on the former paper, Repullo (2004) used a dynamic model of imperfect competition in banking to show that in the absence of regulation, more competition (i.e., lower bank margins) leads to more risk. Risk-based capital requirements were found to effectively control the risk-shifting incentives. Allen and Gale (2000 and 2004) showed that different models can provide different results regarding the trade-off between banking competition and stability.2
As an important challenge to the franchise value paradigm, Boyd and De Nicoló [BDN (2005)] developed a model, modifying one presented by Allen and Gale (2000), where an increase in bank market power both in the loan and deposit markets translates
1. Chan, Greenbaum and Thakor (1986) also consider the franchise value a component of the private cost of bankruptcy.
into higher loan rates charged to borrowers. In a moral hazard environment [as in Stiglitz and Weiss (1981)], entrepreneurs facing higher interest rates on their loans would choose to increase the risk of their investment projects, a practice that would lead to more problem loans and a higher bankruptcy risk for banks. They find a monotonic declining relationship between competition (measured as the number of banks lending in a market) and bank risk; that is, as the number of banks and competition increases, the level of bank risk would decline.
In a recent paper, Martínez-Miera and Repullo [MMR (2008)] propose a way to reconcile the franchise value paradigm and the insights of the BDN model. They show that the former monotonic relationship might become U-shaped if imperfect default correlation across firms were permitted. Under this assumption, the risk-shifting effect (i.e., higher risk of firm failure as loan interest rates increase) has to be balanced against the effect of the higher margins obtained from firms that are able to repay even at the higher interest rates. Depending on the degree of default correlation across firms and the intensity of the risk-shifting effect, it is possible to find an initial decline in risk as the number of banks increases (i.e., as bank competition increases), but an eventual increase in risk as the number of banks operating in a market keeps growing.3
2.2 Empirical literature
The empirical literature that we address in this paper focuses on the relationship between competition in banking markets and bank risk. The extant studies use different measures of bank competition (particularly deposit market competition) and bank risk exposures. Keeley (1990) measured the degree of bank competition using Tobin’s q, which is defined as the ratio of a bank’s equity market valuation to its book value, as a proxy for banks’ market power. First, he showed that liberalization measures eroded Tobin’s q, controlling for macroeconomic variables and bank characteristics. Second, he showed that measures of bank risk were correlated with market power. Bank solvency ratios, defined as the market value of capital divided by the market value of assets, had a positive relationship, such that higher market power was correlated with greater solvency. In addition, bank funding costs via large certificates of deposit had a negative relationship; that is, as market power increased, the perceived bankruptcy risk of large banks decreased and so did the cost of their uninsured deposits. On aggregate, these results support the franchise value paradigm.
Demsetz, Saidenberg and Strahan (1996) showed that U.S. banks with greater market power also have the largest solvency ratios and a lower level of asset risk. Saunders and Wilson (1996), for a sample of U.S. banks and a period of a century, found support for Keeley’s results in the period from 1973 to 1992.4
3. Caminal and Matutes (2002) had already shown that the relationship between market power and bank failures is ambiguous.
For a sample of publicly traded U.S. thrifts, Brewer and Saidenberg (1996) found a negative relationship between franchise value and risk measured as the volatility of their stock prices. Hellmann, Murdock and Stiglitz (2000) expressed the view that Japanese financial-market liberalization in the 1990s increased competition and reduced the profitability and franchise value of domestic banks, which, jointly with other factors, lead to the East Asian financial crisis and a weaker financial system in Japan. Salas and Saurina (2003) replicated Keeley’s work for Spain, finding a very significant and robust relationship between Tobin’s q and the solvency and non-performing loan ratios
4. In fact, Rhoades and Rutz (1982) had already found, using a quite different methodology, that banks with higher market power (measured using a concentration index) were more risk-averse.
of Spanish banks.5
In contrast, Jayaratne and Strahan (1998) showed that bank performance, measured using return on assets, return on equity, and several indicators of credit quality, improved significantly after restrictions on banks’ geographic expansion were lifted in the U.S. Moreover, loan losses decreased sharply after statewide branching was permitted. Thus, an increase in competition seems to have had the opposite effect of the franchise value paradigm. Nevertheless, Dick (2006) provides evidence of a positive and significant relationship between banking deregulation and increases in loan losses. Hannan and Prager (1998) showed that liberalization of interstate branching and operations increased competition in the deposit market and reduced profitability, ceteris paribus. Similarly, Dick and Lehnert (2007) find that interstate banking deregulation led to an increase in the rate of consumer bankruptcy. Moreover, the literature focusing on new bank entrants finds that increases in loan market competition may increase loan losses due to the winner’s curse arising from larger degrees of asymmetric information; see Shaffer (1998).
Greater market power was found to be correlated with higher bank solvency ratios and lower credit risk losses. For Italy, Bofondi and Gobbi (2004) found that a bank’s loan default rate increases as the number of banks in a market increases.
In the above-mentioned studies, differences in the degree of bank competition were either cross-sectional or caused by key changes in regulation within one country. Several other studies have examined this relationship in a cross-country setting. Beck, Demirgüç-Kunt and Levine (2006) examine banking data for 69 countries over a 20 year period, and they found that more concentrated national banking systems are subject to a lower probability of systemic banking crisis and hence are more stable. However, they cast doubts on the appropriateness of the share of assets of the three largest banks in the banking system of each country (i.e., their C3 measure) and related measures as proxies for competitiveness in a national banking system. Claessens and Laeven (2004) showed a positive and significant relationship between bank concentration, proxied using the C5 measure and the H-statistic, and a measure of the intensity of competition in a market according to Panzar and Rosse (1987). Robustness analyses of this result showed that the relationship between concentration and the H-statistic could also be insignificant, and they concluded that bank concentration is not a good summary of the bank competitive environment.6
Overall, there seems to be a significant amount of literature supporting the franchise value paradigm. In contrast, Boyd, De Nicoló and Al Jalal (2006) provided cross-country empirical evidence supporting the risk-shifting model using several measures of bank risk —namely a z-score based on bank returns on assets (ROA), its dispersion measured as σ(ROA), and the ratio of equity to total assets — and bank competition measured using a Herfindahl-Hirschmann index (HHI). They examined two data samples: a cross section of around 2,500 small, rural banks operating in only one market area within the U.S. and a panel of about 2,700 banks from 134 countries, excluding Western countries. In both samples, they found a negative and significant
Also using the H-statistic as the measure of competitiveness, Levy-Yeyati and Micco (2007) found an increase in bank risk as bank competition increased in eight Latin American countries.
5. The paper contains a detailed overview of regulatory changes in Spain during the last three decades as well as some description of the institutional setting. In particular, Spain has a pre-funded deposit insurance system based on flat rates on deposits, which is independent of bank risk level. The analysis presented here differs markedly both in terms of the variables and methodology used.
relationship between their z-score and the HHI; thus, more concentrated banking markets are associated with greater risk of bank failures. Moreover, De Nicoló and Loukoianova (2007) found that this result is stronger when bank ownership is taken into account. Also in a cross-country setting, Schaeck, Čihák and Wolfe (2006) found that more competitive national banking systems are less prone to systemic crises based on their analysis of 38 countries over the period from 1980 to 2003 again using the H statistic.
In a recent paper, Berger, Klapper and Turk-Ariss (2008) find an interesting set of results based upon both loan risk and overall bank risk. Using cross-sectional data on 29 developed countries for the years 1999 through 2005, they find that banks with a higher degree of market power exhibit significantly more loan portfolio risk, but they also have lower overall risk exposure mainly due to their higher equity capital levels. Their results for 60 developing countries are mixed, which they suggest is due to the smaller number of observations available.
3 Data and model description
3.1 Data
In this paper, we use precise measures of bank market power and risk-taking to test whether the franchise value paradigm, the risk-shifting paradigm, or both apply to the Spanish banking system. Our dependent variable measure of risk-taking is a bank’s commercial non-performing loan (NPL) ratio, which is an ex-post measure of credit risk.7 It includes
doubtful loans plus loans more than 90 days overdue. We focus on commercial credit risk for two reasons. First, the BDN and MMR models are based importantly on the borrowing behavior of commercial firms, and second, credit risk is the primary driver of risk for most banks, although other risks exist. The NPL ratios for Spanish banks are obtained from the credit register maintained by the Banco de España, which is known as the Central de Información de Riesgos (CIR). The CIR contains information on any loan, including mortgages and consumer loans, above a minimum threshold of €6,000 granted by any bank operating in Spain. Therefore, it contains a full census of commercial loans granted in Spain. We have monthly information starting in 1984, but for practical reasons, we use only annual data from the month of December without loss of generality.8
As discussed previously, various measures of the degree of bank competition have been used in the banking literature. While many papers have used concentration measures as proxies for bank competition, we share the concern expressed by Claessens and Laeven (2004) regarding the meaning of these concentration variables. For our paper, we take advantage of another database maintained by the Banco de España that records the
marginal interest rate each bank charges on an array of banking products — credit lines, credit granted against invoices or other payment documents (i.e., receivables), mortgages, deposits, etc. — each month over the period from 1988 through 2003. That is, for each bank and each banking product, we have the average interest rate set on that product for
new transactions.9
The Lerner index is a commonly used measure of market power that captures the degree to which a firm can increase their marginal price beyond their marginal cost. It is considered to be a more accurate measure of market power than more commonly used concentration measures.
Using this interest rate information, we can produce a Lerner index for commercial loan products for each bank in our sample.
10 The computation of the Lerner index requires a proper estimation
of the marginal cost of the product, which for bank loans requires a measure of the risk premium charged. Failure to take the risk premium into account would result in significant biases in measuring bank market power.11
7. In the robustness section, we also use dispersion measures of credit risk, with no change in the results.
If the interest rate on a loan is denoted as R1, the Lerner index (or gross profit margin relative to the market price) is defined as (R1 – R)/R1, where R is the marginal cost to the bank of acquiring the funds for the loan. If we introduce the realistic assumption that the marginal operating costs of loans and deposits are either fixed in the very short term or impossible to calculate separately, we assume that banks have
8. A more detailed description of the CIR database can be found in Jiménez and Saurina (2004) and Jiménez, Salas and Saurina (2006).
9. A more detailed description of this database can be found in Martín, Salas and Saurina (2007).
10. Under conventional assumptions, Tirole (1988) shows that the Lerner index can be related to measures of welfare losses such as Harberger’s (1964) triangle. In a recent paper, Carbó-Valverde, Rodríguez-Fernández and Udell (2008) also use the Lerner index to test the impact of market power on SME lending constraints.
a lower bound on the marginal cost for their loans equal to the interest rate offered in the interbank market.12
However, banks must introduce a risk premium into their prices to account for credit risk. Let PD be the probability that a loan, with a normalized face value of one, will default over a specified horizon, and let LGD be the amount of the loan’s value that the bank cannot collect in case of default. If the interbank interest rate r is assumed to be risk-free, the marginal opportunity cost of the loan for a risk-neutral bank will be the interest rate R that satisfies the condition that the risk-free value of the loan equals the expected value of the loan, given the PD and LGD parameters. From this simple identity, the marginal cost R= (r+PD∙LGD)/(1-PD∙LGD) can be derived. For our calculations, the risk-free interest rate r is the annual average of the daily interbank rate. The bank-specific, not borrower-specific, PD is obtained directly from the CIR; for a given bank and loan product at the end of year t, PD equals the bank’s ratio of defaulted loans divided by total outstanding loans of that type. Since we do not have bank-specific information regarding
LGD, we use the value 45% set by the Basel Committee of Banking Supervisors in its new capital framework.13
For our analysis, we calculate Lerner indexes for commercial banking receivables and credit lines as well as all loans, including mortgages and consumer loans. We also compute Lerner indexes for deposits by assuming separability between loan and deposit pricing and that the interbank rate acts as upper bound for deposit rates. The Lerner index for deposits is calculated as (r-Rd)/r, where Rd is the bank’s offered rate on deposits. We also
calculate an average Lerner index for loans and deposits together in order to consider the possibility that loan and deposit markets cannot be separated. In addition to these more accurate measures of market power, we also examine standard concentration variables —C5, HHI and the number of banks operating in each market — as proxies for market power. Note that the last variable is the one used explicitly in the BDN and MMR models.
Given that our dependent variable is the level of credit risk at each bank and that the Spanish credit market is segmented geographically into 50 provinces, the concentration measures reflect the degree of concentration each bank faces in each of the regional markets where it operates. We construct an aggregate measure for each bank using a weighted average, where the weights are the market share of commercial loans each bank holds in each province. If a bank only operates in a province, it faces the concentration indicators of that province; whereas if a bank operates nationwide, it has a nationwide weighted index for each of the concentration measures.14 Again, the concentration variables refer to the
commercial loan market to be consistent with our other risk and competition measures and to test the risk-shifting paradigm. Finally, in our analysis, we also use a database on banks’ accounting data to control for individual bank characteristics, such as return on assets (ROA). We focus on commercial and savings banks, 95% of the credit market to firms.15
12. Freixas and Rochet (1997) review bank pricing models in different competitive regimes and information conditions.
13. We conduct these calculations in order to obtain a measure of bank market power that accounts for the risk premiums included in bank loan. Concerns regarding the potential endogeneity of our Lerner variables might arise, but we address them directly in the analysis. First, our GMM estimation methods appropriately instrument for this variable. Second, the simple correlation between banks’ product-specific PDs and commercial NPL ratios is rather low in our sample, and third, our analysis is robust across banking products.
14. In the robustness section, we show that this aggregation procedure has no impact on the results of the paper.
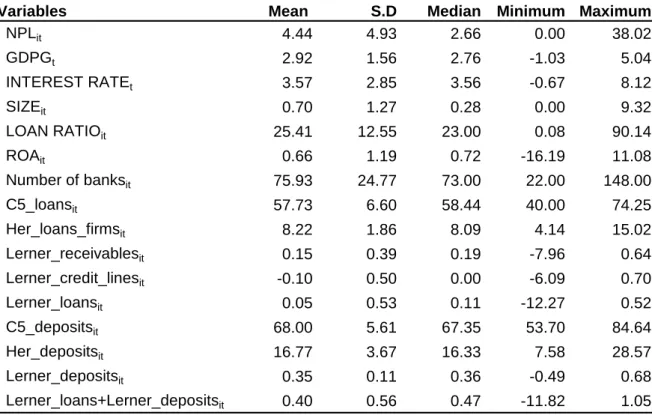
Table 1 presents the descriptive statistics for the variables used. We have 1,262 bank-year observations for more than one hundred commercial and savings banks over the 14-year sample.16
Next, we summarize our various concentration measures as proxies for the degree of bank competition. While there are a reasonably large number of banks operating in each provincial credit market, there is a high degree of dispersion, ranging from provinces with 22 banks to 148 banks in certain years. We do not have more detailed geographical market breakdowns but, in general, it is easy to see a significant correlation between the population of the province and the number of banks operating there. Madrid and Barcelona, by far the most populated provinces, have a much higher number of banks. The correlation coefficient for the logged province population and the log of the number of banks in the province is stable at 0.88 in 1990 and 0.85 in 2000. Across provinces, we observe a variety of patterns regarding the number of banks.
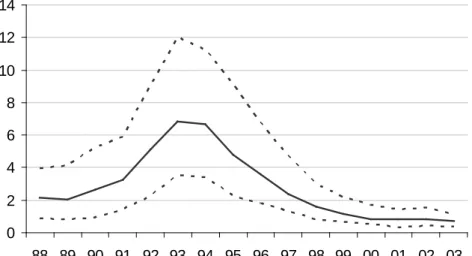
The average NPL ratio is 4.4% with a large degree of dispersion across banks; ranging from 0% to above 38%. As shown in Figure 1, there is significant variation over time in this variable with the median NPL ratio at around 2% at the beginning of the sample period, rising to a median value of 7% in 1993, and falling to around 1% in recent years. These time dynamics are related to the Spanish business cycle, which experienced a deep recession around 1993 and two expansion periods before and after 1993. Real interest rates declined steadily during the period, as the Spanish economy converged to that of the euro zone countries.
For commercial loans, the market share of the first five commercial lenders in each province, denoted as C5, is relatively high with an average of 58%, ranging from 40% to 74%. Across provinces and time, there are occasional jumps in the C5 index as large banks merge. Regarding mergers, we have treated banks merged as two separate entities before the merge and as a new one after it.
The HHI for commercial loans has an average of around 8, which roughly implies 12 banks of equal size per market. Since this number is well below the average number of 76 banks per province, a large number of banks in each market must have a tiny market share with only one or a few branches in the province. This fact further points towards the careful use of the number of banks as a proxy for competition in a market, even though it is the one that comes out of theoretical models. The loan HHI shows no clear cross-sectional pattern across provinces.
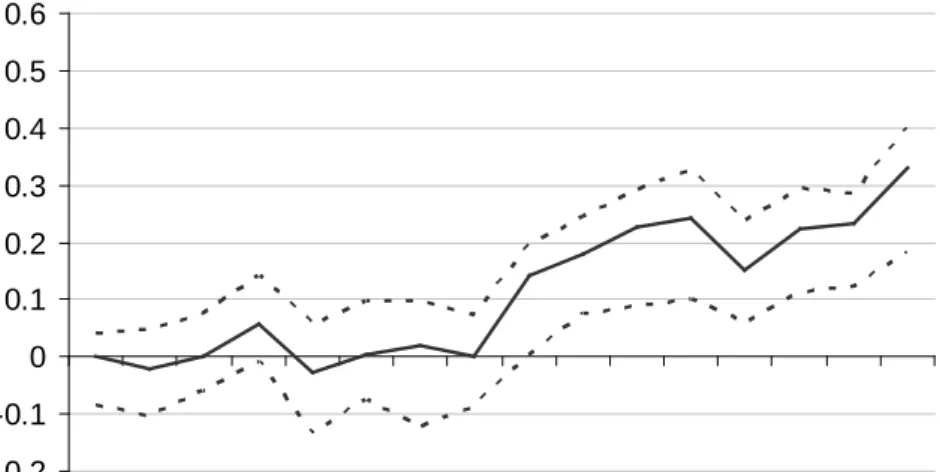
With respect to our Lerner index measures, the average index for receivables is positive, although relatively small; margins on receivables are only about 15% of the rates charged once the risk premium has been accounted for. For credit lines, the index is negative on average and zero at the median, suggesting that the median interest rate on credit lines only covers the funding cost plus the risk premium applied to the borrower. The Lerner index for the whole loan portfolio is on average positive, but again quite small; banks earn only a 5% margin, on average, on all of their lending. As shown in Figure 2A, this Lerner index has an upward trend as of 1995, partly due to a decline in the interbank rate as European monetary unification approached. On the other hand, the Lerner index for all deposits declined during the first half of the sample period and later on fluctuated at 33% of average deposits rates, as shown in Figure 2B. The joint Lerner index for loans and deposits
16. This is the final number of observations used to run the regressions, after taking first differences and allowing for lags in the instruments. The original number of observations was 1,632. The data is uniformly distributed across the entire 16 years of the sample period from 1988 to 2003.
averages about 40% with a maximum value of 100% but with some negative values; in which case, the loan interest rate does not cover the deposit rate and the risk premium.
Table 1 also shows that commercial and savings banks have an average annual ROA of 0.66% for the period analyzed, with a high degree of heterogeneity. In the sample, we measure bank size using the share of total CIR loans that the bank originated. The average value is 0.7%, which is relatively small, but the range goes up to a maximum value of 9.3%; thus, we have also heterogeneity in bank sizes. Finally, there is a significant difference in degrees of specialization in the commercial lending (LOAN RATIO) as some banks concentrate on commercial lending (as high as 90%), while others almost do not operate in that market segment.
3.2 Model description
To examine the various hypotheses regarding the franchise value paradigm, the risk-shifting hypothesis of the BDN model and the encompassing U-shaped relationship in the MMR model, we estimate the general regression:
RISKit = f(COMPETITION INDEXit, BUSINESS CYCLEit, BANK CONTROL VARIABLESit), (1)
where the subscript i refers to a bank and the subscript t refers to a sample year. The model sets the relationship between the specified bank risk measure and the specified bank market competition measure, controlling for bank characteristics and the state of the business cycle. The actual model specification we examine is:
2 it it it 1 1 it 2 it it 1 t 1 2 t 1 1 it 2 it 3 it i it
NPL
NPL
ln
ln
STRUCTURE
STRUCTURE
100 NPL
100 NPL
GDPG
GDPG
ROA +
SIZE
LOAN RATIO
.
− − −
−
= α +β
−
+ δ
+ δ
+ γ
+ γ
+ φ
φ
+ φ
+ η + ε
(2)The dependent bank risk variable is the log-odds transformation of a bank’s NPL ratio. We use this transformation to change the variable’s support from the unit interval to the real number line. There is a significant degree of persistence in the transformed NPL variable, since the average value of the first-order autocorrelation is 0.68. Hence, we include the lagged dependent variable as an explanatory variable.17
We control for business cycle conditions by introducing the current and lagged values of the annual real GDP growth rate, since problem loans develop in line with the business cycle. We also control for the profitability of the bank, its size, and its specialization in commercial lending using its contemporaneous ROA, its market share in terms of CIR total loans (SIZEit), and its percentage of total assets that represent
commercial loans (LOAN RATIOit), respectively.
Our primary variables of interest are related to the structure of the banking market and the degree of bank market competition, denoted STRUCTUREit. For the
loan market, we use the number of banks, C5, HHI as well as our preferred Lerner indexes for receivables, credit lines and all loans. For the deposit market, we use the Lerner index for total deposits, and we also examine the sum of the Lerner indexes for the broadest loan and deposit categories. We include the squared STRUCTUREit term in our regressions to
test whether the relationship between the number of banks and bank risk might not be linear. We include the bank fixed effect ηi to control for unobservable bank characteristics constant
over time, and εit is a random error that has a normal distribution.
In our model specification, positive and significant values for δ1 and δ2 would provide evidence in support of the risk-shifting paradigm; that is, as market power increases (and competition decreases), bank riskiness as measured by NPL ratios would also increase. In contrast, if these parameters are negative and significant, increased market power would lead to less bank risk, which is supportive of the franchise value paradigm. If δ1 is significantly negative and δ2 is significantly positive, the results would support the U-shaped pattern proposed in the MMR model.18
Regarding the other explanatory variables, we expect a significant positive coefficient for the lagged dependent variable and a significant negative effect for the GDPG variables, since problem loans should increase in bad times. We do not have clear expectations for the bank characteristics. In general, there should be a positive, long-term relationship between risk and return, but banks with high NPL ratios might experience significant losses in a particular year. The specialization of a bank should be indicative of improved monitoring and screening of borrowers, but, at the same time, specialized banks might be willing to take more risks. Finally, there is no general support for a certain relationship between the size of the bank and its risk level. A larger bank benefits from risk diversification but, at the same time, bank managers could take advantage of that in order to push further along the risk profile of the bank.19
It is possible that unobservable bank characteristics are correlated with the bank NPL ratios; for example, the risk aversion of bank managers and/or shareholders. In this case, an OLS estimation of model (2) would produce biased parameters due to the lagged dependent variable. To address these estimation problems, we use the Arellano and Bond (1991) procedure and estimate the model in first-difference from using GMM estimation techniques. We thus treat bank characteristics as endogenous and use their second lag to instrument for them. We also consider the concentration and market power measures as potentially endogenous and instrument for them with the second lag. The validity of these instruments is tested using the standard Hansen test. Since we take first differences, we should observe first-order autocorrelation and no second-order autocorrelation in the residuals.20
18. We also estimated the regression model without the quadratic term, and the overall results are qualitatively unchanged.
19. See, for instance, Hughes et al. (1996) for this last result.
20. Note that we also estimated the model using just two lags as well as all available lags as instruments, but the overall qualitative results were unchanged.
4 Empirical results
4.1 Correlations
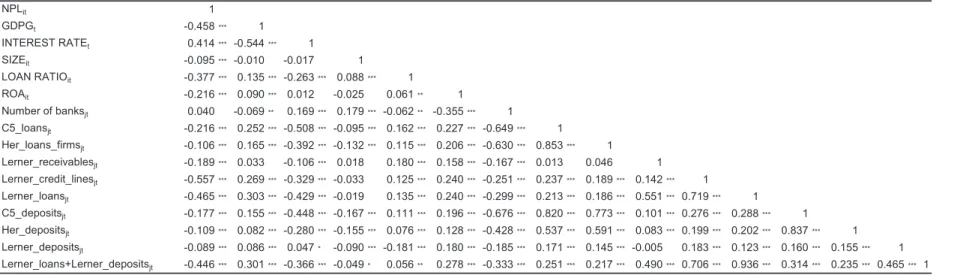
Table 2 presents the pairwise correlations between the variables. We find a negative relationship between all our measures of bank market power and bank’s commercial NPL ratios, our measure of bank risk. The correlations for the different loan market Lerner indexes range from -0.56 to -0.20, and the correlation for the deposit market Lerner index is -0.09. Both the C5 and HHI measures for both markets show a negative, although low correlation, with ex-post credit risk. Therefore, simple correlation analysis suggests a negative relationship between market power and bank risk, supporting the franchise value paradigm.
As expected, commercial NPL ratios are correlated negatively with the business cycle. Specialization in commercial lending is correlated with lower NPL ratios, probably due to enhanced screening and monitoring of borrowers. We find that current problem loans have a negative impact on current profitability. The correlation between size of the bank and risk in business loans seems weak. Bank profitability seems to be inversely related to the number of banks operating in each local market and positively related to the standard concentration measures as well as market power indicators. However, the absolute value of correlation coefficients is, in general, low and in the range of [0.16, 0.24] for loans and is 0.18 for deposits. The correlation with the number of banks is actually -0.36.
With the data available for this study, we can examine in greater empirical detail the key theoretical concept on bank market concentration proposed by Boyd and De Nicoló (2005); namely, the distinction between concentration in the deposit and the loan markets. Among concentration measures, there is a strong negative correlation between the number of banks operating in a market and the C5 and HHI measures for both loan and deposit markets, ranging from -0.67 to -0.42. The C5 and HHI measures for both markets are highly correlated (around 0.85) with each other. Across the two markets, the correlations based on these concentration measures are also high at +0.82 for the C5 measure and +0.59 for the HHI measure. Therefore, C5 and HHI seem to be interchangeable as concentration proxies.
However, a very different picture emerges for the Lerner measures of market power. Within markets, the correlations between the Lerner measures and the two concentration measures drop sharply to between +0.15 and +0.21. The correlation between concentration and market power variables is positive, but generally weak. A proper test of the franchise value paradigm needs, therefore, a more direct measure of market power than the usual concentration proxies used in the literature. Across the markets, the correlations between the Lerner indexes are quite low at +0.12, suggesting that loan and deposit markets might behave separately.
Finally, it should be noticed that, in general, market power is procyclical; that is, macroeconomic improvements seem to increase market power in the Spanish market. Concentration measures are also positively correlated with the business cycle indicator, but with low values.
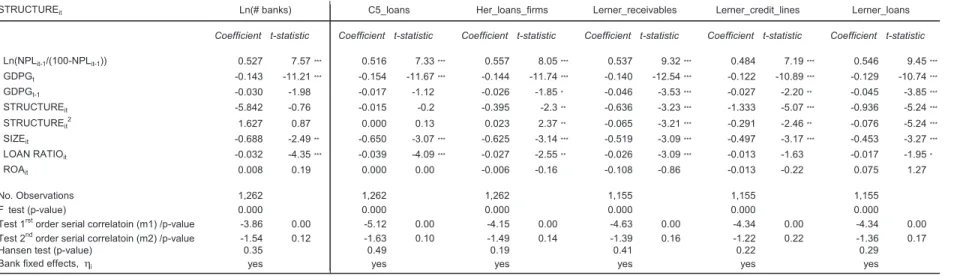
4.2 Regression results
Table 3 presents the estimation results for our baseline model. The table’s six columns differ only by the market structure measure used. The validity of the instruments for our specification is satisfactory in all cases, as shown by the Hansen test. Moreover, as expected since we estimate the model in first differences, there is significant first-order serial autocorrelation in the residuals, but no significant second-order autocorrelation.
In all six regressions, the lagged endogenous variable is significant at the 1% level with a parameter value around 0.5, confirming the persistence shown in the NPL ratios. The contemporaneous GDP growth rate is negative and significant at the 1% level, while the lagged GDP growth rate is always negative but only significant in the last four columns based on the Herfindahl and Lerner measures. The parameters for these lagged variables are, in absolute terms, always less than half of the contemporaneous ones, indicating that business cycle changes quickly influence firms’ problem loans.
For the bank characteristics, larger banks have lower NPL ratios in all six regressions. Thus, it seems that portfolio diversification and possibly better managerial ability at larger banks play a role in mitigating credit risk within Spain. We find that the more specialized a bank is in commercial lending, the lower its problem loan ratio in that sector. This result is statistically significant for the first, second and fourth regressions at the 1% level, significant at 5% level for the third one, significant only at the 10% level for the sixth, and insignificant for the fifth. These results suggest that specialization improves the screening and monitoring abilities of banks. Finally, ROA as a measure of bank profitability is insignificant in the six regressions.
Regarding the structure variables, the first column of Table 3 shows that the number of banks operating in a market does not seem to have any effect on bank risk-taking. Therefore, the strict risk-shifting propositions are not confirmed by the data.21
More interesting are the last three columns based on the Lerner market power measures. The δ1 and δ2 estimates are both negative and significant at the 1% level in all
cases. An increase in market power for loans, measured as an increase in the Lerner indexes for receivables, credit lines and total loans, produces a decline in the risk profiles of the banks in our sample. Thus, we find strong empirical evidence supporting the franchise value paradigm. Furthermore, since both coefficients are negative, we are also able to reject the U-shaped relationship between risk and competition.
We have claimed that concentration measures are rough proxies for market power, and the results for the C5 measure support this claim. Column 2 shows that the C5 concentration measure for commercial loans has no significant impact on NPL ratios. On the other hand, the linear term of the HHI measure for loans is negative while the quadratic term is positive, being both significant at the 5% level. In fact, this U-shaped pattern suggests that an increase in concentration brings about a decline in credit risk, which is in line with the franchise value paradigm, but only up to a certain point. After this threshold, the higher the concentration, the higher the credit risk observed, which is in line with the Boyd and De Nicoló paradigm.
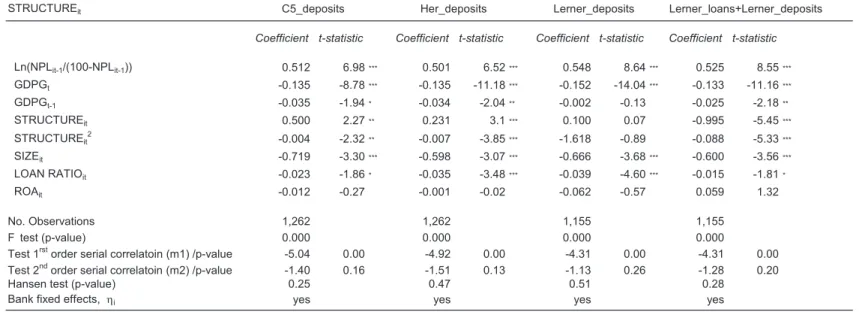
What if the source of market power does not come from the asset side (i.e., loan markets) but from the liability side (i.e., deposit markets)? It might be that banks earn monopoly rents in the deposit market and that has a different impact on the loan market.
21. Proposition 2 in Boyd and De Nicoló (2005) states that, in a symmetric interior Nash equilibrium, the equilibrium level of risk-shifting is strictly decreasing in the number of banks.
For instance, more market power in deposits could allow banks to be more aggressive in the loan market and be prepared to lend to riskier borrowers with the short term objective of increasing market share or total assets. Table 4 presents our empirical analysis of these issues using our baseline specification, but with deposit market structure measures. The regression results in the first two columns show that the relationship is not linear. For low values of these measures, increases in concentration cause an increase in NPL ratios, but beyond an inflection point situated at roughly a C5 value of 62.6% and an HHI value of 16.9, increases in concentration are correlated negatively with NPL ratios. These calculated inflection points are situated at the 15th percentile for the C5 measure and at the 57th
percentile for the HHI measure. In a sense, these results suggest that the franchise value paradigm is not rejected 85% and 43% of the time, respectively, by these deposit market concentration measures.
The third column of Table 4 presents the Lerner index results. Market power in deposits is uncorrelated with risk. The last column in Table 4 shows clear evidence in favor of the franchise value paradigm as more market power, coming either from the loan or deposit markets, leads to less bank risk-taking. That is, even if the hypothesis of separability of loans and deposits does not hold, the franchise value paradigm holds.
Overall, we find evidence supporting the franchise value paradigm in that market power in loan markets (and less strongly in deposit markets) leads to less bank risk-taking. Concentration in the loan or deposit market has a different impact on problem loans depending on its level.
5 Robustness analysis
In this section, we present the results of five robustness tests.22
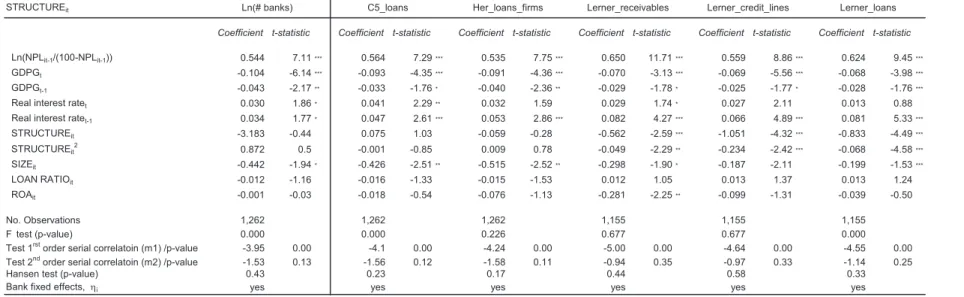
Table 5 shows the results after including the current and the lagged level of real interest rates as an additional control variable. The new variables are positive and significant in almost all the cases. The GDP growth rate variable is still negative and significant although its absolute value has declined, in particular, for the contemporaneous period. These results suggest that real interest rates are important macroeconomic determinants of NPL ratios, but they do not displace the standard business cycle indicator. Bank characteristics are now less significant, and the results do not change much overall. Regarding the main variables of interest, the concentration measures of the number of banks and the C5 index are again found not to be significant, while the HHI linear and quadratic parameters are now insignificant. The last three columns show negative and very significant parameters for the three loan market Lerner indexes. Therefore, we find again a positive relationship between market power and the solvency of Spanish banks as measured by NPL ratios. Furthermore, the MMR conjecture is now rejected because the coefficients on HHI are insignificant. Finally, if our macroeconomic effects are substituted by time dummies, the overall qualitative nature of our results does not change.
The first examines the concern that the overall level of interest rates, a key determinant of funding costs, doesn´t follow the business cycle perfectly. To address this concern, we include an annual average of the one day interbank interest rate in the regression.
The second robustness test addresses the concern that other controls for bank characteristics are needed to capture the firm-specific variation in the data. If we add a solvency ratio (calculated as equity over total assets) to the baseline model, we find that it is not statistically significant. The sign and significance levels of the other variables do not change. This result suggests that the variables we used are probably sufficient for our analysis. We also address the specification of bank size by using an alternative measure based on the logged total assets. We find similar results for our concentration and market power variables, but the other bank control variables are no longer significant.
For the third set of robustness tests, we take advantage of the level of detail in the interest rate database. We estimated our baseline model separately for the ratio of non-performing loans in receivables and in credit lines.23
We also used the data set to examine the impact of the risk premium component of the Lerner indexes for commercial loan products. Specifically, we substituted the banks’ overall PD measure (including mortgages and consumer loans as well as commercial loans) Similarly, we construct all of the competition variables based just on the separate product lines. The results are very similar to those for the prior aggregated estimation. The market concentration measures are never significant at the 10% level. The parameters on the Lerner index based just on receivables are both negative and significant at the 1% level, while only the linear term for the Lerner index based on credit lines is negative and very significant. Therefore, even if we focus on the two main segments of corporate lending separately, we find strong support for the franchise value paradigm.
22. Results not shown here are available upon request.
into the product-line Lerner indexes instead of their product-line PDs. This approach should further mitigate concerns the potential endogeneity of the Lerner measures.24
In the fourth set of robustness tests, we examined alternative weighting schemes to our weighted averages across all provinces for our competition measures. For example, we excluded national banks with a presence in all provinces in order to focus more closely on local bank competition. The empirical results remain similar to those presented in Tables 3 and 4. Similarly, if we remove banks that operate in half (i.e., 25) of the provinces and if we focus only on those banks that operate in less than 5 provinces (i.e., truly local banks), all the results regarding the relationship between market power and risk measures remain intact even though the number of observations declines significantly.
Again, we find similar qualitative results as in Table 3.
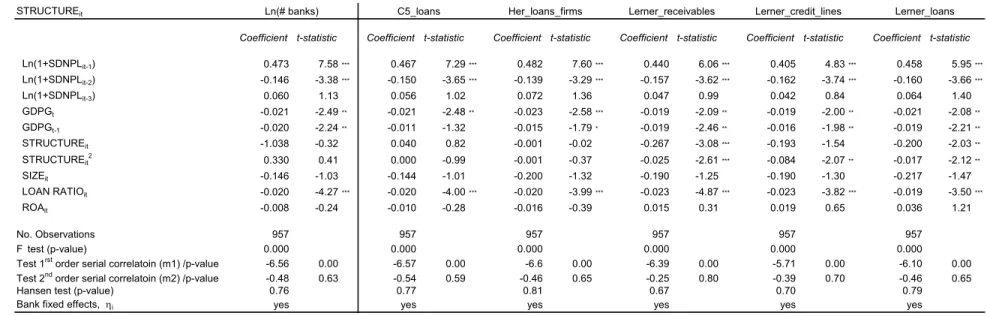
Finally, we analyzed the consistence of our results with a related measure of bank risk. The non-performing loan ratio can be viewed as a proxy for bank expected losses, since it encompasses loans that have shown signs of worsening. Since expected losses are an average measure of bank risk that cannot capture unexpected losses, we used the standard deviation of a bank’s quarterly NPL ratios for the last two years as a proxy for the volatility of a bank’s credit losses. Table 6 shows the results of the GMM estimation of the baseline model for the loan market when the explanatory variable is the log of this NPL standard deviation, denoted SDNPLit-1. The results are in line with those previously reported. All the measures of
concentration are insignificant while both the linear and the quadratic term of the Lerner index are negative and significant, supporting the franchise value paradigm. None of the market structure covariates for the deposit market are significant, but the Lerner index of loan plus deposits is negative and statistically significant.
Another proxy for the risk of a bank that has been used in the literature is a market-value-based indicator such as the z-score or a measure of the volatility of banks’ share prices. However, quoted banks are a minority in our sample given that savings banks are not public companies and some commercial banks are not quoted either. In any case, the bank risk profile is very well measured by credit losses or their volatility, as credit risk is the most important risk a bank has to cope with.25
Overall, our baseline results seem reasonably robust to various changes in the specification of the variables. Therefore, we have found robust support for the franchise value paradigm in contrast to other models that allow for greater bank competition to lead to less bank risk and more financial stability. At least for Spanish banks during a period of 14 years, there is clear evidence of a negative trade-off between bank competition and stability.
24. For example, the simple correlation between NPL ratios for commercial loans and the PD of mortgage loans is 0.11, as compared to 0.37 for the PD of total loans. Moreover, endogeneity concerns between NPL and the Lerner indexes are properly addressed through the GMM estimation procedure.
25. While BDN and MMR argue that bank risk can be measured by an accounting z-score (i.e. based on accounting data instead of on market value data), it is dominated by the leverage ratio (equity over total assets) that does not contain a direct measure of risk; i.e., neither risk weighted assets nor the market value of the bank.
6 Conclusions
In the academic literature the dominant paradigm is that franchise value plays a key role in limiting the riskiness of individual banks and hence of banking systems more broadly. That is, bank management and shareholders will typically limit or reduce their risk exposure to preserve the bank’s franchise value. The underlying source of franchise value is typically assumed to be market power, and reduced competition (or, equivalently, market concentration) has been considered to promote banking stability.
Boyd and De Nicoló [BDN (2005)] challenge the traditional view through what we call the risk-shifting paradigm. They argue that market concentration could impact bank stability in different ways, depending on the net effect across deposit and loan markets. Specifically, the authors suggest that concentration in the loan market could lead to increased lending rates that both raise the borrowers’ debt loads and default probabilities as well as their incentive to engage in riskier projects via moral hazard. More recently, Martínez-Miera and Repullo [MMR (2008)] extend the BDN model to allow for a U-shaped relationship between competition and bank risk-taking, such that both the franchise value and risk-shifting paradigms could be possible.
Using unique datasets covering the Spanish banking system, we explicitly examine the relationship between bank competition and risk. Our dependent variable is a bank’s ratio of non-performing commercial loans (NPL). After controlling for macroeconomic conditions and bank characteristics, we examine the impact of various measures of competition in both the loan and deposit markets. We find that the number of banks has little effect on NPL ratios. Other concentration measures, such as the C5 and HHI indexes for loan and deposit markets separately and together, also do not affect bank NPL ratios.
These measures of market concentration are typically used as a proxy for measures of market power. For the Spanish banking system, we are able to construct market power measures based on Lerner indexes using bank-specific marginal interest rates on a variety of banking products. Our empirical results show that Lerner measures of loan market power have a negative relationship with bank risk; that is, as market power increases, bank NPL ratios decrease. This result is direct evidence in support of the franchise value paradigm. We obtain the similar, although weaker, results for deposits. Finally, joint loan and deposit Lerner indexes have a negative and very significant impact on banks’ non-performing loan ratios. Our results do not support the existence of the risk-shifting effects permitted in the BDN model. Additionally, our results are robust to using the standard deviation of the NPL ratios for the last eight quarters, as an alternative bank risk measure that better captures unexpected losses.
The main contribution of our paper is to perform a focused and precise test of the relationship between bank competition and bank risk using data for the Spanish banking market. Our empirical results provide clear support for the franchise value paradigm. As competitive pressures decrease, the risk appetite of banks should diminish, which should in turn contribute to reinforcing the overall stability of the banking system. On the other hand, given the impact of competition on efficiency, there is a need to reflect on what the proper trade-off between competition and financial stability should be. Our paper shows that this trade-off exists, something that the recent literature had challenged. We leave for
future research a more comprehensive discussion of the impact on overall welfare of a less stringent degree of competition across banks in order to enhance financial stability.
REFERENCES
ALLEN, F., and D. GALE (2000). Comparing Financial Systems, MIT Press, Cambridge, MA.
— (2004). “Competition and financial stability”, Journal of Money, Credit and Banking, 36, 3, June, part 2, pp. 453-480.
ARELLANO, M., and S. BOND (1991). “Some tests of specification for panel data: Monte Carlo evidence and an application to employment equations”, Review of Economic Studies, 58, pp. 277-297.
BECK, T., A. DEMIRGÜÇ-KUNT and R. LEVINE (2006). “Bank concentration, competition, and crises: first results”,
Journal of Banking and Finance, 30, pp. 1581-1603.
BERGER, A., A. DEMIRGÜÇ-KUNT, R. LEVINE and J. HAUBRICH (2004). “Bank concentration and competition: An evolution in the making”, Journal of Money, Credit and Banking, 36, 3, June, part 2, pp. 433-451.
BERGER, A. N., L. F. KLAPPER and R. TURK-ARISS (2008). “Banking Structures and Financial Stability”, Journal of Financial
Services Research, forthcoming.
BESANKO, D., and A. THAKOR (1993). “Relationship banking, deposit insurance and bank portfolio choice”, in C. Mayer and X. Vives (eds.), Capital markets and financial intermediation, Cambridge University Press.
BOFONDI, M., and G. GOBBI (2004). Bad loans and entry into local credit markets, Temi di Discussione del Servizio Studi, 509, Bank of Italy.
BOYD, J. H., and G. DE NICOLÓ (2005). “The theory of bank risk taking and competition revisited”, Journal of Finance,
60, pp. 1329-1343.
BOYD, J. H., G. DE NICOLÓ and A. AL JALAL (2006). Bank risk taking and competition revisited: New theory and new
evidence, International Monetary Fund Working Paper 06/297.
BREWER III, E., and M. R. SAIDENBERG (1996). Franchise value, ownership structure, and risk at savings institutions,
Research Paper 9632, Federal Reserve Bank of New York.
BROECKER, T. (1990). “Creditworthiness Tests and Interbank Competition”, Econometrica, 58, pp. 429-452.
CAMINAL, R., and C. MATUTES (2002). “Market power and banking failures”, International Journal of Industrial
Organization, 20, pp. 1341-1361.
CARBÓ-VALVERDE, S., F. RODRÍGUEZ-FERNÁNDEZ and G. F. UDELL (2008). Bank market power and SME financing
constraints, manuscript.
CARLETTI, E. (2006). “Competition and regulation in banking”, in Handbook of Corporate Finance, Vol. 3, edited by A. Thakor and A. Boot.
CARLETTI, E., and P. HARTMANN (2003). “Competition and Financial Stability. What’s Special about Banking?”, in P. Mizen(ed.) Monetary History, Exchange Rates and Financial Markets: Essays in Honor of Charles Goodhart,
Vol. 2, Edward Elgar, Cheltenham, UK.
CHAN, Y., S. GREENBAUM and A. THAKOR (1986). “Information reusability, competition and bank asset quality”,
Journal of Banking and Finance, 10, pp. 243-253.
CLAESSENS, S., and L. LAEVEN (2004). “What drives bank competition? Some international Evidence”, Journal of
Money, Credit and Banking, 36, 3, June part 2, 563-583.
DE NICOLÓ, G., and E. LOUKOIANOVA (2007). Bank Ownership, Market Structure and Risk, Monetary Fund Working Paper 07/215.
DEMSETZ, R. S., M. R. SAIDENBERG and P. E. STRAHAN (1996). “Banks with something to lose: The disciplinary role of franchise value”, FRBNY Economic Policy Review, October, pp. 1-14.
DERMINE, J. (1986). “Deposit rates, credit rates and bank capital”, Journal of Banking and Finance, 10, pp. 99-114. DICK, A. (2006). “Nationwide branching and its impact on market structure, quality and bank performance”, Journal of
Business, 79, pp. 567-592.
DICK, A., and A. LEHNERT (2007). Personal Bankruptcy and Credit Market Competition, Staff Report 272, Federal Reserve Bank of New York.
FREIXAS, X., and J. C. ROCHET (1997). Microeconomics of Banking, The MIT Press.
FURLONG, F. T., and M. C. KEELEY (1989). “Bank capital regulation and risk taking: A note”, Journal of Banking and
Finance, 13, pp. 883-891.
HANNAN, T. H., and R. A. PRAGER (1998). “The relaxation of entry barriers in the banking industry: An empirical investigation”, Journal of Financial Services Research, 14, pp. 171-188.
HARBERGER A. C. (1964). “The Measurement of Waste”, American Economic Review, 54, 3, pp. 58-76.
HELLMANN, T. F., K. C. MURDOCK and J. E. STIGLITZ (2000). “Liberalization, moral hazard in banking, and prudential regulation: Are capital requirements enough?”, American Economic Review, 90, No. 1, March, pp. 147-165. HUGHES, J. P., W. LANG, L. J. MESTER and C. MOON (1996). “Efficient banking under interstate branching”, Journal of
Money, Credit and Banking, 28, 4, November, pp. 1045-1071.
JAYARATNE, J., and P. E. STRAHAN (1998). “Entry restrictions, industry evolution, and dynamic efficiency: evidence from commercial banking”, Journal of Law and Economics, XLI, April, pp. 239-273.
JIMÉNEZ, G., V. SALAS FUMÁS and J. SAURINA (2006). “Determinants of collateral”, Journal of Financial Economics,
81, pp. 255-281.
JIMÉNEZ, G., and J. SAURINA (2004). “Collateral, type of lender and relationship banking as determinants of credit risk”,
Journal of Banking and Finance, 28, pp. 2191-2212.
KEELEY, M. C. (1990). “Deposit insurance, risk and market power in banking”, American Economic Review, 80, pp. 1183-1200.
LEVY YEYATI, E., and A. MICCO (2007). “Concentration and foreign penetration in Latin American banking sectors: Impact on competition and risk”, Journal of Banking and Finance, 31, pp. 1633-1647.
MARCUS, A. J. (1984). “Deregulation and bank policy”, Journal of Banking and Finance, 8, pp. 557-565.
MARQUEZ, R. (2002). “Competition, adverse selection, and information dispersion in the banking industry”, Review of
Financial Studies, Vol. 15, pp. 901-926.
MARTÍN, A., V. SALAS and J. SAURINA (2006). “Risk premium and market power in credit markets”, Economic Letters, 93, pp. 450-456.
— (2007). “A test of the Law of One Price in retail banking”. Journal of Money, Credit and Banking, Vol. 39, No. 8,
December, pp. 2021-2040.
MARTÍNEZ-MIERA, D., and R. REPULLO (2008). “Does competition reduce the risk of bank failure?, unpublished manuscript, CEMFI.
MATUTES, C., and X. VIVES (1996). “Competition for deposits, fragility, and insurance”, Journal of Financial
Intermediation, 5, pp. 184-216.
— (2000). “Imperfect competition, risk taking, and regulation in banking”, European Economic Review, 44, pp. 1-34.
PANZAR, J. C., and J. N. ROSSE (1987). “Testing for monopoly’ equilibrium”, Journal of Industrial Economics, 35, pp. 443-456.
REPULLO, R. (2004). “Capital requirements, market power, and risk-taking in banking”, Journal of Financial
Intermediation, 13, pp. 156-182.
RHOADES, S. A., and R. D. RUTZ, 1982. “Market power and firm risk. A test of the ‘Quiet Life’ hypothesis”, Journal of
Monetary Economics, 9, pp. 73-85.
SALAS, V., and J. SAURINA (2002). “Credit risk in two institutional regimes: Spanish commercial and savings banks”,
Journal of Financial Services Research, 22, 3, pp. 203-224.
— (2003). “Deregulation, market power and risk behavior in Spanish banks”, European Economic Review, 47, pp. 1061-1075.
SAUNDERS, A., and B. WILSON (1996). Bank capital structure: charter value and diversification effects, Working Paper S-96-52, New York University Salomon Center.
SCHAEK, K., M. ČIHÁK and S. WOLFE (2006). Are More Competitive Banking Systems More Stable?”, IMF Working Paper 06/143.
SHAFFER, S. (1998). “The winner’s curse in banking”, Journal of Financial Intermediation, 7, pp. 359-392.
STIGLITZ, J., and A. WEISS (1981). “Credit rationing with imperfect information”, American Economic Review, 71, pp. 393-410.
SUÁREZ, F. J. (1994). Closure rules, market power and risk-taking in a dynamic model of bank behavior, Discussion Paper 196, LSE, Financial Markets Group.
Figure 1. Time series of the non-performing loan ratio
This figure shows the time evolution of the non-performing loan ratio (%) of the sample of banks used in the study by quartiles (i.e., Q25, Median and Q75). The time period analyzed spans from 1988 to 2003
0
2
4
6
8
10
12
14
88 89 90 91 92 93 94 95 96 97 98 99 00 01 02 03
Figure 2A. Time series of the Lerner index for the whole loan portfolio
This figure shows the time evolution of the Lerner index for the whole loan portfolio of the sample of banks used in the study by quartiles (i.e., Q25, Median and Q75). The time period analyzed spans from 1988 to 2003
Figure 2B. Time series of the Lerner index for all deposits
This figure shows the time evolution of the Lerner index for all deposits of the sample of banks used in the study by quartiles (i.e., Q25, Median and Q75). The time period analyzed spans from 1988 to 2003
-0.2
-0.1
0
0.1
0.2
0.3
0.4
0.5
0.6
88 89 90 91 92 93 94 95 96 97 98 99 00 01 02 03
-0.2
-0.1
0
0.1
0.2
0.3
0.4
0.5
0.6
88 89 90 91 92 93 94 95 96 97 98 99 00 01 02 03
Table 1. Descriptive statistics for bank-year observations
NPLit is the commercial non-performing loan ratio of bank i at time t; GDPGtis the real GDP growth rate of the Spanish economy at time t; INTEREST RATEt is the one-day real interbank interest rate at time t; SIZEit is the market share of bank i at time t in terms of total loans; LOAN RATIOit measures the specialization of firm i at time t in the non-financial sector through the ratio of loans to firms over total loans; ROAit is the return on assets of bank i at time t; Number of banksit is the number of banks that has the representative province for bank i at time t, calculated as the weighted average (by total loans) over all the provinces where the bank grants loans (the other concentration and competition measures are obtained in the same way); C5 denotes the share of the 5 largest banks in the representative province for bank i at time t; Herit is the Herfindahl index of concentration for the representative province of bank i at time t, calculated in each province as the sum of banks’ squared market shares in loans granted in the province; Lernerit is the Lerner index of bank i in year t defined for product l of the asset side as (Rl -R)/ Rl, where R is the credit risk
adjusted marginal cost of product l for bank j granted in year t, while it is defined as (R- Rl)/ R for deposits. The time period analyzed spans from 1988 to 2003. We have
1,632 observations from which, after taking first differences and instrumenting remain 1,262 corresponding to 107 unique banks (commercial and savings banks).
Variables
Mean
S.D
Median
Minimum Maximum
NPL
it4.44
4.93
2.66
0.00
38.02
GDPG
t2.92
1.56
2.76
-1.03
5.04
INTEREST RATE
t3.57
2.85
3.56
-0.67
8.12
SIZE
it0.70
1.27
0.28
0.00
9.32
LOAN RATIO
it25.41
12.55
23.00
0.08
90.14
ROA
it0.66
1.19
0.72
-16.19
11.08
Number of banks
it75.93
24.77
73.00
22.00
148.00
C5_loans
it57.73
6.60
58.44
40.00
74.25
Her_loans_firms
it8.22
1.86
8.09
4.14
15.02
Lerner_receivables
it0.15
0.39
0.19
-7.96
0.64
Lerner_credit_lines
it-0.10
0.50
0.00
-6.09
0.70
Lerner_loans
it0.05
0.53
0.11
-12.27
0.52
C5_deposits
it68.00
5.61
67.35
53.70
84.64
Her_deposits
it16.77
3.67
16.33
7.58
28.57
Lerner_deposits
it0.35
0.11
0.36
-0.49
0.68
Lerner_loans+Lerner_deposits
it0.40
0.56
0.47
-11.82
1.05
BAN C O DE ESPAÑ A 32 DO CUM E N TO D E TR A B A JO N.º 100 5
Table 2. Correlation coefficients
NPLit is the commercial non-performing loan ratio of bank i at time t; GDPGtis the real GDP growth rate of the Spanish economy at time t; INTEREST RATEt is
the one-day real interbank interest rate at time t; SIZEit is the market share of bank i at time t in terms of total loans; LOAN RATIOit measures the specialization of
firm i at time t in the non-financial sector through the ratio of loans to firms over total loans; ROAit is the return on assets of bank i at time t; Number of banksit is
the number of banks that has the representative province for bank i at time t, calculated as the weighted average (by total loans) over all the provinces where the bank grants loans (the other concentration and competition measures are obtained in the same way); C5 denotes the share of the 5 largest banks in the representative province for bank i at time t; Herit is the Herfindahl index of concentration for the representative province of bank i at time t, calculated in each
province as the sum of banks’ squared market shares in loans granted in the province; Lernerit is the Lerner index of bank i in year t defined for product l of the
asset side as (Rl -R)/ Rl, where R is the c redit risk adjusted marginal cost of product l for bank j granted in year t, while it is d efined as (R- Rl)/ Rfor deposits.
***; **; *; significant at the 1%, 5% and 10% levels
Variables NPLit 1 GDPGt -0.458*** 1 INTEREST RATEt 0.414*** -0.544*** 1 SIZEit -0.095*** -0.010 -0.017 1 LOAN RATIOit -0.377*** 0.135*** -0.263*** 0.088*** 1 ROAit -0.216*** 0.090*** 0.012 -0.025 0.061** 1 Number of banksjt 0.040 -0.069** 0.169*** 0.179*** -0.062** -0.355*** 1 C5_loansjt -0.216*** 0.252*** -0.508*** -0.095*** 0.162*** 0.227*** -0.649*** 1 Her_loans_firmsjt -0.106*** 0.165*** -0.392*** -0.132*** 0.115*** 0.206*** -0.630*** 0.853*** 1 Lerner_receivablesjt -0.189*** 0.033 -0.106*** 0.018 0.180*** 0.158*** -0.167*** 0.013 0.046 1 Lerner_credit_linesjt -0.557*** 0.269*** -0.329*** -0.033 0.125*** 0.240*** -0.251*** 0.237*** 0.189*** 0.142*** 1 Lerner_loansjt -0.465*** 0.303*** -0.429*** -0.019 0.135*** 0.240*** -0.299*** 0.213*** 0.186*** 0.551*** 0.719*** 1 C5_depositsjt -0.177*** 0.155*** -0.448*** -0.167*** 0.111*** 0.196*** -0.676*** 0.820*** 0.773*** 0.101*** 0.276*** 0.288*** 1 Her_depositsjt -0.109*** 0.082*** -0.280*** -0.155*** 0.076*** 0.128*** -0.428*** 0.537*** 0.591*** 0.083*** 0.199*** 0.202*** 0.837*** 1 Lerner_depositsjt -0.089*** 0.086*** 0.047* -0.090*** -0.181*** 0.180*** -0.185*** 0.171*** 0.145*** -0.005 0.183*** 0.123*** 0.160*** 0.155*** 1 Lerner_loans+Lerner_depositsjt -0.446*** 0.301*** -