r
WORKING PAPERS
International TradeInternational Economics Department The World Bank
February 1992 WPS 848
How EC 1992 and Reforms of
the Common Agricultural
Policy
Would Affect Developing
Countries' Grain Trade
Merlinda D. Ingco
and
Donald 0. Mitcheli
How stabilizers, price cuts, and the elimination of border taxes
and subsidies would affect EC grain production and developing
countries' grain trade.
Poliey Research Working Papcrs disseminate the findings of siork in progress and encourage the exchange of ideas among Bank staff and all others inter sted tn developnenL issues I hcse papers, distnhuied by uhe Rcsearch Ad isory Stal f,carry the namesoftheauthors,rellect only theirviews.and should bcused and cited accordingly The findings, inicrpretations,and conclusionsaretheauthors'own. Theyshould not he attributed to the Wotld Bank, its Board of Directors, its managment, or any of Its memhbr countnes
Public Disclosure Authorized
Public Disclosure Authorized
Public Disclosure Authorized
Policy Research
International Trade WPS 848
This paper-aproductof the IntemationalTrade Division, Intemational Economics Department- is partof a larger effort in the department to understand how developing countries are affected by policy reforms in the industrial countries. Copies of this paper are available free from the World Bank, 1818 H Street NW, Washington, DC 20433. Please contact Pauline Kokila, room S7-040, extension 33716 (37 pages). February 1992.
The European Community (EC) is a major grain Eliminating MCAs and continuing stabilizers producer, accounting for about 12 percent of world (scenario 1) would slightly increase grain production production in 1989-90. EC grain exports (mainly above baseline as member countries' exchange rate
lower-quality feed wheat) increased significantly over policies adjust. Total EC1O grain production will the last three decades, and grain imports (mainly increase 2 percent a year over baseline in 1995-2000, higher-quality bread wheat) declined. In 1973, the EC but eliminating the CAP and returning to a pre-CAP shifted from being a net importer to being a net growth path for yields (scenario 2) would produce a exporter. Developing countries, on the whole, are decline in grain production -with total ECIO wheat
heavy grain importers. production 27 percent below baseline in 2000.
The EC's Project 1992 will abolish intemal trade Under scenario 1, eliminating MCAs causes a barriers to facilitate the movement-of goods, persons, slight decline in world wheat and coarse grain prices. services, and capital between member coun,ries. One By 2000, real wheat prices fall I percent and com aspect of the program is elimination of border taxes prices 0.62 percent below baseline. Under scenario 2, and subsidies (called MCAs) on agricultural com- prices rise substantially. Wheat prices increase (by modities. Coupled with intemal pressures to red ice o.49 percent) morc 'ihn coarse grain prices (2.18 agricultural budget expenditur , the EC-1992 percent) because retuming to historical yields would program has affected agricultural policy by weaken- reduce wheat production and exports substantially ing the role of the price intervention system. An more than coarse grains.
example was the 1988 adoption of a common Under scenario I, developing countries' net agricultural policy (CAP) reform package called import costs for grains fall slightly and imports rise, "stabilizers" to limit market price supports. in response to lower prices. By 2000, the cost of
Using an econometric model, Ingco and Mitchell grain imports for all developing countries falls show the stabilizers and the elimination of the MCAs US$153 (constant 1985 dollars); Asian and Middle to have a limited effect on world grain prices and Eastefn developing countries save the most. Under trade. The stabilizers depress the ECU intervention scenario 2 the returr to historical yields increases price, but their effect on production is minimal as cuts developing countries' cost for grain imports by an
in nominal ECU intervention prices are partly offset estimated US$906 million (contstant 1985 dollars). by adjustments in green exchange rates when MCAs Exchange rate variations in member countries are eliminated. In general, the new arrangements to have also affected the level of protection of EC remove MCAs involve revaluing the green rates in agriculture. Under current macroeconomic policies, countries with positive MCAs and devaluing them in large price cuts would be necessary to bring produc-countries with negative MCAs. The effect would be a tion in line with demand. Such price cuts are not gradual increase in grain prices in France, Greece, politically feasible, so policies designed to remove Ireland, Italy, and the United Kingdom - more so land and farmers from grain production are likely to than in countries with strong currencies, such as be more important. But land set-aside schemes will Germany and the Netherlands. not significantly affect production without much
Baseline projections indicate that total ECIO higher compensation payments than are now contem-grain production will continue increasing as average plated.
yields increase 2 percent to 2.5 percent a year.
The Policy Research Working Paper Scricsdisseminates the findings of work under way in the Bank. Anobjectiveof the series is to get these findings out quickly, even if presentations are less than fully polished. The findings, interpretations, and ! conclusions in these papers do not necessarily represent official Bank policy.
I. Introduction 1
II. Trends In Grains Trade- EC and Developing Countries 3
Ill. EC Grains Policy Developments and Future Directions 7
IV. Analytical Modiel 17
V. EC Grain Supply Response Estimates 22
VI. Projections of EC Grains Production a,.d Trade, and the
Irnplications for World Grain Prices and Developing
Countries' Grain Trade 26
VII. Concluding Remarks 33
UST OF FGURES AND TABLES
Fiaures
Figure 1 EC Grains Trade ...
3
Figure 2 EC Share of World Grains Trade.
3
Figure 3 EC Wheat Trade ...4
Figure 4 EC Share of World Wheat Trade ...
4
Figure 5 EC Coarse Grains Trade ...
5
Figure 6 EC Share of Coarse Grains Trade ...
5
Figure 7 Belgium-Luxembourg .
11
Figure 8 Denmark ... ...11
Figure 9 France ... ..
11
Figure 10 Ireland ... 11
Figure 11 Italy ... 11
Figure 12 United Kingdom ...
11
Figure 13 Germany ... - 12
Figure 14 Netherlands ... 12
Figure 15 Greece ... 12
Figures 16a & 16b Stabilizer Mechanism .. ... 20
Figure 17 Wheat Yields ... 28
Figure 18 EC-10 Wheat Production ... 29
Tables Table I Net Grain Imports of Developing Countries ...
6
Table 11 Price Effects of MCA Elimination ... 15
Table III 1990/91 Agrimonetary Proposals ... 16
Table IV Price Transmission Elasticities ... 22
Table V EC Short-Run Area Response ... 23
Table VI Yield Response ... 24
Table VII EC 1992 Policy Simulations ... 27
Table Vill Simulation Results ... 31
Table IX Changes in Developing Country Net Grain Import Costs .... ... 32
Annex Tables Annex Table 1 Baseline Projections of EC-10 Wheat Production .... ... 36
by Country Annex Table 2 Baseline Projections of EC-10 Coarse Grains ... 37
1.1 The high levels of protection provided by the European Community's (ECV1 Common Agricultural Pelicy (CAP) has transformed tihe structure of EC agriculture. The level and form of support has encouraged excess production and large exportable surpluses. The position of the EC in the world grains markets has shifted from being the world's largest net importing region to that of a major net
exporter since the mid-1 970s.2
1.2 In recent years, the economic and political environment for agricultural policy making in the EC
has changed and a somewhat restrictive price support policy as well as penalties on overproduction
have been adopted.3 Several factors are influencing these changes, but the major driving force for
CAP reform is the internal pressure to reduce agricultural budget expenditures (Hecrichsmeyer, 1990).
In addition, the EC's program for economic integration by 1992 (so called EC-1 992) has also influenced
agricultural policy.4
While a significant reform of the CAP is not likely in the near term, internal and international pressures will require the EC to continue to make adjustments in both the method and level of protection to producers. These policy changes are regarded as important in easing the transition to a barrier-free market by the end of 1992. The completion of a barrier-free market by 1992
was stipulated in the Single European Act, which amended the Treaty of Rome and was ratified by all
members in 1987. Article 8A of the act states that:
The Community shall adopt measures with the aim of progressively establishing the internal market over a period expiring on 31
December 1992... .The internal market shall comprise an area without internal frontiers in which the free movement of goods, persons, services, and capital is ensured in accordance with the provisions of the Treaty.
This paper considers only the EC 10 countries and excludes Spain and Portugal since they are
not yet fully integrated in the CAP. The European Community was formed by the Treaty of Rome on
Mav. S ?5, 1957. It began with six members, namely, Belgium, France, Italy, Luxembourg,
Netd -.nds, and West Germany. In 1973, the EC expanded to nine countries, with Denmark, Ireland,
and u United Kingdom as members. In 1981, Greece joined while Spain and Portugal became
members in 1986.
2 The EC10 shifted from net imports of about 21 million tons of grains in 1960/61 to net exports
of 23 million tons of grains annually during 1 986-89.
3 Recent reforms in the CAP are discussed in Jostling, T., "Europe 1992: CAP Reform and World
Agricultural Trade" and in Henrichsmeyer, W., CAP Reform and 1992: A German Perspective" both in EC 1992 Persvectives On Agriculture, Gardiner and Kelch, editors, U.S. Department of Agriculture Staff Report No. AGES 9043.
4 The political pressure to keep the 1992 agenda on track was a major factor leading to the
adoption of the February 1988 CAP reform package, called "stabilizers." These stabilizers seek to limit price supports to producers and the cost of agricultural programs automatically, reducing agricultural price supports in response to excess production. For a discussion of events shaping the 1 992 Internal Market Program, see Jostling, 1990; Henrichsmeyer, 1990, and Leon Y. and L. Mahe, 1990.
2
1.Z, While there is doubt that the EC can achieve this goal by the end of 1992, the internal market
program is being used effectively as rationale and vehicle for reform in many sectors, incluing agriculture. An aspect of the program which has significance for agriculture is the elimination of border taxes and subsidies (MCAs) on commodities which result from operations of the EC agrimonetary policy. Since abolishing the MCAs requires reforms in the EC agrimonetary policy, particularly in the system of green rates, this will have implications on domestic prices faced by producers and
consumers. In addition, the EC-1 992 program has affected agricultural policy by weakening the role
of the intervention system through reductions in the guaranteed prices fo. producers.
1.4 The reduction of guaranteed prices or eliminition of agricultural subsidies in the EC would
cause significant changes to the structure of EC agriculture, and would have important implications for world agricultural markets. Since the developing countries are major grain importers, such changes would also have important implications for them. Reductions in EC price supports would lead to large changes in the level and mix of EC agricultural production and trade. Returns to land, labor, capita;, and other inputs would change. Reductions in support prices would also likely reduce fertilizer application rates, and thus yields. Agricultural production more closely reflecting the comparative
advantage of each member country would emerge. The objective of setting uniform farm pric6Q, is
complicated by the existence of different and non-harmonized economic environments among countries
with varying inflation and growth rates.
1.5 This paper seeks to measure the domestic and world market impacts of policy reforms in the
EC. The effects on EC prices, production and trade of dismantling agricultural border taxes and subsidies (Monetary Compensatory Amounts (MCAs), including all MCAs created by exchange rate realignments) are determined. In addition, alternativa scenarios for the reduction of support prices are simulated and the effects on world grain prices and trade for developing countries are estimated.
1.6 Section 2 provides a brief review of trends in EC grain production and trade, and developing
countries trade. A brief summary of recent reforms to the CAP and policy changes in agriculture under
EC-1 992 are discussed in section 3. Section 4 presants the analytical model. Projections of EC grain
production, consumption, and trade under various policy scenarios are discussed in section 5. The effects on world grain production, prices, trade and net import costs for developing countries are also presented in section 5.
II. Trends in Grains Trade: EC and the Develogina Countries EC Grains Trade
2.1 The EC is a major grain producer, accounting for about 12% of world production it, 1989/90.
During the last three decades, EC agricultural production has grown more rapidly than domestic food consumption and, since 1973 EC agricultural exports have increased more rapidly than imports since
1973. This catused the EC to shift from a net importer to a net exporter for several major commodities.
However, a signlificant increase in the EC's imports of animal feedstuffs kept the EC as the world's largest importer of food and agricultural products.
2.2 Total grain exports increased significantly over the last three decades, while grain imports
reversed their up trend (Figure 1). The EC's share of world grain trade exhibited similar trends, with the share of total imports declining rapidly since the mid-1 970s and that of exports steadily increasing
(Figure 2).
EC GRAINS TRADE EC SHARE OF WORLD GRAINS TRADE
s55 A TIs~~~~~~~~- I
122-
'0 iT 40 sooTS£POT 40 25 -20 gt MIS -i960 1964 1968 1972 1976 1990 1984 1988 1960 t 964 1969 1972 1976 1990 194 a 9 88 Figure 1 Figure 22.3 The grow h of net wheat exports was particularly rapid (Figure 3), and the share of world
wheat net exports increased from 6% to 17% between the mid-1970s and 1987/88 (Figure 4). In 1990/91, the region was the world's third largest exporter and producer of wheat, accounting for 22% of world exports and about 14.5% of production. The EC is also a major importer of wheat. The EC typica,ly produces lower quality feed wheat and imports higher quality bread wheat for blending. Prior to 1971, imports gonerally exceeded exports. Since then the reverse has been true, and since 1977 exports exceeded imports by an increasing margin.
4
2.4 Wheat is produced in all EC countries. Four countries, namely, France, West Germany, Italy,
and the United Kingdom produce over 75% of the wheat. France is the largest wheat producer in the EC, with about 35-40% of output in recent years. Area planted to wheat in France is about 35% of EC total wheat area and average yields generally exceed those of otner members by a production share of about 5 points.
EC WHEAT TRADE EC SHARE OF WORLD WHEAT TRADE
so
~~~~~~~~~~~~~~~~~~
~~~~so
-&.TCRSI IP6 jisI 25 25 s20 20 10~~~~~~~~~~~~~~~~~~~~~~~~~~~1 0 . 1960 1964 1968 1972 1976 1980 9i94 1988 1960 1964 1968 1972 1976 1980 1984 1988 Figure 3 Figure 42.5 Increased EC self-sufficiency is also occurring for coarse grains. Between the early 1960s and
mid-1 970s, the EC's coarse grain net imports were quite stable averaging about 1 5 million tons per year. Following an increase in net imports in 1976/77 due to drought, net coarse grain imports declined with the EC a net exporter since 1984/85 (Figure 5). The EC's share of world coarse grain imports also declined significantly over the last three decades (Figure 6).
EC COARSE GRAINS TRADE EC SHARE OF COARSE GRAINS TRADE 35 60 sO o. . 60 i,,- = M , 20 140 20.. 1960 1964 1968 1972 1976 1989 1984 t988 1960 1964 1968 1972 1976 1980 1984 1988
Figure 5
Figure
6
Developing
Countries'
Grain
Trade
2.6
The developing
countries
are large
grain net importers. Certain
countries
such as Thailand
(rice
exporter) and Argentina (wheat and coarse grains exporter) are large exporters, but overall the
developing countries are importers. Table 1 shows that Asia and the Middle East-North
Africa
dominate,
but all regions
have increased
imports. Since the mid-1970s, an increasing
gap between
grain production and consumption
in developing
countries
has occurred. The developing
countries
imported
42.7% of the world's grain trade in 1988 compared
to 18.5% in 1970. This increase
reflects
changes
in both the mix and levels of per capita food consumption
in many countries. Wheat for
human consumption
and livestock feeding of maize and wheat have both increased
sharply.
theincrease
in wheat consumption
reflects in part, the increasing
urbanization
in many countries,
which
is related
to higher incomes
in urban areas
and to the increasing
demand
for diversity and convenience
in the diet. As incomes increase,
the percentage
of wheat and meat products in food consumption
tends to increase,
while human
consumption
of coarse
grains
declines.
The increased
demand
for meat
at higher
income levels results in an increase
in the derived
demand
for coarse
grains and feed wheat.
These
trcnda are most apparent
in rapidly growing developing
countries.
6
Table I
Net Grain Imports of Developing Countries
--- __---Region 1960 1970 1980 1988 (Million Tons) --- __---Asia 9.2 13.2 27.9 33.6 Africa 0.5 1.9 7.3 6.2 Latin America 0.3 -4.8 3.9 12.3 Middle East 5.0 10.0 25.9 36.1 All Developing Countries 15.0 20.3 65.0 88.2 Share of World Market (%) 21.5 18.5 30.2 42.7 Source:--Data--from-USD---computations-
Ill. EC Grains Policv Develooments and FJiure Directions6
3.1 The most important CAP policy reform in the 1980s was ths European Commission's action
to reduce intervention in the grains sector6. During most of the 1 980s, the EC faced budgetary
problems. As a result, reforms toward a mort, r6strictive price policy
li.e.,
guaranteed prices stubjectto a maximum quantity) were adopted. In 1988/89 the "stabilizers" were implemented along with
changes in the coresponsibility leVy7. The stabilizer mechanism involves the imposition of an
additional coresponsibility lsvy of 3% of the nominal intervontion price, if grain prodLztion ',xceeds the
Maximum Guaranteed Quantity (MGQ). The MGQ is fixed at 160 million tons for four years (1 988/89
to 1391/92). If the MGQ is exceeded, the nominal target price for the following year is also reduced
bv 3%.
b Material in this section was developed from several sources including various issues of the CAP Monitor, The Agricultural
Situation in the Communizy by tl'e Commission of the European Communities. For a discussion of the EC Agricultural Policies, see Harris, S., Swinbank, A., and Wilkinson, G. 1983.
a The CAP, eneated in 1962. is the overriding policy affecting agriculture in the EC. Its specific go0ls were to encourage increased production, stabilize markets, ensure a fair standard of living to the farm sector, and encourage security of supply. Theise objectives have led to a costly and complex system of mechanism to regulate the market (see Figure 7 below). The most .mportant policy instrument affecting producer prices is domestic guaranteed price called an intervention price which sets the minimum price within the EC. Import and export mechanisms are used to maintain the guaranteed I ,s as follows: 1) Importers are charge a variable levy which raises the lower world price to a higher threshold price for imports. 2) Obligatory purcha3es of commodities at the intervention price. 3) EC exporters are givon variable export subsidy payments or refunds equivalent to the difference betwee'- the internal EC market price and the world price. This allows the EC to sell commodities at world prices.
FIGURE 7. EC PRICE SUPPORT MECHANISM FOR GRAINS ECU/TON
300
Tar at Price
250 Threshold Price Market Price
200
I
Intervention Import Levy Export subsidy
150 Price
IL
150 Price vL _ World Market
100 Lowest Price
50 mport Price
Domestic mechanism m Impert Mechanism
T
Export MechanismLevy EC , Export
Funds Budget Refunds
A coresponsibility levy is a tax leviAd on producers which, in the presence of a fixed price support, results in a tax burden borne entirely by farmers. The producer supply price declines by the amount of the tax, while consumer prices remain fixed. The coresponsibility levy was first introduced as part of the 1986/87 price package. The size of the levy is fixed annually by the Council of Ministers (set at 5.38 ECU/ton or 3% of the July intervention price), paid by the first buyers of grain and deducted from the price paid to the producer.
3.2 Before 1987/88, the intervention price was the "delivered-to-store price" at which grain
purchases were r.iade, adjusted for quality. Since then, a "buying-in" price, which is set at 94%X of
the basic intervention price has been paid for grain purchases.
3.3 Other policy developments include the provision of incentives, through direct payments, to
encourage the retirement of cropland (set-aside), the extensification and diversification of production, and early retirement of farmers. About 80% of total assistance is in terms of market price support. However, the EC has increased direct income payment programs in recent Vears. Other measures introduced to weaken the role of intervention in supporting market prices include tighter quality standards on grain eligible for intervention, the introduction of a 94% buying-in price, and a shorter period over which grains can be sold to intervention agencies.
EC-1992 and MCA Elimination
3.4 Within agriculture, the launching of the 1 992 program focused on the agrimonetary policy of
the CAP which sets-up a complicated system of taxes and subsidies along the borders of the member countries as well as between the EC and the rest-of-the world. By influencing agricultural price relationships among countries, the system influences EC's extra- and intra-trade. Elimination of these border taxes and subsidies represent a fundamental reform for the EC's agrimonotary and trading systems which in turn would influence EC's agricultural production and trade. Given the complexity of the agrimonetary system and its implementation, this section only briefly explains its general framework and how it affects EC agricultural prices. The reader is advised to see other sources such as the CAP Monitor (Agra Europe), and Toepfer (1986) for a detailed description. Mackel (1988) provides a good analysis of the effects of the agrimonetary system on EC agriculture.
3.5 Although a common policy price (denominated in conversion facto. called an ECU) is
established under the CAP, the EC has no common currency. When the CAP was formed, the world monetary system was based on the system of fixed exchange rates created at Bretton Woods.
Participating governments, through their memberships in the International Monetary Fu:r,d (IMF), agreed
to maintain a fixed value in terms of gold for their currencies. Although gold was used in valuing the currencies, in practice the US dollir was used as the primary currency in international trade. In 1962,
the EC decided to use the "unit of account"8 for fixing the guaranteed prices under the CAP. By
making the "unit of account" equivalent to one US dollar, th- EC was able to use the gold-based parities between member countries' currencies and the US dollar. The unit of account was then- used in defining CAP guaranteed prices; hence, making the guaranteed prices (expressed in national currencies) internally consistent between member countries. The rates at which the common guaranteed prices (in units of account) were converted into national curren:ies were called "green conversion rates" or "green money".
8 The unit of account was equal to 0.88867088 grams of fine gold. This also meant that, at this
parity, there were 35 ua per troy ounce of gold. Since the official price of gold then was $US 35 cents per ounce, the unit of account was also equal to one dollar.
3.6 The Bretton Woods system of fixed exchange rates came under pressure during the late 1 960s as the exchange rates declared to the IMF increasingly become out-of-line with market conditions. While the system allowed for small parity adjustments to be made at frequent intervals, in practice the adjustments made were large and they resulted in major international capital flows. In 1969, changes in the parity values were forced on the French and West Germany's currencies. In August 1969, the French franc was devalued and two months later, the deutschmark was revalued. These parity
changes marked the end of the only period when common guaranteed )rices for agricultural
commodities were equal throughout the EC. The devaluation of the franc implied that the dollar-franc
ratio rose from $US1 = 4.93707 to $US: -5.55419. This had the effect of raising the price in French
francs of any traded commodity priced in foreign currency. For a variety of reasons, the French government decided not to raise the guaranteed prices for agricultural commodities and continued to use the unchanged green conversion rate. In order to prevent French exports to other member countries offering a higher intervention price, French exports were subject to an export tax and imports to an equivalent subsidy--both now known as monetary compensatory amounts (MCAs). The revaluation of the deutschmark posed a similar problem, but with opposite policy implications. The remedy was to impose an MCA levied on imports and paid as a subsidy to exporters.
3.7 Since then, a separate system of exchange rates (now known as agrimonetary system or green currenic system) has been used in EC agriculture. The system affects price relationships and trade flows between member countries. Weak currency countries such as France tend to maintain green rates which are stronger than their central rates to avoid food price increases. Hence, the effective guaranteed intervention price expressed in francs is lower than the EC's common intervention price. Similarly, strong currency countries such as Germany maintain green rates which are weaker than their central rates in order to avoid declines in domestic prices and thus support farm income. The effective intervention price in Germany (in deutschmark) is therefore higher than the EC's common intervention price.
3.8 To avoid artificial trade flows due to the price differentials, a system of taxes and levies (MCA
system) is used on intra- and extra-EC trade. Strong currency countries have positive MCAs and weak currency countries have negative MCAs. MCAs are calculated as the product of the difference betweer a country's green and central rates, and the common intervention price. Germany's positive MCA is applied as a subsidy on German exports and a tax on German imports. Similarly, France's
negative MCA is applied as a tax on exports and a subsidy on imports. This system allows France
(Germany) to trade at the common price level while maintaining a lower (higher) domestic price.
3.9 A major feature of the 1970s was the divergence of CAP guaranteed prices (in domestic
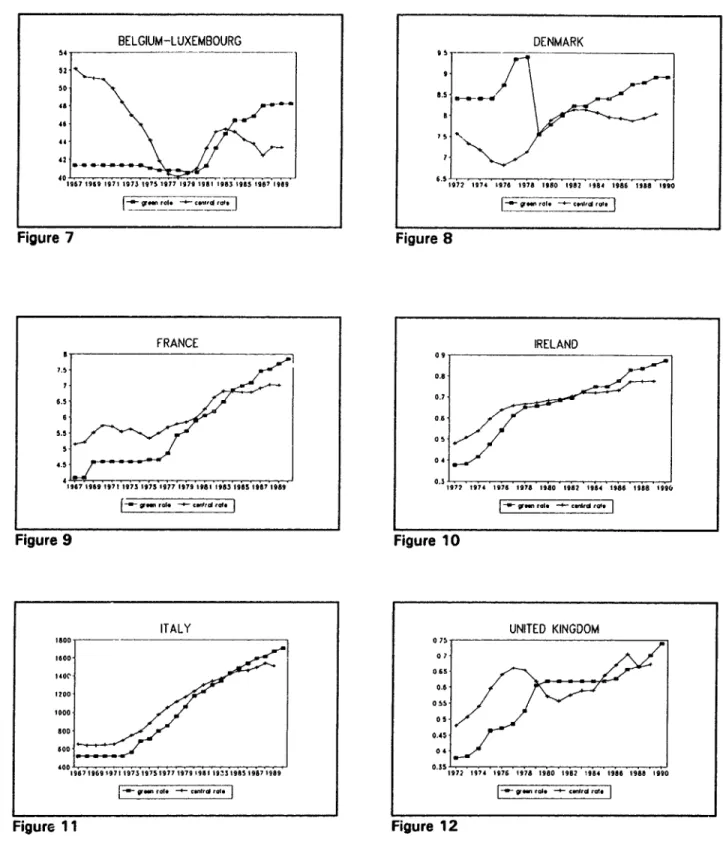
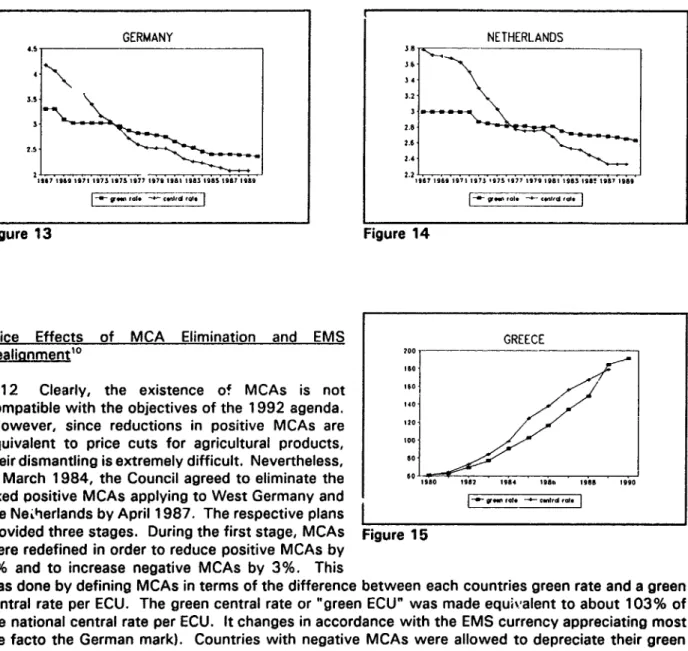
currencies) in different countries -- with the United Kingdom having the lowest and West Germany the highest prices. In autumn 1976 (during the sterling crisis), prices in West Germany were 60% higher than in the UK. This divergence was due to the differences in green rates and central rates. Figures 7 to 1 5 show the green rates and central rates in EC countries. Changes in green rates became a major part of the annual fixing of prices. Often a green rate devaluation had more impact on national prices than did the increase in guaranteed prices (for countries with depreciating currencies, typically Italy, the UK, Ireland, and France during the 1970s). The EC Commission argued for the elimination of the MCAs and for automatic changes in green rates but these arguments were rejected by the member countries. Finally, in March 1979, all member countries, except the UK, agreed that any new MCAs created after the agreements inception would be phased out after two years provided that this did not lead to a drop in support prices in national currencies for a country with positive MCAs.
10
3.10 In general, the MCAs for the seven members of the EMS9 were fixed. The MCAs for Italy and
other non-participating EC members (UK, Greece, Spain, and Portugal) are variable in the sense that they are calculated each week. The calculation of the MCAs became rather complicated. It was based
on the percentage difference between the country's currency ECU central rate and its green rate. Further deduction - known as franchises - was provided. Revaluation of a currency involves a formal change in the central rate of the currency involved and every other ECU currency. Consequently all MCAs are modified, i.e. a revaluation of one currency within the EMS will increase it positive MCA or reduce its negative MCA - but not by as much as its revaluation against the other ECU currencies. It will also increase the negative, and reduce or eliminate the positive MCAs of other countries. In general, the introduction of the EMS contributed to more settled monetary conditions within the EC in the early 1980s. The range of MCAs (and therefore of prices) between countries was reduced considerably.
3.11 rhe system of MCAs resiulted in an average increase of common prices in national currencies
of about 3% p.a. compared to prices expressed in ECUs. The average increase in common prices in national currencies has been lower than the increase in the CPI, except in 1981/82, and the development of prices adjusted for inflation varied considerably among member countries. A realignment of market exchange rates and green rates since the first half of the 1980s has reduced
the effects of the MCAs.
9 The EMS members are Belgium, Luxembourg, Denmark, France, Ireland, Germany, and
BELGIUM-LUXEMBOURG DENMARK 0 4- _ _ _ _ -6 46 46 49 42 967 1999 1671 19673 1975 1677 1976 1961 1963 1965 1967 1999 97?2 197 4 1976 1976 1960 1992 -964 1986 2938 1990 Figure 7 Figure 8 FRANCE IRELAND 7.5 068 9.5 . '1967 I9S9 1971 1 973 1975 1977 1979 1 981 1 983 1965 19§87 M99 0 5 .S 7 1 27 4 7 1 976 1976 1980 1982 1964 t986 s St8 1i99/0 Fi.gure 9 Figure 10
ITALY UNITED KINGDOM
1600 0 75
046 4200
0 5
1967 1969 99791975 19751977 197919669 993 19865 987 1969 1972 1974 9976 1978 1980 1982 9984 1996 1986 1990 Fig
rul.
--
rgu
Fird re 12 |rt.
4cdld
rd
12 GERMANY NETHERLANDS 4.53 34 3.2 2.9 2.5 2 2.2 1917 1969 19,1 1972 1975 1977 1979 19891993 159$S I 191989 967 999 1971 1973 97$ 1977 1979 1981 1969 19 97 991989
|- ' tel 4- c 9fltd *E] | -- .. rot -4o - .11, rodt.
Figure 13 Figure 14
Price Effects of MCA Elimination and EMS GREECE
Realionment0 700
ISO
3.12 Clearly, the existence of MCAs is not 190
compatible with the objectives of the 1992 agenda. 140
However, since reductions in positive MCAs are 120
equivalent to price cuts for agricultural products, 1017
their dismantling is extremely difficult. Nevertheless, 90
in March 1984, the Council agreed to eliminate the 10 999 1982 1994 199b 1989 1990
fixed
Positive
MCAs applying to West Germany andI-.
the Netherlands by April 1987. The respective plans
[
provided three stages. During the first stage, MCAs Figure 15 were redefined in order to reduce positive MCAs by
3% and to increase negative MCAs by 3%. This
was done by defining MCAs in terms of the difference between each countries green rate and a green central rate per ECU. The green central rate or "green ECU" was made equivalent to about 103% of the national central rate per ECU. It changes in accordance with the EMS currency appreciating most (de facto the German mark). Countries with negative MCAs were allowed to depreciate their green rates to eliminate their negative MCAs.
3.13 The second stage (January 1985), provided for a reduction of the positive MCAs of West
Germany by 5% and the Netherlands by 0.6-0.8% by appreciating the national green rates, thus lowering national agricultural prices. German farmers were compensated by a 5% reduction in their VAT payments. Remaining German and Dutch positive MCAs were scheduled to be dismantled by April, 1987. The 1984 arrangements overcame one main obstacle to eliminating the MCA system. However, they institutionalized national price increases to farmers in countries with negative MCAs above ECU price increases because member countries can only counterbalance the effect of negative MCAs by depreciating their currencies.
10 The workings of the European Monetary System and the arrangements for MCA dismantling are discussed in Boyd (1988).
3.14 In 1987, the "switch-over" system for avoiding the creation of positive MCAs was examined by the Commission. It recommended a "gradual return to coherence with the general monetary system" by 1992. This recommendation of the EC Commission was reflected in the adoption of a scheme for the automatic dismantling of all MCAs created by new exchange rate alignments, i.e., for natural MCAs caused by devaluat;in. The devaluation was done in three steps; 30% when the
currency moves, the rest in equal steps at the beginning of the next two seasons. In 1988, a decision
was taken concerning dismantlement - this time in four stages - of existing stocks of MCAs. The agrimonetary decisions for the agricultural marketing year 1989/90 provide for the total dismantling of all MCAs of all member countries participating in the EMS. As far as other member states are concerned, the application of reduced MCAs continues due to currency variations.
3.15 In Germany, the program for MCA removal involves the elimination of the current monetary
gaps by a revaluation of the German green mark in three stages between 1989 and 1992. In general, the removal of MCAs involves the revaluation of the green rates which, in turn, will increase the values of the green currencies of the countries with weaker currencies. Therefore, the effect will be a gradua! overall increase in price levels and a tendency for the prices in the weaker currency countries to move closer to the DM values. To prevent MCAs from reemerging, the European Commission will likely continue to reduce the importance of intervention in supporting grain prices by widening the neutral margin between depreciation of a currency and the application of MCAs. The effects of this would be to increase grain prices in the United Kingdom and France compared with those in countries with strong currencies.
3.16 An EMS realignment leads to changes in the strong currency correcting factor. The central rate
correcting factor or switchover has been applied since 1 984/85. It has the effect of cutting positive real monetary gaps at the expense of increasing negative ones, thus leading to a revaluation of the ECU for agricultural purposes. The central rate correcting factor is adjusted following EMS alignments so as to avoid the creation of new fixed positive MCAs. In 1987, the Council increased the factor to
1.37282 in order to reduce fixed positive MCAs.
3.17 Leading to changes in the strong currency correcting factor, an EMS realignment triggers the
arrangments for automatic green rate changes to dismantle new real monetary gaps. Real monetary gaps (RMGs) are divided into "artificial" RMGs which are created by increasing the correcting factor,
and "natural" RMGs, which are those created by the devaluation'depreciation of a central/market rate
of a currency within the EMS. For fixed MCAs the amount to be dismantled following each realignment is that created by the realignment. For variable MCAs it is the increase in RMGs since the previous realignment, including any increase occasioned by the central rate changes made at the realignment.
3.18 The dismantling of MCAs is effected by green rate devaluations phased over the three years
following the realignments as follows: a. for natural RMGs:
-up to 30% immediately following the realignment
-the remainder in two equal stages at the beginning of the following two marketing years.
b. for artificial RMGs:
-25% at the beginning of the next marketing year after the realignment
-37.5% at the beginning of the each of the two following marketing years.
14
3.19 These devaluations are implemented by the Commission automatically unless the effect would
be to increase the RMG or to turn a negative RMG positive. In the latter case, the green rate is only adjusted to the extent necessary to achieve parity with the central rate.
3.20 Green rate devaluiations lead to increased support prices in the national currencies of the
devaluating members. In order to reduce the budgetary costs of tying the agricultural ECU to the strongest currency (de facto the German Mark), the first phase of dismantling of artificial MCAs is to be neutralized by a reduction in common prices set in ECU. In 1988, the Council of Ministers and the Commission decided that the existing stocks of monetary gaps for countr"gs with fixed MCAs shall be dismantled by 1992. As of January 1, 1989, no MCAs are applied in Belgium, Denmark, Germany, Luxembourg and in Netherlands. In other member countries, the monetary gaps (in national
currency/ecu) applied in the cereal sector are the following: France (-2.0), Ireland (-2.0), Greece
(-15.0), Spain (+ 1.0), Italy (-3.2), United Kingdom (-6.1).
3.21 The Commision's proposals for 1989/90 included the removal of RMG's for Germany and the
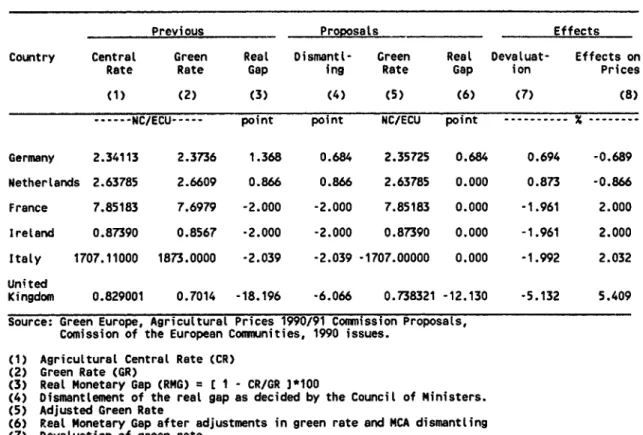
Netherlands, the dismantling of the RMGs of other countries in two steps (abolish MCAs at the beginning of 1989/90). In 1990/91, the Commision's proposal included the complete abolishment of existing real monetary gaps in France, Ireland, Italy, Portugal, Netherlands; dismantlement of one third of the real monetary gap for United Kingdom and Spain applicable at the time of the Council decision on the 1990/91 price proposals; for Greece, a dismantlement of monetary gaps to an extent which equates to its inflation rate less 5 points. The price effects of these changes are shown in Table II and Ill.
Table 11
Price Effects of MCA Elimination
Country Previous : 1989/90 ProposaLs Effects
Central Green Real Dismantt- Green Real Devalua- Effects
Rate Rate Gap ing Rate Gap tion on Prices
(1) (2) (3) (4) (5) (6) (7) (8)
----NC/ECU --- point point NC/ECU point ---
Percent---Germany 2.3413 2.3736 1.368 1.368 2.3411 0.000 1.387 -1.386 Netherlands 2.6378 2.6609 0.866 0.866 2.6378 0.000 0.873 -0.866 France 7.8518 7.5842 -3.529 -1.529 7.6978 -2.000 -1.477 1.499 Ireland 0.8739 0.8438 -3.565 -1.565 0.8567 -2.000 -1.511 1.534 Greece 192.8940 164.7290 -17.098 -12.546 184.4960 -4.550 -10.714 12.000 ItaLy 1711.8400 1635.0000 -4.700 -1.577 1660.0000 -3.123 -1.506 1.529 U. Kingdom 0.7260 0.6750 -7.629 -2.543 0.6914 -5.086 -2.363 2.420
Source: Green Europe, Commission of the European Coummunities, 1989 issues.
(1) Agricultural central rate (CR)
(2) Green rate (GR)
(3) Real Monetary Gap (RMG) = l - CR/GRI*100
(4) Dismantlement of the real gap for crop year 1989/90 as decided by the EC Council of Ministers.
(5) Adjusted green rate decided by the EC Council of Ministers.
(6) Real gap after adjustments in the green rate.
(7) Devaluation of green rates in percent.
(8) Percentage variation between 1989/90 guaranteed price (in national currency) and the guaranteed
16
Table III
1990/91 AGRIMONETARY PROPOSALS
Previous Proposats Effects
Country CentraL Green Real Dismantl- Green Real Devatuat- Effects on
Rate Rate Gap ing Rate Gap ion Prices
(1) (2) (3) (4) (5) (6) (7) (8)
--- NC/ECU --- point point NC/ECU point -- ---- X
---Germany 2.34113 2.3736 1.368 0.684 2.35725 0.684 0.694 -0.689 Netherlands 2.63785 2.6609 0.866 0.866 2.63785 0.000 0.873 -0.866 France 7.85183 7.6979 -2.000 -2.000 7.85183 0.000 -1.961 2.000 Ireland 0.87390 0.8567 -2.000 -2.000 0.87390 0.000 -1.961 2.000 Italy 1707.11000 1873.0000 -2.039 -2.039 -1707.00000 0.000 -1.992 2.032 United Kingdom 0.829001 0.7014 -18.196 -6.066 0.738321 -12.130 -5.132 5.409
Source: Green Europe, Agricultural Prices 1990/91 Commission ProposaLs,
Comission of the European Communities, 1990 issues.
(1) Agricultural CentraL Rate (CR)
(2) Green Rate (GR)
(3) ReaL Monetary Gap (RMG) I - CR/GR 1*100
(4) Dismantlement of the real gap as decided by the Council of Ministers.
(5) Adjusted Green Rate
(6) Real Monetary Gap after adjustments in green rate and MCA dismantling
(7) Devaluation of green rate
(8) Percentage variation between proposed guaranteed price for 1990/91 and the guaranteed price for 1989/90.
IV. Analytical Model
3.22 A deterministic model of exchange rates and MCAs is developed for the 10 EC countries. This
is linked to a traditional area and yield model to estimate the effects of policy variable changes. Compared to previous studies (Meilke and Gorter, 1987; Bailey, 1989), this model accounts for differences in the supply response in each member country. Macroeconomic policies result in varying changes in exchange rates and thus, different domestic prices in each country. As discussed in the previous section, the creation of a border free market in EC agriculture requires the removal of customs duties and quantitative restrictions (e.g. MCAs). The dismantling of MCAs uescribed in the agrimonetary proposals is effected by green rate adjustments phased over a number of years. The production and domestic price effects of green rate adjustments as a result of MCA dismantling are then estimated.
3.23 Letf, be a vector of green exchange rates u4d for commodity i, the aggregate supply function
(q) and the domestic price effects of green rate adjustments and support policies can be derived as follows:
= q (
Pi
*
Pw z)
( 2)
d
where
u.
~~are
a vector of short-run
supply curves
jeCU
are the intervention
prices in ECUs
pdw
are tedomestic prices
of inputs
z
are technology
shift variables
pP are = domestic prices for commodity i
Xg,
~~are
the green rates of exchange
for comnmodityi
3.24 The cnefficient on the product of the intervention price and green rates determines the
response
of producer
prices to changes
in price policies such as the stabilizers
or to adjustments
in
green rates in each country. This allows explicit estimation
of the price transmission
coefficients.
18
3.25 From equations (1) to (3), the price and supply effects of exchange rate adjustments and
support price (intervention price) reductions can be estimated. Green rate revaluations (devaluation) in countries with positive (negative) MCAs will result in supply reductions (increases) since the supply
curves are monotically increasing in pd,, Production for each country is then determined by the product
of separately estimated area response and yield fu, ictions. The area and yield functions are:
As = f ( RV, , RVj, A , Z, (4)
Y f ( Pi, Pjd FPl_1., Z,)
(5)
where
A, is crop area harvested for commodity i in year t
RVi,., is crop revenue per hectare for commodity i in year t-1 RV;., is crop revenue per hectare for commodity j in year t-1 FPi,., is fertilizer price paid by farmers in country i in year t
,t is a linear trend representing technology
3.26 The analysis of area response uses expected crop revenues as explanatory variables rather than
prices to account for the nonstationarity of yields and input costs. " With technology and the
demand for input combinations changing, yields, input costs, and prices should be considered in the area allocation decision (Sanderson, Quilkey, and Freebairn, 1980). This is modeled by defining expected crop revenues per hectare as gross expected returns (per hectare expected price less fertilizer costs). The linear trend variable, Zt, is included to capture factors or variables which are believed to
be important, but which cannot be included due to data limitations. Examples include technology and
structural policies (e.g. investments in input supply, processing and marketing facilities, substitution
of capital for labor in the modernization process, farm credit subsidies) which are considered significant
sources of output growth in the EC (Bouchet, Orden, and Norton, 1987).
1" Area response equations using prices as explanatory variables were also estimated for
3.27 The yield equations show a strong trend, particularly for wheat. Average wheat yields in France increased from less than 3 tons/ha. in the early 1960s to over 6 tons/ha. by the late 1980s. Significant growth in yields also occurred in other member countries. Changes in the domestic producer price of wheat relative to the index of inputs costs are significant in determining the growth
in yields. Aggregate EC1 0 wheat area harvested has been relatively stable, increasing from an average
of 11.8 million hectares in 1967/75 (average) to 12.9 mill on hectares in 1988/89. However, varying
trends occurred in member countries. Wheat area harvested declined in Greece 6.3%), Ireland (-18.5%), Italy (-23.4%), and Netherlands (-19.8%) between 1967/75 and 1988/89, and increased in
Belgium-Luxembourg (+ 1.7%), Denmark ( + 178%), France ( + 21.1 %), and Germany ( + 13.4%) during
the same period. In contrast, total coarse grain area harvested declined in all countries, except Italy, during the same period.
3.28 Under the stabilizer mechanism, the intervention price and the coresponsibility levy are
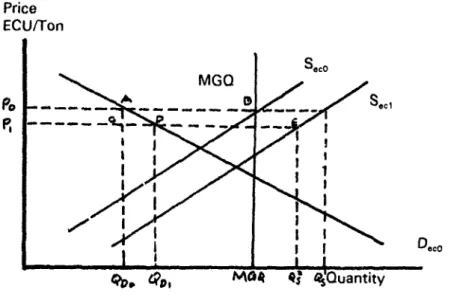
automatically adjusted if total EC12 grain production exceeds the Maximum Guaranteed Quantity (MGQ) equal to 160 million tons. For each percentage point of excess production between 1 % and 3%, the levy in the current year is increased by 1 %. In addition, the following year's intervention price is reduced by 3%. The domestic and world market effects of the stabilizer mechanism is shown in Figure 16 below.
3.29 Figure 16a represents the domestic market with EC supply (SJc) and demand (DJC) curves. The
effects on the domestic market of independent increases in the coresponsibility levy and/or independent reductions in the guaranteed price are analyzed as follows, given an initial condition
defined by the intervention price set at P0 and quantity equal to the maximum guaranteed quantity,
MGQ. Consider an exogenous shift in supply due to yield improvements. This is shown in the figure
as a shift in the supply curve from S.co to S.c1 In the absence of the stabilizer mechanism, this would
result in an increase in actual EC supply to Q18. However, with the stabilizer mechanism, this supply
increase violates the MGQ and triggers an increase in the coresponsibility levy, represented by a
rsduction in the guaranteed price to P1 (i.e., the levy is subtracted from the guaranteed intervention
price). Consider first the effects of the increase in the levy. This results in a reduction in supply to
Q20 and excess supply equal to CE. The effects of the reduction in the intervention price (apart from
the change in ths levy) are a decline in quantity supplied to Q2s and an increase in the quantity
demanded to Qld. The combination of these two changes results in a greater reduction in excess
supply of grains in the EC to DE, compared with CE with only the levy increase. Hence, independent increases in the coresponsibility levy result only in production changes while independent reductions in the guaranteed price result in both production and consumption adjustments.
3.30 The effects on the world market of changes in EC grains policy are shown in Figure 16b. The
figure illustrates the world market effects of a reduction in the EC guaranteed price and an increase in the coresponsibility levy. Consider first an independent increase in the levy. This is illustrated as
a reduction in the price from P0to Pl. This results in lower EC grains exports equal to JK. This decline
in exports translates into a leftward shift in world grains supply, shown by the shift to SW. This
reduction in world supply raises world market prices from P*0to Pw1. Similar changes occur due to a
reduction in the guaranteed price, but the magnitudes are somewhat greater. The reduction in the guaranteed price results in both increases in EC consumption and declines in EC production. This results in a larger decline in EC exports and correspondingly higher world market prices. EC exports
20
Figure 16a. EC STABILIZER POLiCY
Price ECU/Ton Saco MGQ Po -___ - - - - Sacl
%o
<?ol M4 Q$ 4sQuantityFigure 16b. EFFECTS OF EC GRAINS' POLICY
Price World ECU/Ton Price go~~o __
F'.~~~
__ec XD., SW, t NL ____ __8t.43
r~~~~DWo
\zSw^O L~ XChangein
<
Levy I,~~~~~~~~~~~~P, EC Exports Quantity Quantity3.31 To estimate the world effects of changes in EC policies, the 1 0 country EC model was
intagrated with the World Bank's World Grains Model"2, The World Grains Model is a global,
partial-equil;brium, net-trade model of the grains and soybeans markets. Fifteen of the major grain producing, consuming, anJ trading countries are modeled individually (i.e., Australia, Canada, Japan, United States, Argentina, Brazil, China, Egypt, India, Indonesia, Mexico, Nigeria, Pakistan, and Thailand) and the remaining countries are grouped into nine regic is (i.e., EC-10, Eastern Europe, USSR, Other Industrial Countries, Central Africa, East Asia, South Asia, Latin America and Caribbean, and North Africa and Middle East).
3.32 The equations in the World Grains Model are econometrically estimated using primarily OLS
from annual data over the period 1 960-1 988. The model is linear in both the variables and parameters. The commodities included in the world model are wheat, rice, coarse grains (maize, oats, barley, sorghum, rye, millet, and mixed grains), soybeans, soymeal, and soyoil. Individual models have been estimated for each commodity and country or regions with cross linkages between commodities. Production for each country or region is determined as the product of separately estimated harvested area and yield equations. Harvested area in each region or country is determined by a two-stage process wherein total area harvested is determined first and then allocated among competing crops on the basis of ;agged per hectare revenue. Yields in each region or country are estimated as a function of the ratio of lagged crop prices to current fertilizer prices, the proportion of area planted to
high-yielding varieties in the case of rice and wheat and a linear trend to represent technology.
3.33 Per capita imports of each commodity in each region or country are estimated directly for
importing countries as a function of population, income, domestic supply and prices. Total consumption is obtained as an identity. Net exports are est.mated for exporting countries as a function of the level of each commodity available for export and world prices. Consumption in the exporting countries is estimated as function of population, income and prices.
3.34 A single world price is assumed for each commodity, and the model is solved simultaneously
for this price. The price in each non-EC country or region is then defined as the export price converted to local currency and deflated by the consumer price index of the country. Regional exchange rates and consumer price indexes are constructed as weighted averages of the data for individual countries.
3.35 A price equation is used to solve the model for the nominal export price for each commodity.
Specific policy information is included for the United States on variables such as diverted areas and support prices.
12 Mitchell, Donald O., "A World Grains And Soybeans Model" in International Commodity Markets
22
V. EC Grairl SUDDIV Response Estimates
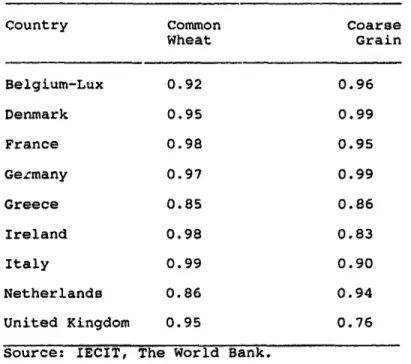
5.1 The estimated coefficients of price transmission for wheat and coarse grains are shown in
Table IV. The results were obtained from the model presented in the previous section. The estimates are between 0.76 and 1.0, indicating that price transmission between the CAP support prices and
domestic prices in the EC are less than perfect. This is partly due to varying exchange rate policies,
since reductions in support prices are sometimes offset by adjustments in the exchange rates.
5.2 The short-run area and yield response estimates are shown in Tables V and VI. As indicated
earlier, the revenue variable was used instead of price to account for the nonstationarity of yields. However, the estimates using prices are also presented for comparative purposes. Area and yields are found to be responsive to crop revenues and input prices, but the estimated area and yield functions are inelastic. The results suggest a significant role for technology changes in EC grain yield increases.
TABLE IV
PRICE TRANSMISSION ELASTICITIES
Country Common Coarse
Wheat Grain Belgium-Lux 0.92 0.96 Denmark 0.95 0.99 France 0.98 0.95 Gezmany 0.97 0.99 Greece 0.85 0.86 Ireland 0.98 0.83 Italy 0.99 0.90 Netherlands 0.86 0.94 United Kingdom 0.95 0.76
TABLE V
EC SHORT-RUN AREA ELASTICITIES 1/
Country/ With Respect to Price/Revenue of
Commodity --- Wheat --- --- Coarse
Grain----Price Revenue Price Revenue
Belgium- Wheat 0.2375 0.4993 ns -0.520 Luxembourg C.Grains ns -0.1576 0.1254 0.040 Denmark Wheat 0.7889 1.3921 -0.4385 -0.990 C.Grains ns -0.2220 0.1130 0.090 France Wheat 0.1780 ns -0.5250 na C.Grains -0.2920 -0.2770 0.4960 0.570 Germany Wheat 0.0830 0.1750 -0.1430 -0.275 C.Grains -0.0200 -0.0300 0. 1200 0.080 Greece Wheat 0.1290 0.0710 ns -0.100 C.Grains ne ns ns 0.050 Ireland Wheat 0.2460 0.8840 -0.4480 -0.708 C.Grains -0.0400 -0.0450 0.1880 0.188 Italy Wheat 0.2600 0.1790 ne -0.208 C.Grains -0.4160 -0.1100 0.4802 0.171 Netherlands Wheat 0.0850 0.2240 ns ns C.Grains -0.3670 -0.1040 0.2780 0.100 U.Kingdom Wheat 0.1540 0.5850 ns -0.489 C.Grains -0.1770 0.0840 0.1500 ns
Source: IECIT, The World Bank.
1/ Elasticities calculated at the sample means, 1961-1988.
ns means that the variable is not statistically significant at 5%
24
TABLE VI
YIELD ELASTICITIES 1/
Country/Commodity With Resoect to
Wheat Coarse Fertilizer Technology
Price Grains Price
Price Belgium Wheat 0.317 -0.523 -0.341 0.675 C.Grain ns ns -0.228 0.377 Denmark Wheat 0.114 ns -0.074 0.254 C.Grain -0.588 -0.352 -0.218 0.066 France Wheat 0.198 -0.110 -0.367 0.106 C.Grain ns ns -0.752 -0.124 Germany Wheat ns ns -0.253 0.295 C.Grain -0.848 0.551 -0.054 J.132 Greece Wheat 0.298 -0.002 -0.239 0.050 C.Grain -0.145 0.002 ns 0.298 Ireland Wheat 0.487 -0.527 -0.206 0.388 C.Grain ns 0.016 -0.318 0.167 Italy Wheat 0.236 -0.173 ns 0.169 C.Grain ns 0.374 -0.077 0.238 Netherlands Wheat 0.673 -0.454 ns 0.518 C.Grain ne 0.027 ns 0.271 United Kingdom Wheat 0.192 ns -0.026 0.435 C.Grain -0.812 0.588 ns 0.195
Source: IECIT, The World Bank.
1/ Elasticities calculated at Sample Means, 1961-1988.
ns means that the variable is not statistically significant at
5.3 Meilke and de Gorter (1987) estimated an aggregate ECtO supply elasticity for wheat using an aggregate area and production response function. The price elasticity of wheat area with respect to wheat price was found to be 0.34, and the crossprice elasticity with respect to barley price was -0.75. Total EC10 wheat production was found to have a direct price elasticity of 0.40. Compared with the elasticity estimates listed in Table V, the aggregate estimate hides the varying degree of area response in each member country. This variation in supply elasticities could be explained by differences in production and farm structure in each member country.
26
VI. Proiections of EC Grain Production and Trade. and the Imolications
for World Grain Prices and Developinc Countries' Grain Trade
6.1 Three simulations were run to evaluate the implications of alternative EC grains policies on EC
grain production and consumption, world prices, and developing countries net grain trade. The supply model for wheat and coarse grains for the 10 EC countries described earlier was simulated to estimate the effects on wheat and coarse grains production. Estimates were made for each of the EC10 countries and then aggregated to obtain the EC total. Demand effects were included for the aggregate
EC10 region by applying assumed price elasticities to the price changes resulting from the policy
alternatives. The changes in supply and demand for the ECI0 were transmitted to the world through changes in the net trade of wheat and coarse grains relative to the base simulation. The world grains model was then used to evaluate the price and trade effects of the simulations. This two-step
procedure does not allow prices to be transmitted from the world market to the EC, but this has
typically been a feature of the CAP.
6.2 The Base simulation was taken from a recent World Bank forecast scenario as described in
Report 814/90.'3 The Base simulation and the two alternative scenarios are described in Table VIl. Scenario I simulates the effects of eliminating the MCAs by changes in the green rates. This corresponds closely with the changes expected to occur under the 1992 integration of the European Community. The changes specified in the agrimonetary proposals were used as a basis for this Scenario. The second simulation alternative, Scenario II, went well beyond any policy changes which are currently being discussed. This simulation attempts to capture the effects of returning wheat and
coarse grain yields in the EC1 0 to their levels relative to the United States prior to the existence of the
CAP. This was done Ly computing wheat and coarse grain yields in each of the EC10 countries and
comparing them with the US yields during the 5-year period from 1962-66 before the CAP was created. The relative yields in this period were taken to reflect differences inherent to the country such
as climate, land conditions, water availability and farm structure. In many cases, the yields of ECI0
countries increased dramatically over the period of the CAP relative to the increase in yields in the
United States, especially for wheat. We attribute the more rapid growth of yields in EC10 countries
to the higher than world prices under the CAP. This effect was removed by reducing the yields for wheat and coarse grains for each of the EC1 0 countries to the relative yields to the United States. The adjustment was made over the 1991-2000 period, so that EC country yields in 2000 were the same relative to the projected US yields as during the 1962-66 base period. For some countries, such as
France, yields declined significantly while in other countries such
3s
Greece and Italy, yields declinedonly slightly. Figure 16 shows the effect of reducing wheat yields in France to the yield level, relative to the US, which existed prior to the CAP.
13 "Price Prospects for Major Primary Commodities," Report 814/90, The World Bank, December
TABLE VIli
EC 1992 POLICY SIMULATIONS
BASE SIMULATION - Stabilizers remain in effect through 2000 which reduces intervention prices in ECU by 3%
per year. Domestic prices are
computed using green rates.
SCENARIO I - BASE SIMULATION + EC-1992
Monetary Compensatory Amounts (MCAs) and Monetary Gaps are eliminated by automatic adjustments in green conversion rates in stages beginning in 1990 (as specified in the 1990/91 Agrimonetary proposal). The CAP is retained but price reforms are
continued through the stabilizers. Effects of EC-1992 on agriculture are captured by the elimination of MCAs.
SCENARIO II - SCENARIO I +
Wheat and coarse grain yields return to pre-EC CAP historical relationships to US This represents the elimination
of the CAP and return of the EC as a world market price driven region.
28
WHEAT YIELDS
(MT/HA) 7 -m 6 5 4 2 - ,, t - -1960 1964 1968 1972 1976 1980 1984 1988 '992 1996 2000 |-- USA *--- FRANCE Figure 166.3 The overall idea of Scenario 11 was to simulate the elimination of the CAP and the return of the
countries of the EC to a world market price driven region. It is unrealistic to expect this to occur for many reasons but it adequately bounds the largest change which could be expected. Moreover, the scenario raises an interesting question as to the permanence of yield changes. Would yields return to their previous relative levels to the United States? Several factors suggest they would not. Land and irrigation improvements would remain and contribute to higher yields. Genetic improvements would also remain but they could slowly deteriorate as new diseases and pests evolved. Yield increases due
to high levels of inptits such 3S fertilizer would decline as lower input use became profitable. The
relative contrib tion of these several factors would determine the adjustments in yields.
6.4 The two scenarios relative to the Base run provide estimates of the effects of EC policy
changes on wheat and coarse grains net trade levels. This assumes that prodLction and consumption changes in the EC are fully transmitted to the world market through changes in net trade. Price effects of these exports are estimated for the world for wheat, coarse grains, and rice and these changes impact the level of trade of the developing countries. Rice was included because it is in the world model simulations and because it is a strong substitute for wheat in many Asian countries. The quantities and revenues or expenditures on net grain trade are estimated from the world grains model and are presented for geographic regions.
6.5 Projections of total grain production in the 10 member country are presented in the Appendix
Tables. Total EC1 0 wheat and coarse grain production under the three policy scenarios is shown in
Figures 18 and 19. The baseline, which includes the stabilizer price cutting mechanism up to the year 2000, indicates that while the stabilizers have a depressing effect upon the intervention price, the effect on production is minimal. Reductions in intervention prices are partly offset by changes in
exchange rates between national currencies and the ECU. In 1990/91, for example, these changes resulted in higher domestic prices in Greece and the United Kingdom, while domestic prices declined only slightly in France, Ireland, and Italy. EC10 total grain production is projected to continue to increase at 1.4% p.a. as average yields continue to increase at a rate of about 2% p.a.
EC-1 0 WHEAT PRODUCTION
90 _ _ _ _ 80 7 0 o60
->50
-1960 i964 1968 1972 1976 1980 1984 1988 1992 1996 2000-- BASELINE --- SCENARIO 1 -a'- SCENARIO 2
Figure 17
6.6 MCA elimination and the continuation of stabilizers under Scenario I are projected to result in
a slight increase in EC10 grain production relative to the baseline. Total EC10 grain production
increases by 2% p.a. over the baseline in 1995-2000. The return to historical yields under Scenario
11 resulted in a significant decline in grain production. Total EC10 wheat production is projected to
decline by 27% relative to the baseline in 2000, and coarse grain production is projected to increase 3.7% relative to the baseline in 2000. The large effect on wheat production compared to the small effect on coarse grain production results from three factors. First, wheat yields have grown more rapidly than coarse grain yields under the CAP and, consequently, removing this growth under Scenario
11 reduces wheat production substantially. Secondly, the United States has actually had more rapid
growth in coarse grain yields over the period of the CAP than the EC. But, the United States achieved these gains in hybrid corn whereas the EC primarily produces barley--which has not had the same yield increases. Thus it is difficult to estimate the portion of the EC's coarse grains yields growth due to the higher prices to producers because of the CAP. Finally, interactions within the estimated EC supply model increase the relative profitability and production of coarse grains as wheat yields decline. Combined, these three effects cause coarse grain production to increase slightly, while wheat production declines significantly.
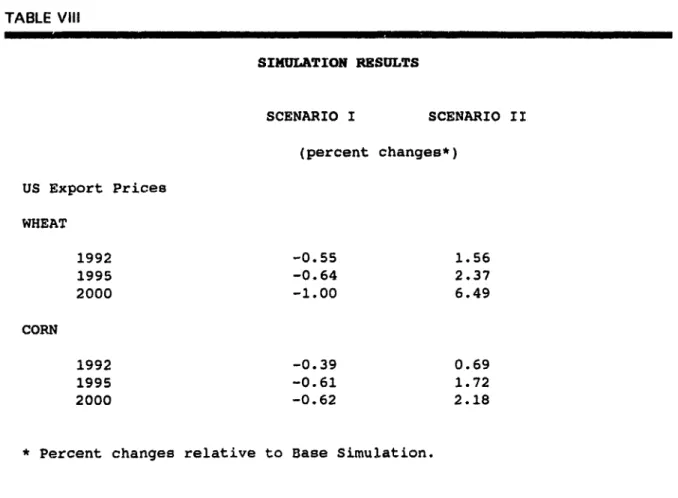
6.7 The changes in world wheat and cor.a prices (as a proxy for all coarse grains) are shown in
Table IX. Under Scenario I, the elimination of the MCAs decreases world wheat and coarse grain prices because producer prices in weak currency countries increase as their green rates are devalued to eliminate the monetary gaps. By the year 2000, wheat prices fall 1 % and corn prices fall 0.62%.
30 Scenario II results in substantially higher prices for wheat (+ 6.49%) and coarse grains (+ 2.18%) by the year 2000. Wheat prices increase more than coarse grain prices because the EC's wheat production declines sharply while coarse grains production increases slightly. Since these changes are assumed to be reflected in EC grain trade, wheat net exports decline causing world wheat prices to
rise. The increase in world coarse grain prices is due to adjustments in the world market which increase all grain prices.
6.8 The effects of the simulated EC policy changes on the developing countries are measured by
the changes in world prices. This is only an approximation of the true effects because it does not consider export subsidies by the EC countries to se:ected developing countries. Depending on changes
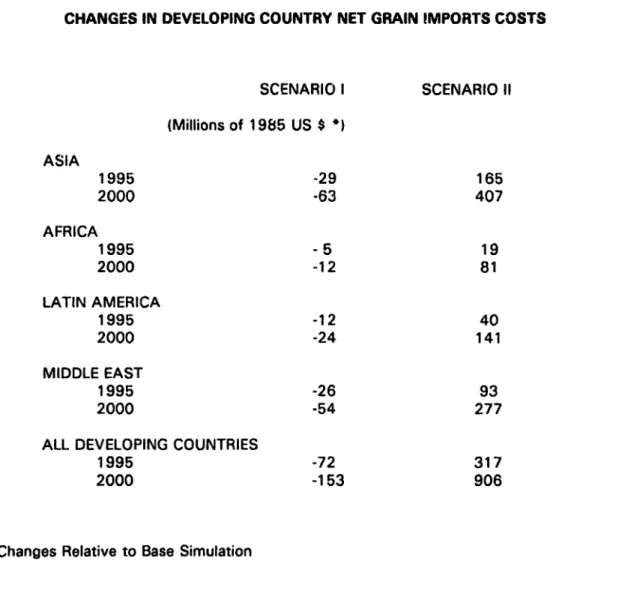
in export subsidies, the full impact on the developing countries would be greater or smaller. Scenario I results in slightly lower world grain prices and lower total net grain import costs for the developing
countries. Quantities of imports would also increase in response to the lower prices. By 2000, the cost
of grain imports by all developing countries would decline by US$ 153 million in constant 1985 dollars. The greatest savings would go to Asian and Middle Eastern developing countries because they are the largest imporzers. Asian countries would save an estimated US$ 63 million (in constant 1985 dollars) and Middle Eastern countries would save an estimated US$ 54 million (in constant 1985 dollars).
6.9 If the EC returned to historical yield levels for weat and coarse grains, as simulated in Scenario
11, then the world prices of all grains would rise. This would increase the cost of grain imports by the
developing countries by an estimated US$ 906 million in constant 1985 dollars by the year 2000. These results are shown in Table IX. Under Scenario II, Asian countries would face the highest rise in grain import costs, followed by Middle Eastern developing countries.
TABLE VilI SIMULATION RESULTS SCENARIO I SCENARIO II (percent changes*) US Export Prices WHEAT 1992 -0.55 1.56 1995 -0.64 2.37 2000 -1.00 6.49 CORN 1992 -0.39 0.69 1995 -0.61 1.72 2000 -0.62 2.18
* Percent changes relative to Base Simulation.
32
TABLE IX
CHANGES IN DEVELOPING COUNTRY NET GRAIN IMPORTS COSTS
SCENARIO I SCENARIO II (Millions of 1985 US $ ) ASIA 1995 -29 165 2000 -63 407 AFRICA 1995 - 5 19 2000 -12 81 LATIN AMERICA 1995 -12 40 2000 -24 141 MIDDLE EAST 1995 -26 93 2000 -54 277
ALL DEVELOPING COUNTRIES
1995 -72 317
2000 -153 906
}Changes Relative to Base Simulation
VIl. Concludinc Remarks
7.1 This paper presents the domestic EC10 and world grain market impacts of policy reforms in
the European Community. The effects on EC prices, production, and net trade of eliminating agricultural border taxes and subsidies (MCAs) are estimated. In addition, the reduction of support prices is simulated and the effects on world grain prices and trade of developing countries are estimated.
7.2 Estimates of the short-run supply functions suggest that area and yields in each of the member
country are responsive to prices and crop revenues. This provides support for the view that EC price policies have been a source of growth in output. However, the supply responses in most countries are found to be inelastic in the short-run. Hence, reductions in price support will have limited effect on production in the short-run. However, the results also suggest the significant role of technology changes as a source of growth in EC grain yields.
7.3 The world price and trade effects of the stabilizers and the MCAs are shown to be small. This
is partly due to the inelastic supply response and the offsetting effects of exchange rate policies in member countries. This implies that each member country'