Computing Practices
Beyond Spreadsheets:
Tools for Building
Decision Support
Systems
D
ecision support systems (DSSs) are software products that help users apply analytical and scientific methods to decision making. They work by using models and algorithms from disciplines such as decision analysis, mathematical programming and optimization, stochastic modeling, simulation, and logic modeling. DSS products can execute, inter-pret, visualize, and interactively analyze these mod-els over multiple scenarios.In recent years, the growing popularity of online analytical processing, data warehousing, and supply chain management has led to an increased interest in the development of decision support systems. Decision support tools could assist decision-makers in problems involving risk management, the allocation of scarce resources, and the need to balance conflicting objec-tives. When well implemented and used wisely, DSSs can significantly improve the quality of an organiza-tion’s decision making.
However, building a DSS requires significant exper-tise in decision analysis, programming, and user inter-face design. A DSS can also need to connect in real time with other enterprise applications, further com-plicating the task. For these reasons, the broad use of DSSs—compared with, say, database management sys-tems—has not occurred.
What’s missing is sophisticated tool support for devel-oping DSSs. One current solution is a DSS generator,1 a kit or environment for developing an application-spe-cific DSS. DSS generators provide tools that make it
eas-ier and faster to develop models, data, and user inter-faces that are customized to the application’s require-ments. Using a DSS generator reduces DSS development to a decision analysis task—which requires expertise in decision analysis and mathematical modeling—rather than a programming task. DSS generators are crucial to the success of DSSs in practice.
In this article, we describe the state of the art in DSS generator software, specifically in the realm of decision analysis methods (see the “Decision Analysis” sidebar).2 Decision analysis techniques account for the uncertain, dynamic, and multicriteria aspects of decisions. Essentially, they aid the evaluation of alternatives in the face of trade-offs. Well-known decision analysis meth-ods include decision trees and influence diagrams. Here we briefly describe the features of 11 commercially available DSS generators that specialize in decision
Computing Practices
The complexity and long development time inherent in building decision
support systems has thus far prevented their wide use. A new class of
tools, DSS generators, seeks to cut the lead time between development
and deployment.
Hemant K.
Bhargava
Carnegie Mellon UniversitySuresh Sridhar
i2 TechnologiesCraig Herrick
US Navyanalysis. Although not a comprehensive, complete analysis of these tools, this article clarifies the idea of DSS generators as DSS development environments and presents an overview of the progress in this area.
WHAT IS A DSS GENERATOR?
The word “generator” is somewhat of a misnomer. Although DSS generators are indeed used to develop DSS applications for specific decision problems, they do not behave like a typical code generator (which automatically generates programming code from a set of requirements specifications), or a software devel-opment environment. Programmers use a develop-ment environdevelop-ment to write and then compile source code. The resulting stand-alone, runtime object can be executed without the development environment.
Using a DSS generator, in contrast, is more akin to using an interpreted programming language—you must always have the interpreter to execute the code. As another example, consider a spreadsheet as an appli-cation development environment. Appliappli-cation devel-opers use certain spreadsheet features to create
mathematical models, data structures, macros, input forms, and other objects. However, spreadsheets don’t have compilers and don’t produce runtime objects. Users must have the spreadsheet system to execute the application.
As an application development environment, a DSS generator is more like a spreadsheet than a C++ devel-opment environment. Developers work with a DSS generator, which provides certain generic functions (discussed later). DSS developers can use these func-tions to build models and data for the application, speeding up the DSS development process. However, DSS generators don’t produce runtime objects, and the applications they generate can be executed only if the user has the generator program as well.
Therefore, a DSS generator is a code generator in only a limited sense: It provides a visual interface for model development and data definition. A DSS gen-erator transforms the resulting visual objects into code in a lower level model-definition language. This lets DSS developers focus on decision analysis and model development rather than programming constructs— sion analysis methods include decision trees, influence diagrams,
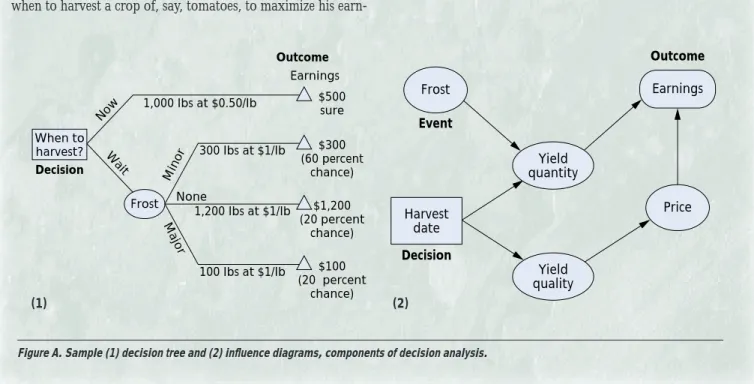
multi-attribute utility models, and the analytic hierarchy process. Figure A shows samples of the first two, the most common meth-ods employed in decision analysis. These methmeth-ods allow decision-makers to evaluate decision alternatives in terms of the trade-offs between multiple decision criteria as well as the risk and uncer-tainties associated with each alternative.
A typical decision analysis problem that involves uncertainty is the harvesting problem. In this example, a farmer must decide when to harvest a crop of, say, tomatoes, to maximize his
earn-The harvesting problem’s structure and details can be modeled as an influence diagram or as a decision tree. We can transform most influence diagrams into decision trees. A decision tree rep-resentation, however, loses the conditional probability relation-ship between variables and can quickly become very big. Influence diagrams are compact and preserve logical relationships but are unsuitable for asymmetric problems—problems whose structure does not branch out symmetrically. Asymmetric problems com-prise many useful decision analysis problems in the real world.
When to harvest? Decision Frost 1,000 lbs at $0.50/lb 300 lbs at $1/lb Outcome Earnings $500 sure $300 (60 percent chance) 1,200 lbs at $1/lb $1,200 (20 percent chance) 100 lbs at $1/lb $100 (20 percent chance) Wait Now None Minor Major Yield quantity Yield quality Harvest date Decision Price Frost Event Earnings Outcome
Figure A. Sample (1) decision tree and (2) influence diagrams, components of decision analysis.
data structures, functions, procedures—and the inter-action among them.
Required functionality
So what does a DSS generator need to do? Its func-tionality depends on what we expect the DSS to do. A DSS should have the necessary set of models, data, and user interfaces for the application in question. It must include the necessary input and output repre-sentations and control mechanisms. Thus, a DSS gen-erator should encompass
• a modeling paradigm, that is, specific methods for solving decision problems;
• model and data definition features, for defining model schemas and for entering data;
• model and data management features, including a specialized mechanism for maintaining, stor-ing, retrievstor-ing, and executing models and for defining and manipulating data;
• analytical methods and visual representations, for exploring relationships between outcome variables and various controllable variables (including decision variables and user prefer-ences) and/or uncontrollable variables that influ-ence outcomes;
• user interfaces, either general-purpose and/or the capability to create a specialized user interface; and
• model and data interchange features, for com-municating with external programs such as data-bases or external user interfaces.
Commercial products
DSS generators were primarily a theoretical con-cept in the 1980s, but several commercial products have emerged in the past few years. These products
provide a fairly comprehensive set of DSS features. We limit this discussion to products that apply decision analysis methods; an earlier survey3provides a more complete list of systems.
These products let a developer build a DSS appli-cation simply by specifying the necessary models and data. They offer a visual and/or textual language for building model schemas, features for model solution and analysis, and commands and representations for visualizing model results. They minimize development effort by offering a generic (but usually inextensible) graphical user interface, generic (but again, inexten-sible) data management features, and generalized solu-tion algorithms and analysis tools.
Using these products, someone who knows the rel-evant modeling paradigm and the problem domain can develop a DSS application in a few hours or days—a significantly shorter time than previously pos-sible. Such DSS generators are now commercially available.
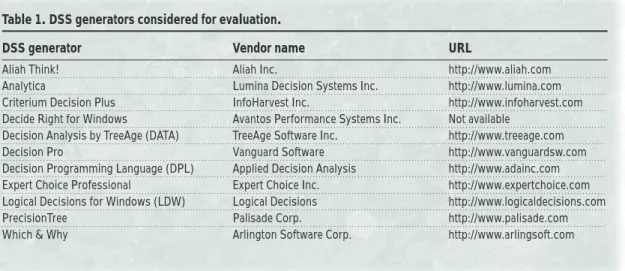
We evaluated the 11 DSS generators listed in Table 1, comparing the decision analysis methods they support and their strengths and limitations. All of them are based on one or more decision analysis methods.
EVALUATING DSS GENERATORS
When we discuss the capabilities, strengths, and lim-itations of specific products, we do so in an anecdotal sense. Our aim is to give readers concrete examples and a flavor for the features found in various systems. We organize the discussion according to DSS func-tionality.
Modeling paradigm
Decision analysis products employ two major cat-egories of methods for modeling and solving decision problems.
Table 1. DSS generators considered for evaluation.
DSS generator Vendor name URL
Aliah Think! Aliah Inc. http://www.aliah.com
Analytica Lumina Decision Systems Inc. http://www.lumina.com
Criterium Decision Plus InfoHarvest Inc. http://www.infoharvest.com
Decide Right for Windows Avantos Performance Systems Inc. Not available
Decision Analysis by TreeAge (DATA) TreeAge Software Inc. http://www.treeage.com
Decision Pro Vanguard Software http://www.vanguardsw.com
Decision Programming Language (DPL) Applied Decision Analysis http://www.adainc.com
Expert Choice Professional Expert Choice Inc. http://www.expertchoice.com
Logical Decisions for Windows (LDW) Logical Decisions http://www.logicaldecisions.com
PrecisionTree Palisade Corp. http://www.palisade.com
The first category—decision making under uncer-tainty—includes methods for dealing with uncertainty about data values, user preferences, and other aspects about the decision problem, and for analyzing deci-sion alternatives in terms of both return and risk. These methods include decision trees (employed by Decision Pro and PrecisionTree), influence diagrams (Analytica), or some proprietary variation of these. Decision Analysis by TreeAge (DATA) allows users to develop
a general influence diagram and convert it to a detailed decision tree. Decision Programming Language (DPL) provides users a way to represent problems as a hybrid of decision trees and influence diagrams.
The second category—multicriteria decision mak-ing (MCDM)—includes methods for makmak-ing trade-offs between multiple decision objectives, and for analyzing relationships between the ranking of deci-sion alternatives and importance of different decideci-sion objectives. MCDM modeling can rely on traditional methods, which include multi-attribute utility theory and analytical hierarchy process. Aliah Think!, Criterium Decision Plus, Expert Choice Professional, and Logical Decisions for Windows (LDW) employ these traditional methods. Products like Decide Right and Which & Why use proprietary variations of them.
Model and data definition
Building decision models and specifying the necessary data is the most important aspect of using a DSS gener-ator. Since the DSS generator applies its remaining func-tions (such as sensitivity analyses and the user interface mechanisms for using them) to the model schema, these functions become available without further cost once the model has been specified. Not having to provide these functions frees developers to concentrate on devel-oping the application’s model schemas.
Model schema definition. Again, the tools can be
divided along the lines of the paradigm they employ: decision making under uncertainty and MCDM.
All modern products that employ decision making under uncertainty offer a visual modeling language for model development. This means that model build-ing involves manipulatbuild-ing icons (for different types of model nodes), edges (for connecting nodes), and objects from drop-down menus. The capabilities that DSS generators provide are extremely useful: They make model development easy and also minimize typ-ing errors.
In Analytica, DSS developers can create an influ-ence diagram model by defining nodes, connecting them, and entering formulas in the appropriate boxes. To help in entering formulas, Analytica makes rele-vant variables and mathematical functions available in drop-down lists, as shown in Figure 1a.
Similarly, DATA lets DSS developers select built-in icons that represent decision nodes, chance nodes, and so on. PrecisionTree allows developers to build a deci-sion tree graphically. It also provides a spreadsheet interface for viewing and manipulating data.
Products that support multicriteria decision mak-ing also provide a visual modelmak-ing language for model development. Initially, DSS developers visually set up the hierarchy of criteria. Then they can use several visual tools and representations to rate the alterna-tives against the criteria and enter the criteria weights.
Figure 1. Model development and data input in (a) Analytica and (b) Criterium Decision Plus. In Analytica, DSS developers can drag suitable icons from the toolbar and manipulate them to build an influence diagram model. In Criterium Decision Plus, DSS developers can construct the hierarchy via graphical icons and then evaluate them via different mechanisms provided on menus.
(a)
The interface in Criterium Decision Plus, shown in Figure 1b, provides icons that DSS developers use to construct hierarchies. The generator automatically defines relevant mathematical variables and program elements such as data structures. The DSS generators automatically derive mathematical relationships and equations involving these criteria and alternatives.
All products help develop a fairly realistic and com-plex decision model within hours. They differ in the modeling paradigm they support and their modeling language. Here, a key differentiator is support for an algebraic modeling device called indexing.4Indexing lets DSS developers group a collection of objects into a class (an index or an array), define variables and mathematical relationships that apply to all index ele-ments, and declare aggregation functions (such as summation) over elements of an index variable.
Indexing structures4are very useful in mathemati-cal modeling, and their absence in most DSS generators is an important limitation. However, Analytica does explicitly support indexing in user-defined models.
Data definition.MCDM problems require
decision-makers to rate the alternatives for each criterion. Thus a DSS generator requires a user to define this data in some fashion.
In some cases, these ratings are subjective and can be entered directly. Figure 2 shows an example from Expert Choice Professional. A DSS generator can also indirectly compute a rating via a user-specified pair-wise comparison of alternatives (as in analytical hier-archy processing). In other cases, ratings may be derived as a function of available raw data values and a user-specified utility function.
Certain MCDM products (Decide Right, Which & Why, and Expert Choice Professional) accept only subjective user ratings. This restriction forces a user to implicitly determine a utility function, a limitation when measures are well defined and raw data is avail-able. Here, LDW is unique in that it supports both methods as well as other multi-attribute functions, rat-ing techniques, and elicitation tools (those that elicit user preferences).
To account for uncertainty in the decision problem, users can enter data values as single data points, tables, or as probabilistic distributions. (Commercial DSS generators support most parametric distributions.) The decision tree programs and a few of the MCDM programs accept data in this way. Analytica is dis-tinctive in its use of multidimensional tables for data entry, display, and visualization.
From a user interface perspective, most products offer visual, direct-manipulation interfaces for enter-ing model data such as probabilities, decision alter-natives, utilities, and other values. Users typically access input forms for data by navigating the corre-sponding model schema element. Figure 1 and Figure
Figure 2. Data input in Expert Choice Professional. Once the decision model is set up, users can choose several methods for weighting criteria (or for grading alternatives): a (a) matrix method, (b) graphical view, and (c) textual method.
(a)
(b)
2 both show samples of these input forms. The draw-back of this approach is that it fails to give the DSS developer a comprehensive view of the data. PrecisionTree, a spreadsheet add-in, is unique in this regard because it offers the familiar spreadsheet inter-face for data entry and manipulation.
Model and data management
Most commercial products work with one model of the decision problem at a time. Essentially, each model corresponds to a file or more than one file to store relationships, data, and so on. In this way, most products leave model management to the operating system, since only one model can be used at a time. Most don’t offer additional functionality.
Analytica, however, is one exception. Users can build models by integrating existing models as mod-ules in a “super” model. Several models can thus reuse the same modules.
Data management features within these products are fairly straightforward, and certainly less powerful than in database management systems. Data
man-agement in DSS generators doesn’t enforce database design principles such as normalization, for example. In most cases, once data is entered, it is difficult to query or extract subsets of the data.
Analytical methods and visual representation
Effective use of models involves executing them repeatedly under different data scenarios and then analyzing the sensitivity of the results from an indi-vidual execution. The DSS generators discussed here offer a rich collection of commands and generic rep-resentations for analysis.
Basic output representations and dealing with
uncer-tainty.In decision tree models, the basic output
iden-tifies the recommended decision branch and expected values (or other chosen measure) for each alternative. For example, in DATA, users simply click a “rollback” button to mark the superior decision branch on the tree (see Figure 3a). Users can deal with the uncer-tainty in input variables by using sensitivity analysis— Figure 3b displays an analysis of the probability of market behavior. Users can also have the application
Figure 3. Decision tree analysis in DATA: Results of (a) tree roll-back and (b) sensitivity analysis.
Figure 4. Different views of output in MCDM systems: In the (a) stacked bar chart (from LDW), each bar represents the score of an alternative, and stacks show the contribution from various criteria; (b) a spider chart (Aliah Think!) displays two or more alternatives based on various criteria.
(a) (b)
distribute values probabilistically. Average-, worst-, and best-case results are available. Again, once a DSS developer specifies the model schema, these capabili-ties automatically become available to users of the spe-cific DSS.
Programs for multicriteria problems typically dis-play results as a bar chart showing the relative total scores for decision alternatives. A stacked bar chart shows, for each alternative, the contribution from each criterion. Scatter diagrams and spider diagrams pro-vide additional formats for users in reviewing output. Figure 4 shows samples of two of these types of output.
Facilitating insight.An important purpose of
deci-sion support systems is to help users gain insight into the relationships among variables in the problem. Users must understand how changes in various con-trollable and/or unconcon-trollable variables influence the values of outcome variables.
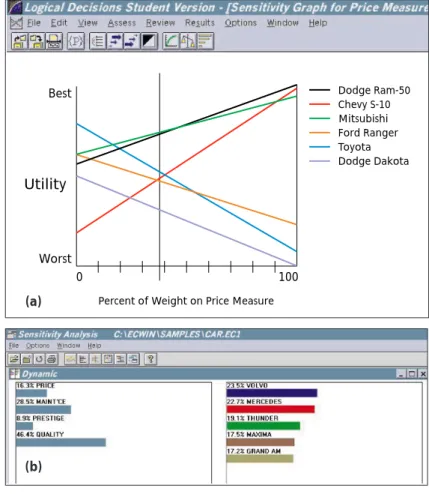
Figure 5 displays two examples involving sensitiv-ity analysis. In Figure 5a, LDW depicts the sensitivsensitiv-ity of the final score to the weight of the price criterion. The graphic also displays the rankings of the alterna-tives and the cutoff points where these rankings change.
Figure 5b helps explain the way in which Expert Choice Professional provides dynamic sensitivity analysis: As users adjust the criteria weights (by mov-ing the slidmov-ing teal bars at left), the software automat-ically updates the total scores of the alternatives (right). This gives users instant and graphical feedback on the relationship between final scores and criteria weights.
Finally in this category, we consider the output rep-resentation that Decide Right uses. As shown in Figure 6, Decide Right displays grades for each alternative for each criterion; color helps users quickly spot the com-parative strengths and limitations of each alternative. Not all people are comfortable with numbers and graphs or gleaning insight from several seemingly independent output representations. Textual out-puts—interpretations of the numbers rather than mere translations into graphs or text—would be valuable to many users. Besides, in many situations, textual output is more portable than a collection of figures. Decide Right is distinctive in its attempt to translate and interpret quantitative analysis results into a tex-tual representation.
User interfaces
The interfaces of the DSS generators we reviewed varied greatly, though most are relatively easy to learn and use. In most cases, however, and especially for complex problems, user interface design should account for at least two categories of DSS users:
• the DSS developer or analyst, who uses the gen-erator to build a specific DSS; and
• the user or decision-maker, who must use the spe-cific DSS created by the DSS developer.
You might expect user interface requirements—the representations, tools, commands, functions, and so on—to differ for these two categories of users. In addi-tion, for many applications it can be desirable to build a user flow (a sequence of operations) into the user interface. This flow would guide the user at each step, rather than allowing only a laissez-faire approach to system use.
Unfortunately, most products do not distinguish between these two user roles and instead provide a general-purpose, but inflexible, user interface. DSS developers may find the user interface unsatisfactory for some applications. If they wish to extend it or to impose a certain user flow, they have no means of doing so, unless the product offers a good macro-programming language or can interface with external programs. Even then, imposing a user flow is usually quite difficult. As a result, commercial tools often choose to have users interact with the system via the same interface as the DSS developer. Not surprisingly, this interface can be too complex for users.
Best
Worst
Utility
0 100
Percent of Weight on Price Measure
Dodge Ram-50 Chevy S-10 Mitsubishi Ford Ranger Toyota Dodge Dakota Figure 5. LDW provides (a) sensitiv-ity analysis, and Expert Choice Profes-sional provides (b) dynamic sensitivity analysis.
(b) (a)
A few products have modest tools for creating a sep-arate user interface for users. DATA, for example, lets developers provide a custom interface. Such interfaces can contain a few buttons that users can use to enter data or to choose analysis types and graphs. Thus, users do not have to learn the complete (usually com-plex) interface provided for DSS developers.
Analytica offers a simple means of generating a very basic interface containing one-click buttons to obtain results and graphs. Also, products such as Preci-sionTree operate within a spreadsheet, giving users an interface similar to the familiar spreadsheet user inter-face. In such a spreadsheet-coupled product, DSS developers also have access to all the usual spread-sheet macros and user interface design tools. These are significant advantages in creating custom inter-faces for a specific application.
Model and data interchange
It is generally not possible to export model schemas from one product to another. This is not surprising since there are no standard formats for storing model schemas for different decision analysis model types. Some products do offer a form of version support. DATA and Decide Right, for instance, allow users to save different versions of a model and then recall them later. In most products, users must use the “save as” command to save different versions of the model as different file names.
On the other hand, most products can interchange data. Most DSS generators we reviewed could import and export data as well as create ASCII data files. Some also connected to popular desktop prod-ucts such as spreadsheets and databases. These capa-bilities are useful, given the limited data design and management features in the DSS generators them-selves.
FUTURE DIRECTIONS
Future decision support systems will probably sup-port group decision making and will handle system components that are distributed over a client-server net-work. Only a few commercial products now support group decision making: Which & Why and Expert Choice Professional (via an extension called Team Expert Choice) let multiple users rank their preferences and combine these preferences into a group decision. These products also let groups assign weights to dif-ferent decision-makers. Group features can be desir-able, especially in higher level decision making, where decisions are frequently made by group consensus.
New client-server and distributed computing tech-nologies on the Web can aid the remote access of DSS generators, providing decision support on demand.5,6 Here, the user’s interface is a Web browser (the client), and separate components on a remote Web server pro-vide data and model management features. Web-enabling a DSS allows a company to share complex and expensive DSS technologies at negligible extra cost, without customization for specific operating plat-forms. A few DSS generators already offer some form of Web-based interface and most vendors are paying more attention to this area.
M
aturing DSS technologies and decision analysis methods have led to the develop-ment of DSS generators that are both usable and powerful. Yet the ultimate deployment of DSSs will depend on the ability of users to use them to their advantage. Clearly the needs of these users are important, so we are investigating this issue and have published preliminary results.7,8 Overall, we hope this article will spur the interest of IS managers, DSS vendors, researchers, and users in the use and development of DSSs and DSS generators. ❖Figure 6. Decide Right provides this window to help users understand compar-ative strengths and weaknesses of alter-natives. Color lets decision-makers see that the “State Uni-versity” is a strong choice, weak only on the “small college” criterion.
References
1. R. Sprague, “A Framework for the Development of Deci-sion Support Systems,” MIS Quarterly, June 1980, pp. 1-26.
2. A.L. Golub, Decision Analysis: An Integrated Approach, John Wiley & Sons, New York, 1997.
3. D. Buede, “Aiding Insight III,” OR/MS Today, Aug. 1996, pp. 73-79.
4. A.M. Geoffrion, “Indexing in Modeling Languages for Mathematical Programming,” Management Science, Mar. 1992, pp. 325-344.
5. H.K. Bhargava, R. Krishnan, and R. Muller, “Decision Support on Demand: Emerging Electronic Markets for Decision Technologies,” Decision Support Systems, Vol. 19, 1997, pp. 193-214.
6. S. Sridhar, “Decision Support Using the Intranet,”
Deci-sion Support Systems, Vol. 23, 1998, pp. 19-28.
7. C.L. Herrick, “A Survey of Software for Decision Analy-sis,” master’s thesis, Naval Postgraduate School, Mon-terey, Calif., Mar. 1997.
8. H.K. Bhargava, C.L. Herrick, and S. Sridhar, “Desirable Features for Decision Analysis Software,” Proc. Fourth
Conf. Int’l Soc. for Decision Support Systems, Int’l Soc.
for Decision Support Systems, pp. 41-45.
Hemant K. Bhargava is a visiting professor at the Heinz School of Public Policy and Management, Carnegie Mellon University. He is on temporary assignment away from his position as an associate professor of information technology at the Naval Postgraduate School, Monterey, Calif. His research interests include decision support systems, e-commerce, and Internet-based electronic markets for decision technologies. Bhargava has a PhD in decision sciences from The Wharton School, University of Pennsylvania. He is a member of the IEEE Computer Society, the Institute for Operations Research and the Management Sciences (INFORMS), and INFORMS’ Computing Society. Suresh Sridhar is a consultant at i2 Technologies Inc. His research interests include decision support sys-tems and distributed computing. Sridhar has a PhD degree in management information systems from Van-derbilt University. He is a member of the IEEE Com-puter Society and the ACM.
Craig Herrick is a lieutenant commander in the US Navy. His research interests include decision support and exec-utive information systems. Herrick has an MS degree in information technology from the Naval Postgraduate School. He is a member of the US Navy Supply Corps. Contact Bhargava at Carnegie Mellon University, The Heinz School of Public Policy and Management, 2109B, Hamburg Hall, Pittsburgh, PA 15213; [email protected].