eGrove
eGrove
Electronic Theses and Dissertations Graduate School
2019
Innovation, CEOs, and IPOs
Innovation, CEOs, and IPOs
Zhilu Lin
University of Mississippi
Follow this and additional works at: https://egrove.olemiss.edu/etd
Part of the Finance Commons
Recommended Citation Recommended Citation
Lin, Zhilu, "Innovation, CEOs, and IPOs" (2019). Electronic Theses and Dissertations. 1656.
https://egrove.olemiss.edu/etd/1656
This Dissertation is brought to you for free and open access by the Graduate School at eGrove. It has been accepted for inclusion in Electronic Theses and Dissertations by an authorized administrator of eGrove. For more information, please contact [email protected].
INNOVATION, CEOS, AND IPOS
Dissertation presented in partial fulfillment of requirements for the Doctor of Philosophy in Business Administration, Department of
Finance, The University of Mississippi
by ZHILU LIN
Copyright © 2019 by Zhilu Lin All rights reserve
ii ABSTRACT
In Part 1, I study if CEOs with innovative ability impose a cost upon their firms. I find that while there is a positive effect of a CEO’s innovative ability on firm innovation, the benefit is only when CEO’s innovative ability is useful for the firm. Further, firms with innovator CEOs spend more on R&D projects but with lower efficiency and hold more cash but with lower cash value compared to firms with non-innovator CEOs. These results suggest that innovator CEOs create an overinvestment problem. In Part 2, I study the effects of talent cycling on IPO long-run performance and the consequences to the IPO market. Talent cycling in initial public offerings refers to the job seeking behavior in high-tech firms where talented patent inventors leave once an IPO is successful and then pursue another job at a private firm. In my sample, I find that 36% of IPO firms have patent inventors who went to a non public firm within one year after an IPO and those inventors are the best talent in the firm. The negative side of talent cycling is that firms affected by talent cycling underperform firms unaffected by talent cycling for up to four years post IPO, while the positive side of talent cycling is the increase of the probability of an IPO in the economy. In robustness tests, I show that talent cycling is different from human capital loss and the results are robust to different time periods, such as bubble periods and hot market periods. In Part 3, I study the impact of an innovator CEO on the IPO’s underpricing, long-run performance, and post-IPO innovation. I find that since CEOs’ innovative ability can reduce the information asymmetry in the IPO market, firms led by innovator CEOs experience lower first-day return (less underpricing) compared to firms led by non-innovator CEOs. Firms with
iii
innovator CEOs have greater IPO long-run performance compared to firms with non-innovator CEOs. I also find that firms with innovator CEOs have more firm innovation up to four years after the IPO compared to firms with non-innovator CEOs.
iv DEDICATION
This dissertation is dedicated to my fiancé, who encouraged and supported me through this process, and to my parents who have always motivated me to always give my best effort.
v
ACKNOWLEDGEMENTS
I express my deepest gratitude to my dissertation chair, Dr. Kathleen Fuller, and to my committee members, Dr. Robert Van Ness, Dr. Andrew Lynch, and Dr. Cheng Cheng, for their guidance, help, and support through this process.
vi
APPENDIX OF CONTENTS
ABSTRACT ... ii
DEDICATION ... ii
ACKNOWLEDGEMENTS ... v
PART1: CEOS WITH INNOVATIVE ABILITY ... 1
I. INTRODUCTION ... 2
II. HYPOTHESES DEVELOPMENT ... 8
III. SAMPLE CONSTRUCTION, VARIABLE MEASUREMENTS AND SUMMARY STATISTICS ... 11
IV. INNOVATOR CEO AND FIRM INNOVATION ... 20
V. INNOVATOR CEO AND FIRM CASH HOLDINGS ... 31
VI. LONG-RUN EFFECTS ... 34
VII. ROBUSTNESS TESTS ... 36
VIII. CONCLUSION ... 41
REFERENCES ... 42
APPENDIX ... 48
PART2: TALENT CYCLING IN IPOS ... 90
vii
II. SAMPLE CONSTRUCTION AND VARIABLE MEASUREMENTS ... 97
III. IPO UNDERPERFORMANCE ... 105
IV. THE ECONOMIC BENEFITS OF TALENT CYCLING IN IPO ... 114
V. ENDOGENEITY ISSUE ... 115
VI. ROBUSTNESS ... 119
VII. CONCLUSION ... 121
REFERENCES ... 123
APPENDIX ... 127
PART 3: INNOVATOR CEOS IN IPOS ... 170
I. INTRODUCTION ... 171
II. HYPOTHESES DEVELOPMENT ... 175
III. SAMPLE CONSTRUCTION, VARIABLE MEASUREMENTS AND SUMMARY STATISTICS ... 179
IV. IPO UNDERPRICING ... 188
V. IPO LONG-RUN PERFORMANCE ... 189
VI. POST-IPO FIRM INNOVATION... 196
viii
VIII. CONCLUSION ... 201
REFERENCES ... 202
APPENDIX ... 207
ix
LISTS OF APPENDICES
PART 1. CEOS WITH INNOVATIVE ABILITY ... 1
1. YEAR AND INDUSTRY DISTRIBUTION ... 49
2. SUMMARY STATISTICS ... 52
3. INNOVATOR CEOS AND FIRM'S INNOVATION ... 54
4. INNOVATOR CEOS AND FIRM'S INNOVATION 2SLS RESULTS ... 57
5. INNOVATOR CEOS AND FIRM'S INNOVATION PROPENSITY SCORE MATCHING RESULTS ... 60
6. EFFECT OF INDUSTRY INNOVATIVENESS ... 62
7. THE USEFULNESS OF CEO’S INNOVATIVE ABILITY TO THE FIRM ... 64
8. INNOVATOR CEOS AND FIRM'S R&D SPENDING ... 67
9. INNOVATOR CEOS AND FIRM'S INNOVATION EFFICIENCY ... 69
10. INNOVATOR CEO AND FIRM CASH HOLDINGS ... 72
11. INNOVATOR CEO AND CASH VALUE ... 74
12. INNOVATOR CEO AND LONG-RUN STOCK PERFORMANCE... 76
13. INNOVATOR CEOS AND LONG-RUN FIRM'S INNOVATION ... 78
x
15. INNOVATOR CEOS AND NEW PRODUCT ANNOUNCEMENT ... 83
16. INNOVATOR CEO, CEO PAST WORKING EXPERIENCE AND GENERAL ABILITY INDEX ... 85
17. EFFECT OF INDUSTRY INNOVATIVENESS NOT INCLUDING HIGH-TECH INDUSTRY ... 88
PART 2: TALENT CYCLING IN IPOS ... 90
1. FREQUENCY DISTRIBUTION BY IPO YEAR AND INDUSTRY IN FIRM LEVEL ... 128
2. FREQUENCY DISTRIBUTION BY YEAR IN INVENTOR LEVEL ... 131
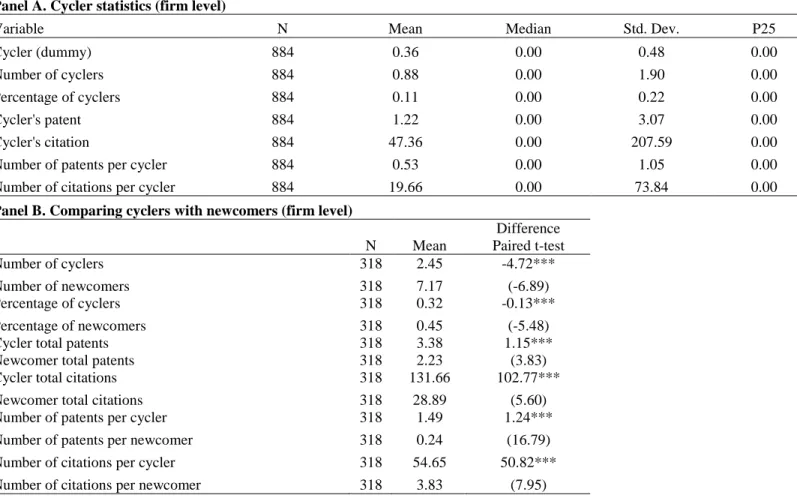
3. CYCLER CHARACTERISTICS ... 133
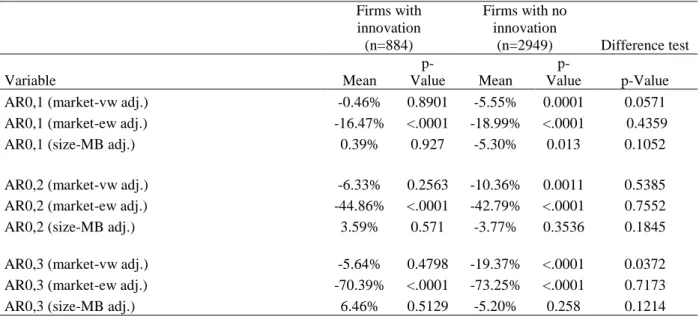
4. ABNORMAL RETURNS ... 136
5. SUMMARY STATISTICS FOR CONTROL VARIABLES ... 139
6. MULTIVARIATE REGRESSION EXPLAINING IPO LONG-RUN PERFORMANCE ... 141
7. CALENDAR-TIME FACTOR MODEL REGRESSIONS ... 149
8. CALENDAR-TIME FACTOR MODEL REGRESSIONS PURGED IPO AND SEO FIRMS... 152
xi
10. PROPENSITY SCORE MATCHING RESULTS... 158
11. ROBUSTNESS TESTS ... 160
12. CUMULATIVE ABNORMAL RETURN ... 165
PART 3. INNOVATOR CEOS AND IPOS ... 170
1. YEAR AND INDUSTRY DISTRIBUTION ... 208
2. SUMMARY STATISTICS ... 211
3. INNOVATOR CEOS AND IPO UNDERPRICING ... 213
4. BUY-AND-HOLD ABNORMAL RETURNS... 215
5. CALENDAR-TIME FACTOR MODEL REGRESSIONS ... 217
6. MULTIVARIATE REGRESSION EXPLAINING IPO LONG-RUN PERFORMANCE ... 219
7. INNOVATOR CEOS, HIGH-TECH INDUSTRY, AND FIRMS POST-IPO PERFORMANCE ... 221
8. INNOVATOR CEOS AND POST-IPO FIRM INNOVATION ... 223
1
2
I. INTRODUCTION
In the last 50 years, many successful businesses have been led by creative genius
entrepreneurs. Islam and Zein (2018) find that innovator CEOs increase firm innovation for high-tech firms. Yet, Michael Jeffries, the former CEO of Abercrombie & Fitch (A&F), has five patents and was considered one of the greatest CEOs in retail history.1. Jeffries became the CEO of A&F in 1992. During his tenure, A&F’s stock price increased from initial offer price of $16 per share in October 1996 to an all-time high of $84.23per share by October 2007. However, by November 2008 A&F stock price had dropped to a low of $14.64. In 2014 Jeffries finally stepped down as CEO and was blamed for the 11 straight quarters of negative company comparable-store sales.2 Upon announcement of Jeffries stepping down, A&F stock price jumped 8%, the biggest one-day price gain in the past nine months. The Jeffries-A&F example raises several questions. Do innovator CEOs matter for less innovative industries? Is there cost of having an innovator CEO? Why might there be costs to having an innovator CEO? This paper examines these questions.
Innovation has long been recognized as important because innovation plays a critical role in promoting economic growth (Solow, 1957) and increases the probability of a firm’s survival (Cefis and Marsili, 2006). Since the CEO is the most important person in an organization (Ireland and Hitt, 1999) and research and development (R&D) spending is one of the most
1https://www.salon.com/2006/01/24/jeffries/
2 https://www.bloomberg.com/news/articles/2014-12-09/abercrombie-fitch-ceo-mike-jeffries-to-step-down-immediately
3
fundamental investment decisions made by firms (Barker and Mueller, 2002), it follows that motivating the CEO to pursue firm innovation is an important area of research. Literature shows that extrinsic motivations of a CEO pursuing firm innovation, such as standard
pay-for-performance contracts, do not encourage innovation in a firm (Manso, 2011), and pay-for- performance-contingent financial incentives can even inhibit innovation (Ariely, Gneezy and Loewenstein, 2009; Hellmann and Thiele, 2011; Ederer and Manso, 2013). However, intrinsic motivations of CEOs pursuing firm innovation, such as their age, education and tenure, can foster innovation in a firm (Barker and Mueller, 2002; Wu, Levitas and Priem, 2005). A large literature in economics of science shows that people are attracted to pursue innovation by the explicit economic
incentives, but by their intrinsic motivation, such the personal taste for science and the intellectual challenge associated with scientific work (e.g., Sauermann and Cohen, 2010). Sunder, Sunder and Zhang (2017) examine the intrinsic motivations by looking at the role of the CEO’s personality traits of sensation-seeking on firm’s innovation. They find that CEOs with pilot licenses are associated with more firm innovation.
To examine the effects of a CEO’s innovative ability on a firm’s innovation, I use patents and citations to measure a CEO’s innovative ability. Using a sample of 2,134 U.S. public firms and 3,952 CEOs from 1992 to 2008 from all industries,3 I find that firms with innovator CEOs
who have at least one patent experience more innovation compared to firms with non-innovator CEOs. CEOs with greater innovative ability spur more innovation to firms. However, CEOs with innovative ability in the innovative industry lower firm innovation compared to less innovative industry, suggesting the potential overinvestment problem. Innovator CEOs spur firm innovation only when CEOs’ innovation is useful for the firm. That is, a CEO’s innovative ability impacts
4
firm’s innovation only when the CEO’s patent and the firm belong to the same industry
classification. I also find that the effect of innovator CEOs on firm stock performance and firm innovation is a long-run effect. Specifically, firms with innovator CEOs have greater abnormal buy-and-hold stock return starting the third year of hiring innovator CEOs compared to firms with non-innovator CEOs. CEOs’ innovation ability can impact firm innovation in the long-run but the effects of CEOs’ innovative ability on firm innovation decrease over time.
However, such characteristics that benefit corporate innovation may not be without a cost. Prior research finds that a CEO’s personal characteristics can lead to distortions in corporate investment policies (Malmendier and Tate, 2005a; Malmendier and Tate, 2005b), overinvestment problems (Campbell, Gallmeyer, Johnson, Rutherford and Stanley, 2011) or value-destroying investments (Goel and Thakor, 2008). If CEOs with innovative ability have passion and interests in investing in innovation, they might pursue their own interests and overinvest in R&D projects. Agency theory also suggests that CEOs may overinvest to build excessive empires (Jensen and Meckling, 1976; Jensen 1986) and entrench themselves (Shleifer and Vishny, 1989) if they pursue their own interests. Bebchuk and Stole (1993) build a
theoretical model and assume that the market has incomplete information about the investment returns, and if managers signal the market, the investors can observe the level of investments. They find that when the investors can only observe the level of the investments, overinvestment will occur in the firms. Therefore, CEOs with innovative ability may be more likely to signal investment opportunities to the market, and firms led by innovative CEOs are more likely to have overinvestment problems.
I study the potential overinvestment problems that are brought by innovator CEOs. Findings indicate that firms with innovator CEOs spend more on R&D projects, but this R&D
5
funding is used less efficiently than firms with non-innovator CEOs. The results are consistent with agency theory that innovator CEOs have overinvestment problems. To examine how these agency conflicts are manifested in other corporate policies, I further examine the level of cash holding and the value of cash holdings for firms with innovator CEOs.4 I find that firms led by innovator CEOs hold more cash than firms led by non-innovator CEOs but the cash value is lower. Overall, the results suggest that while innovator CEOs spur greater firm innovation, they also tend to overinvest in innovation. These results are robust to the alternative CEOs’ innovative ability measure, firm innovation measure, and alternative CEO ability measures, such as CEO’s past industry working experience and CEO’s general ability index.
One significant concern with looking at CEOs with innovative ability is that innovative firms are more likely to hire CEOs with greater innovative ability, which begs the question of whether the results are driven not by CEOs’ innovative ability itself, but other omitted
characteristics that are associated with innovative firms themselves. To address the potential endogeneity, I employ three methods. First, I use two-stage least square (2SLS) regression with the CEO coauthors’ ability as an instrumental variable. The CEO coauthors’ ability is a valid instrumental variable since the CEO coauthors’ ability is related to a CEO’s innovative ability and affects firm’s innovation only through the CEO’s innovative ability. Second, I apply a difference-in-difference methodology using CEO exogenous turnover as a shock.5 Third, I use the propensity score matching method. Regardless of the methodology used, results indicate that a CEO’s innovative ability has a positive impact on firm’s innovation.
4 Cash value captures the value that shareholders place on an extra dollar of cash held by firms. 5 The results for the difference-in-difference methodology is in the appendix.
6
This paper is related to two other papers: Makri and Scandura (2010) and Islam and Zein (2018). Makri and Scandura examine the effects of creative CEO leadership on innovation. They find that creative leadership has a positive impact on the quality and quantity of firm innovation. My paper differs from Makri and Scandura and Islam and Zein in two ways. First, Makri and Scandura use CEO interviews and code information pertaining to leadership style, emphasizing developing social and human capital, as a proxy for CEO creative characteristics. This paper uses the number of patents and citations to directly quantify CEOs’ innovative ability. While Islam and Zein (2018) define innovation using CEO patents, they emphasize the first-hand innovation experience of inventor CEOs and define “an inventor CEO” as one that has been awarded at least one patent. In addition to using Islam and Zein’s definition, I focus on measuring the innovation ability of CEOs by counting patents and citations in each year, up to a given year or in the sample period. This allows me the test the incremental benefits or costs of CEOs’ innovative ability within the firm. Second, Makri and Scandura (2010) and Islam and Zein (2018) only examine CEOs in the high-tech industry. My sample includes firms from all industries. This allows me to examine if the effect of CEOs with innovation ability on firm’s innovation is greater when the firms are in the industries that need innovation the most. Most importantly, this paper is addressing the potential costs, not just the benefits, of having an innovator CEOs.
This paper contributes to the literature in mainly three ways. First, this paper is
complementary to a growing body of literature that explores the effects of CEOs on corporate innovation. Barker and Mueller (2002) study the impact of CEO characteristics on firm’s R&D spending; Custodio, Ferreira and Matos (2017) investigate whether general managerial skills spur innovation; Galasso and Simcoe (2011) study CEO overconfidence and firm innovation; and Sunder, Sunder and Zhang (2017) examine the effect of CEO sensation seeking on firm
7
innovation. I add to this literature by showing that CEOs’ innovative ability is a significant driver of corporate innovation, albeit at the cost of overinvestment, reduced innovative efficiency, and excessive cash holdings.
Second, this paper also complements the literature that studies the impact of CEO
characteristics on the distortions in corporate investment decisions (Malmendier and Tate, 2005a; Malmendier and Tate, 2005b; Campbell, Gallmeyer, Johnson, Rutherford and Stanley, 2011; Goel and Thakor, 2008). Weisbach (1995) examines the impact of CEO turnover on firm’s investment decisions; Bebchuk and Stole (1993) study CEO investment decisions in the presence of imperfect information; and Malmendier and Tate (2005a) investigate the effect of CEO
overconfidence on corporate investment. I show that CEOs’ innovative ability and intrinsic incentives for innovation can also distort corporate investments. Third, this paper uses a new proxy of CEO’s ability that can affect firm’s innovation: CEO patents and citations. This new proxy is a more direct and effective measure of a CEO’s innovative ability compared to the current proxies (e.g. CEO’s education and general ability index (Custodio, Ferreira and Matos, 2017)).
8
II. HYPOTHESES DEVELOPMENT
Ever since Schumpeter (1911), one of the most influential economists of the 20th century, proposed that technological innovation is the cause of economic growth, the effect of innovation on firms’ performance has been studied extensively (Pakes, 1985; Austin, 1993; Nicholas, 2008; Kogan, Papanikolaou, Seru and Stoffman, 2017). For example, Hall, Jaffe and Trajtenberg (2005) find that innovation, measured by patents and citations, significantly positively affects the firm’s market value and one extra citation of a patent increases the firm market value by three percent.
In addition to the importance of innovation on the firm’s performance, researchers document that innovation is affected by stock liquidity (Fang, Tian and Tice, 2014), shareholder protection laws (Brown, Martinsson and Petersen, 2013), antitakeover laws (Atanassov, 2013), banking competition (Cornaggia, Mao, Tian and Wolfe, 2015), corporate venture capital
(Chemmanur, Loutskina and Tian, 2014), analyst coverage (He and Tian, 2013) and institutional ownership (Aghion, Van Reenen and Zingales, 2013). However, innovative work is person centered (Mumford, Scott, Gaddis and Strange, 2002). Innovative people, the most direct influence of firm’s innovation, are seldom studied. Moreover, innovative work often needs collaboration among people (Abra, 1994; Cagliano, Chiesa and Manzini, 2000) and interaction between employees and leaders (Pelz, 1963; Tierney, Farmer and Graen, 1999).6 Furthermore,
6 Specifically, Tierney, Farmer and Graen (1999), focusing on 191 R&D employees of a large chemical company, find that the interactions between employee intrinsic motivation and leader intrinsic motive is related to employee creative performance.
9
Mumford, Marks, Connelly, Zaccaro and Reiter-Palmon (2000) point out that organizational leaders must appraise the works of innovative people. It would be difficult to evaluate the innovative ideas if the leader lacks expertise or creative skills (Mumford, Scott, Gaddis and Strange, 2002). Therefore, the CEO, the leader of the organization and in charged with
motivating employees and driving changes within the organization, with innovative ability will improve a firm’s innovation. Islam and Zein (2018) also find that innovator CEOs impact firm innovation for high-tech industry.
Hypothesis 1: A CEO’s innovative ability has a positive effect on the firm’s innovation for all the industries.
Mumford (2000) and Redmond, Mumford and Teach (1993) find that CEOs play a key role on helping innovative people in the firm meet organizational needs and goals, and further CEO expertise and innovative skills are more important when the firm’s tasks become more complex (Mumford, Scott, Gaddis and Strange, 2002). Thus, the effect of CEOs with innovative ability on firm’s innovation and performance should be larger on firms that need CEOs with innovative ability the most. Moreover, Brown, Fazzari and Peterson (2009) document that the young high-tech industry accounts for about 75% of the entire U.S. R&D boom, indicating the importance of innovation to high-tech industry.
Hypothesis 2: The effect of a CEO’s innovative ability is larger on the innovative industry compared to the less innovative industry.
According to agency theories, when CEOs pursue their own interests, the CEOs will overinvest to build excessive empires (Jensen and Meckling, 1976; Jensen 1986). Also, CEOs are interested in investments that require their own specific skills, and making such investments
10
can entrench them since it is costly for shareholders to replace them (Shleifer and Vishny, 1989). Xuan (2009) also finds that firms with specialist CEOs have a lower investment efficiency.7
Therefore, firms with innovator CEOs might have a lower innovation efficiency.
Hypothesis 3: Firms led by innovator CEOs have a lower innovation efficiency.
The value of holding cash is to allow a firm to undertake valuable projects when they are available (Almeida, Campello, and Weisbach, 2004; Han and Qiu, 2007). Since firms with innovator CEOs are more likely to invest in R&D projects (Makri and Scandura, 2010), I expect firms led by innovator CEOs to hold more cash compared to firms led by non-innovator CEOs. Moreover, since holding more cash can allow CEOs to invest in projects that offer non-pecuniary benefits but jeopardize shareholder’s value (Jensen and Meckling, 1976), according to agency theory, I expect firms with innovator CEOs to hold more cash but have a lower cash value compared to firms with non-innovator CEOs.
Hypothesis 4: Firms led by innovator CEOs hold more cash compared to firms led by non-innovator CEOs but have a lower cash value.
7 Xuan (2009) study the job histories of CEOs and define a specialist CEO as a CEO advanced through the ranks from certain divisions in the firm.
11
III. SAMPLE CONSTRUCTION, VARIABLE MEASUREMENTS AND SUMMARY STATISTICS
SAMPLE CONSTRUCTION
The data is collected from several difference sources. CEO characteristics are from ExecuComp, which provides names, title, and compensation related information for S&P 1500 firms starting from 1992. Firm financial information is from Compustat, stock returns are from Center for Research in Security Prices (CRSP), and firm patent data is provided by Kogan, Papanikolaou, Seru and Stoffman (2017) from 1975 to 2010. According to Hall, Jaffe,
Trajtenberg (2001), there is a 2-year lag on average between a patent’s application date and grant date with patents being granted eventually. Since the actual timing of innovation is closer to the date of application, I use the application year as the relevant year to match this patent dataset with other datasets and end my sample period in 2008. As a result, my sample period is from 1992 to 2008.
Following many existing studies on innovation (e.g. Sunder, Sunder and Zhang, 2017), I exclude financial and utilities firms. I then include all the other industries where the average number of patents per firm is at least one. This restriction allows the sample to include firms with zero patents but at the same time excludes industries where innovation is not relevant. The resulting sample includes 2,134 firms and 3,952 CEOs from 1992 to 2008.
12
VARIABLE MEASUREMENTS
This subsection defines the independent variable, dependent variable and control variables.
MEASURING CEOS’ INNOVATIVE ABILITY
To identify innovator CEOs, I first obtain a list of CEO names from ExecuComp database, which includes the top paid executives of S&P 1500 firms. Then, I merge CEOs’ names with patent inventors’ names by their first, middle and last name. The data for patent inventors comes from Harvard Business School (HBS) patenting database constructed by Li, Lai, D’Amour, Doolin, Sun, Torvik, Amy and Fleming (2014). HBS patenting database provides unique identifiers (variable: Invnum_N) for each patent’s inventors from 1975 through 2010. Although CEO’s name is matched to inventor’s name, there is still a possibility that the CEO and the inventor are not the same person but just have the same name. In some cases, the CEO’s name can be matched to several unique inventors because of the same name. Therefore, I hand collect biographical information to ensure I am accurately matching CEOs with inventors.
The HBS patenting database contains inventor’s patent assignee names, and ExecuComp contains CEO’s company name. If the inventor’s patent assignee name and CEO’s company name are the same, it is a one-to-one match, and I identify the patent inventor and the CEO as the same person. If the inventor’s patent assignee name and CEO’s company name are not the same, it is not a one-to-one match. In this case, I search for the CEO’s biographical information on the
13
internet.8 If the CEO’s past working company name is the same as the inventor’s patent assignee name, then I identify the patent inventor and the CEO as the same person. Sometimes, the CEO’s biography directly indicates that the CEO invented patents. In that case, I identify the CEO as the patent inventor even though the CEO never worked for the patent assignee.9 Using this process, my sample has 340 CEOs who are patent inventors (innovator CEOs) and 3,612 CEOs who are not patent inventors.10
Since HBS patenting database provides each patent’s citations,11 I construct eight metrics
to measure CEOs’ innovative ability in order to measure the quantity and quality of their
innovative ability. The first measure (variable: Innovator CEO) is a dummy variable equal to one if the CEO had any patents during 1975 to 2010.12 Based on this measure, there are 340
innovator CEOs in the sample. The second measure (variable: CEO patent) counts the number of patents the CEO applied for in a given year.13 The third measure (variable: CEO citation) counts the number of citations subsequently received by the patents applied for in a given year. Patent citations measure the quality of the patent capturing the technology and economic importance.
8 I first look up the websites providing the most credible and accurate information about the CEO. The first type of websites is the company website, Bloomberg CEO Biography and Wikipedia. If the CEO’s biography cannot be found on those websites, I will go to other website to find CEO biography. For example, Notable Names Data Base, LinkedIn, news information and Forbes website.
9 This is because the inventor sold the patent to the assignee. Therefore, the patent belongs to the assignee but the inventor never worked for the assignee.
10 I successfully identified 366 CEOs who are patent inventors, but after merging the CEOs database with other databases, only 340 innovator CEOs were left in the sample.
11 HBS patenting database provides design patents as well as utility patents. According to U.S. Patent and Trademark Office (USPTO), “a utility patent protects the way an article is used and works, while a design patent protects the way an article looks”. Specifically, the utility patent is a trademark protection that makes sure a person has full control over his or her invention. A design patent is used when a person creates a new design for an existing product. However, the NBER patent database and Kogan, Papanikolaou, Seru and Stoffman (2017) dataset only provide utility patents. The NBER patent database provides inventor information only from 1975 to 1999 and does not provide inventor unique identifier. Kogan et al. dataset does not contain the patent inventors’ information. 12 Even though my sample period is 1992 to 2008, the HBS patent database has information from 1975 to 2010. So if a CEO had a patent in 1985, I recognize this CEO as an innovator CEO.
13 Patents applied for are generally granted with a two years lag. Thus, date of application is closer to the actual timing of innovation than the patent grant date (Hall, Jaffe and Trajtenberg, 2001).
14
The fourth measure (variable: CEO avg. citation) is the ratio of CEO citation to CEO patent in a given year. The second, third and fourth measurements capture CEO’s innovative ability in each year. However, CEOs’ innovation ability is also reflected by their past innovation record. When a new CEO is announced, the stock market valuing the CEO’s innovative ability will be based on the CEO’s cumulative innovation record, not just one year. Therefore, the fifth, sixth and seventh measurements of CEOs’ innovation ability are cumulative measures. The fifth measure (variable: CEO cumulative patent) is the cumulative number of patents up to that year starting the year the first patent was applied for and the sixth measure (variable: CEO cumulative citation) is the cumulative number of citations received by the patents up to that year starting the year the first patent was applied for. The seventh measure (variable: CEO cumulative avg. citation) is the ratio of CEO cumulative citation to CEO cumulative patent. The last measure (variable: CEO total avg. citation) is the ratio of CEO total citation over CEO total patent in the sample period. I only present the results using the first and seventh measures, innovator CEO and CEO cumulative average citation.
MEASURING FIRM’S INNOVATION
I measure firm innovation using data from Kogan et al. (2017),14 which reports all utility
patents issued by U.S. Patent and Trademark Office (USPTO). This patent database provides each patent assignee’s CRSP unique identifier (variable: PERMNO), the citations received by each patent, the estimated value of the patent in nominal dollars, the patent’s class, the
application date and the grant date.
15
I use five metrics measuring the firm’s patenting activity as proxies for the firm’s innovation productivity. The first measure (variable: Firm patent) is a simple count of the number of patents the firm applied for in a given year. In order to capture the variation of the patent’s technology importance, the second measure (variable: Firm citation) counts the number of citations subsequently received by the patents that the firm applied for in a given year. I log the first two measures due to the skewness distribution. The third measure (variable: Firm avg. citation) is the ratio of firm citation over firm patent in a given year.
In order to further capture the variation of the patent’s technology importance and adjust for citation truncation lags (Hall, Jaffe, Trajtenberg, 2005), I follow Kogan et al. (2017) to construct the fourth measure (variable: Citation-weighted firm innovation) using this metric,
𝜔𝑖,𝑡 = ∑ (1 + 𝐶𝑗 𝐶̅𝑗) , 𝑗∈𝑃𝑖,𝑡
(1)
where 𝐶̅𝑗 is the average number of citations received by the patents that were granted in the same year as patent j, 𝐶𝑗 is the number of citation received by patent j, 𝑃𝑖,𝑡 is the set of patents issued to firm i in year t, and 𝜔𝑖,𝑡 is the sum of the weight of citations on each patent plus one for firm i in time t. Since 𝜔𝑖,𝑡 is increasing in firm size (Kogan et al., 2017), 𝜔𝑖,𝑡 is scaled by book assets,
𝑊𝑖,𝑡𝑐𝑤= 𝜔𝑖,𝑡 𝐵𝑖,𝑡 , (2)
where 𝐵𝑖,𝑡 is book assets of firm i in year t, and 𝑊𝑖,𝑡𝑐𝑤 is the citation-weighted innovation for firm
i firm in time t.
Citations value the scientific contribution of the patents but not necessarily the value added by the patents. For example, a firm invents a patent that generates only a few citations, but
16
that patent restricts the development of its competitors. The patent will have a large value impact. Thus, the last measure of firm innovation (variable: Market-value firm innovation) uses the patents’ private economic value. Following Kogan at el. (2017), market-value firm
innovation is constructed using the stock market response to news about the patents.15 The total dollar value of innovation produced by firm i in year t is equal to the sum of all the values of patents j granted to that firm,
𝜃𝑖,𝑡 = ∑ 𝑥𝑗 𝑗∈𝑃𝑖,𝑡
, (3)
where 𝑥𝑗 is the dollar value of patent j, and 𝜃𝑖,𝑡 is the total dollar value of patents applied by firm
i in year t. Similar to citation-weighted firm innovation, market-value firm innovation is standardized by book assets,
𝑊𝑖,𝑡𝑚𝑣 = 𝜃𝑖,𝑡 𝐵𝑖,𝑡 , (4)
where 𝑊𝑖,𝑡𝑚𝑣 is the market-value firm innovation.
CONTROL VARIABLES
In order to investigate the effect of an innovator CEO on firm’s innovation, other factors that would affect a firm’s innovation must be controlled. In the regression, I control for time-varying firm characteristics and CEO specific variables. Following the innovation literature, controls include firm size, defined as the nature logarithm of total assets, capital intensity,
15 Kogan at el. (2017) provides the dollar value of each patent based on the stock market response to news about the patents.
17
defined as the nature logarithm of the ratio of net property, plant, and equipment divided by the number of employees, stock return, defined as the firm’s buy-and-hold return over the fiscal year, and Tobin’s Q, defined as the natural log of the ratio of market value of assets to book value of assets.
CEO specific variables include CEO tenure, defined as the number of months a CEO is in the firm, CEO age in years, the delta of the CEO’s stock and option portfolio (a proxy for CEO pay-performance sensitivity) and the vega of the CEO’s stock and option portfolio (a proxy for CEO risk taking incentives). The calculation method for delta and vega is proposed by Core and Guay (2002), and the data for delta and vega is provided by Coles, Daniel and Naveen (2006). The delta is defined as the dollar change in CEO stock and option portfolio for 1% change in stock price, and the vega is defined as the dollar change in CEO option holdings for 1% change in stock return volatility. I also control for year fixed effects, industry fixed effects and firm fixed effects. All control variables are lagged by one year.
SUMMARY STATISTICS
Table 1 presents the distribution of innovator CEOs by year and by industry. Panel A displays the percentage of innovator CEOs in the sample by year. On average, 9.9% of CEOs in the sample are patent inventors. The percentage of innovator CEOs ranges from 6.8% (1993) to 11.7% (1999). The percentage of innovator CEOs is higher during the technology bubble period, suggesting firms in the technology industry are more likely to have innovator CEOs. Panel B tabulates the percentage of innovator CEOs by Fama and French 12 industry groups excluding
18
financial firms and utilities.16 Business equipment has the highest percentage of innovator CEOs (17.0%), followed by consumer durables (15.0%) and health (14.3%).17 Panel C shows the
percentage of innovator CEOs in the sample by high-tech industry following the categorization in Loughran and Ritter (2004).18 High-tech industries have 18.0% of innovator CEOs compared to 7.6% in non-high-tech industries.
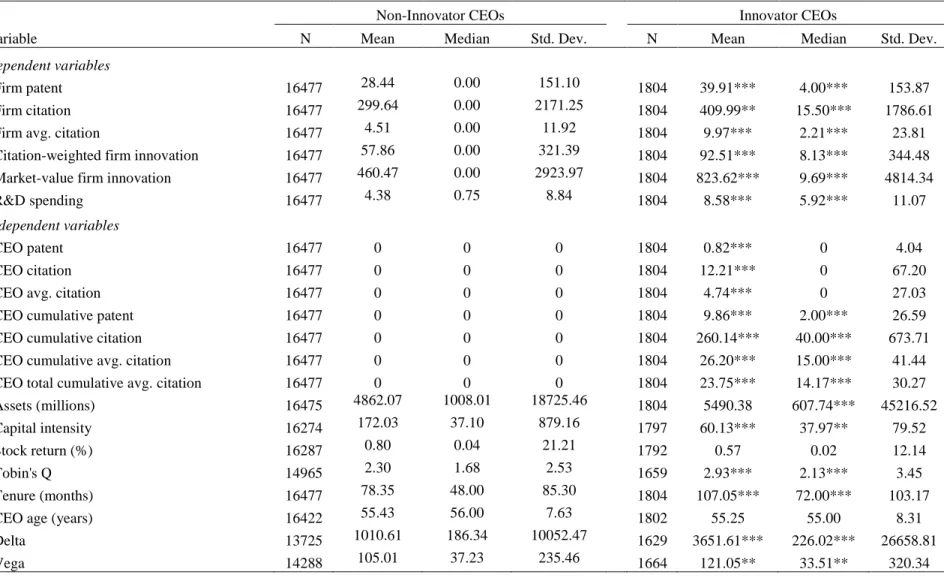
Table 2 provides summary statistics of dependent variables and independent variables in the regressions. I divide the sample into two subsamples, non-innovator CEOs and innovator CEOs, and report the means, medians, and standard deviations for the variables used in the regressions.19 T-tests (Wilcoxon-Mann-Whitney tests) are also conducted to test for differences between the means (medians) for firms with innovator CEOs and non-innovator CEOs. As expected, firms with innovator CEOs have more patents, citations, average citations per patent, citation-weighted firm innovation and market-value firm innovation than firms with non-innovator CEOs. The differences on mean and median are both statistically significant. Also, firms with innovator CEOs spend a higher proportion of R&D over total assets than firms with non-innovator CEOs.
Examining innovator CEO’s innovative ability, I find that on average, innovator CEOs have 0.82 patents and 12.21 citations per year, and cumulative 9.86 patents and 260.14 citations
16 The Fama and French indsutries are defined in Fama’s website.
http://mba.tuck.dartmouth.edu/pages/faculty/ken.french/data_library.html#Research
17 The Business Equipment industry might not have the highest percentage of innovator CEO since I exclude some sub-industries where the average patent per firm is less than one.
18 In Loughran and Ritter (2004) appendix D, high-tech stocks are defined as those in SIC codes 3571, 3572, 3575, 3577, 3578 (computer hardware), 3661, 3663, 3669 (communications equipment), 3671,3672, 3674, 3675, 3677, 3678, 3679 (electronics), 3812 (navigation equipment), 3823,3825,3826,3827,3829 (measuring and controlling devices), 3841, 3845 (medical instruments), 4812, 4813 (telephone equipment), 4899 (communications services), and 7371, 7372, 7373, 7374, 7375, 7378, and 7379 (software).
19 The summary statistics of dependent variables and independent variables in the regressions for the full sample are in the apendix Table 1A.
19
up to a given year. Comparing the firm characteristics for firms led by innovator CEOs and those led by non-innovator CEOs, I find that firms with innovator CEOs are smaller in size and have less capital intensity and higher Tobin’s Q on average. There is no significant difference in stock return for firms with innovator CEOs and firms with non-innovator CEOs. Further, innovator CEOs have longer tenure, and higher delta and vega values in their compensation packages than non-innovator CEOs. There is no significant difference in inventor CEO age and non-inventor CEO age.
20
IV. INNOVATOR CEO AND FIRM INNOVATION
In this section, I first examine the effect of CEOs with innovative ability on firm
innovation controlling for endogeneity problem. Then, I study the industry innovativeness. Next, I examine how innovator CEOs spur firm innovation and the innovation efficiency in the firm with innovator CEOs.
PATENTING ACTIVITY OLS RESULTS
Table 3 presents the effects of innovator CEOs on firm’s innovation. The regression model follows: 𝐹𝑖𝑟𝑚 𝑖𝑛𝑛𝑜𝑣𝑎𝑡𝑖𝑜𝑛𝑖,𝑡+1 = 𝛼1+ 𝛽1𝐶𝐸𝑂 𝑖𝑛𝑛𝑜𝑣𝑎𝑡𝑖𝑣𝑒 𝑎𝑏𝑖𝑙𝑖𝑡𝑦𝑖,𝑡+ 𝛽2𝐿𝑜𝑔(𝑎𝑠𝑠𝑒𝑡𝑠)𝑖,𝑡 + 𝛽3𝐿𝑜𝑔 (𝑐𝑎𝑝𝑖𝑡𝑎𝑙 𝑖𝑛𝑡𝑒𝑛𝑠𝑖𝑡𝑦)𝑖,𝑡+ 𝛽4𝑆𝑡𝑜𝑐𝑘 𝑟𝑒𝑡𝑢𝑟𝑛𝑖,𝑡+ 𝛽5𝑇𝑜𝑏𝑖𝑛′𝑠 𝑄𝑖,𝑡 + 𝛽6𝐿𝑜𝑔 (1 + 𝑡𝑒𝑛𝑢𝑟𝑒)𝑖,𝑡+ 𝛽7𝐶𝐸𝑂 𝑎𝑔𝑒𝑖,𝑡+ 𝛽8𝐿𝑜𝑔 (1 + 𝑑𝑒𝑙𝑡𝑎)𝑖,𝑡 + 𝛽9𝐿𝑜𝑔 (1 + 𝑣𝑒𝑔𝑎)𝑖,𝑡+ 𝛾𝑘+ 𝛿𝑡+ 𝜏𝑡+ 𝜀𝑖, (5)
where, 𝐹𝑖𝑟𝑚 𝑖𝑛𝑛𝑜𝑣𝑎𝑡𝑖𝑜𝑛𝑖,𝑡+1, is measured by the five methods previously described, 𝛾𝑘, 𝛿𝑡 and 𝜏𝑡 are year fixed effects, industry fixed effects and firm fixed effects respectively. All other variables are as previously defined.
21
In Panel A, 𝐶𝐸𝑂 𝑖𝑛𝑛𝑜𝑣𝑎𝑡𝑖𝑣𝑒 𝑎𝑏𝑖𝑙𝑖𝑡𝑦𝑖,𝑡 is measured by Innovator CEO, which is a dummy variable equal to one if the CEOs had any patent between 1975 and 2010. I find that
Innovator CEO is positively statistically significant related to firm’s innovation measured in all five proxies when the year fixed effects and industry fixed effects are controlled. When firm fixed effects are controlled, Innovator CEO is positively statistically significant related to firm’s innovation only when firm innovation is measured by firm average citation per patent and citation-weighted firm innovation. In Panel B, I find that if CEOs have higher innovative ability based on their previous average citations per patent, firms have a greater number of patents, citations, average citations per patent and citation-weighted firm innovation when the year fixed effects and industry fixed effects or firm fixed effects are controlled. The results suggest a positive relationship between CEOs’ innovative ability and firm’s innovation, supporting hypothesis one that firms led by innovator CEOs tend to have more innovation for all the industries.20
Examining the control variables, I find that higher firm innovation is associated with bigger firms consistent with Sunder, Sunder and Zhang (2017). Furthermore, as in Hirshleifer, Low and Teoh (2012), I find that higher firm innovation is associated with firms with poor stock performance and high Tobin’s Q. Vega values is generally positive consistent with Coles, Naveen and Naveen (2006). CEO age is negatively associated with firm innovation, suggesting that younger CEOs are better in innovation.
20 The results of using the other six measures of a CEO’s innovative ability are presented in appendix Table 2A. The results are consistent with hypothesis one.
22
ENDOGENEITY
If highly innovative firms are more likely to hire an innovator CEO, then 𝛽1 in equation (5) is biased due to endogeneity. I control for endogeneity in two ways: 1) an instrument variable approach, and 2) propensity score matching.21
2SLS RESULTS
2SLS (two-stage least square) requires a selection of instrumental variables (IV). Successful IV candidates must satisfy two criteria. First, the IV must correlate with CEO innovative ability, and second, the IV does not correlate with the error term in equation (5). In another words, the IV affects the firm’s innovation only through CEO innovative ability. I construct an IV using the coauthor’s information. CEO coauthors’ ability is defined as CEO coauthors' average number of citations over average number of patents.22 I do not include any patents that the CEO coauthors have with the innovator CEO in the calculation of the IV.23 I choose CEO coauthors’ ability as an IV since people with higher innovative ability are more likely to work with other people with higher innovative ability. To implement the IV approach, I estimate the following first-stage regression:
21 I also employ the difference-in-difference method by using an exogenous shock of CEO turnover to deal with the endogeneity issue. The results are presented in the appendix Table 5A. The results are consistent with hypothesis one.
22 CEO coauthors’ average citation is defined as the average citation the coauthor has shared with other authors. CEO coauthors’ average patent is defined as the average patent the coauthor shared with other authors.
23 I also manually check 50 CEOs’ coauthors and find that CEO coauthors and CEOs do not work in the same company. Therefore, CEO coauthors and CEOs working in the same company is very rare.
23 𝐶𝐸𝑂 𝑖𝑛𝑛𝑜𝑣𝑎𝑡𝑖𝑣𝑒 𝑎𝑏𝑖𝑙𝑖𝑡𝑦𝑖,𝑡 = 𝛼1+ 𝛽1𝐶𝐸𝑂 𝑐𝑜𝑎𝑢𝑡ℎ𝑜𝑟𝑠′ 𝑎𝑏𝑖𝑙𝑖𝑡𝑦𝑖+ 𝛽2𝐿𝑜𝑔(𝑎𝑠𝑠𝑒𝑡𝑠)𝑖,𝑡 + 𝛽3𝐿𝑜𝑔 (𝑐𝑎𝑝𝑖𝑡𝑎𝑙 𝑖𝑛𝑡𝑒𝑛𝑠𝑖𝑡𝑦)𝑖,𝑡+ 𝛽4𝑆𝑡𝑜𝑐𝑘 𝑟𝑒𝑡𝑢𝑟𝑛𝑖,𝑡 + 𝛽5𝑇𝑜𝑏𝑖𝑛′𝑠 𝑄 𝑖,𝑡 + 𝛽6𝐿𝑜𝑔 (1 + 𝑡𝑒𝑛𝑢𝑟𝑒)𝑖,𝑡+ 𝛽7𝐶𝐸𝑂 𝑎𝑔𝑒𝑖,𝑡+ 𝛽8𝐿𝑜𝑔 (1 + 𝑑𝑒𝑙𝑡𝑎)𝑖,𝑡 + 𝛽9𝐿𝑜𝑔 (1 + 𝑣𝑒𝑔𝑎)𝑖,𝑡+ 𝛾𝑘+ 𝛿𝑡+ 𝜏𝑡+ 𝜀𝑖 , (6)
where 𝐶𝐸𝑂 𝑐𝑜𝑎𝑢𝑡ℎ𝑜𝑟𝑠′ 𝑎𝑏𝑖𝑙𝑖𝑡𝑦𝑖 is firm i CEO coauthors' average citation to average patent. All
other variables are as previously defined. I drop CEOs that are single authors for all the patents. Table 4 presents the first-stage results. I find that CEO coauthors’ ability is significant positively related to CEO’s innovative abilities in both Panels A and B.24 Therefore, CEO coauthors’ ability is a valid instrumental variable since CEO coauthors’ ability is positively related to CEOs’ innovative ability, and CEO coauthors’ ability affects firm’s innovation only through the CEO.25
The second-stage equation estimates the impact of the innovator CEO on the firm’s innovation activity:
24 The results of using the other six measures of a CEO’s innovative ability are presented in appendix Table 3A. The results are consistent with Table 4.
25 One concern regarding the IV maybe that CEOs’ free ride and do not really coauthor the patent. To address with this concern, I calculate the frequency with which CEOs and coauthors collaborate. Frequently collaborated coauthors are the coauthors have more than one patent with the innovator CEO. The results using frequently collaborated coauthors are qualitatively similar to the results in Table 4 and available upon request. I also find that CEO coauthors’ ability positively impact firm innovation. The results are available upon request.
24 𝐹𝑖𝑟𝑚 𝑖𝑛𝑛𝑜𝑣𝑎𝑡𝑖𝑜𝑛𝑖,𝑡+1 = 𝛼1 + 𝛽1𝐶𝐸𝑂 𝑖𝑛𝑛𝑜𝑣𝑎𝑡𝑖𝑣𝑒 𝑎𝑏𝑖𝑙𝑖𝑡𝑦̂ 𝑖,𝑡+ 𝛽2𝐿𝑜𝑔(𝑎𝑠𝑠𝑒𝑡𝑠)𝑖,𝑡 + 𝛽3𝐿𝑜𝑔 (𝑐𝑎𝑝𝑖𝑡𝑎𝑙 𝑖𝑛𝑡𝑒𝑛𝑠𝑖𝑡𝑦)𝑖,𝑡+ 𝛽4𝑆𝑡𝑜𝑐𝑘 𝑟𝑒𝑡𝑢𝑟𝑛𝑖,𝑡 + 𝛽5𝑇𝑜𝑏𝑖𝑛′𝑠 𝑄𝑖,𝑡 + 𝛽6𝐿𝑜𝑔 (1 + 𝑡𝑒𝑛𝑢𝑟𝑒)𝑖,𝑡 + 𝛽7𝐶𝐸𝑂 𝑎𝑔𝑒𝑖,𝑡+ 𝛽8𝐿𝑜𝑔 (1 + 𝑑𝑒𝑙𝑡𝑎)𝑖,𝑡 + 𝛽9𝐿𝑜𝑔 (1 + 𝑣𝑒𝑔𝑎)𝑖,𝑡+ 𝛾𝑘+ 𝛿𝑡+ 𝜏𝑡+ 𝜀𝑖, (7)
where 𝐶𝐸𝑂 𝑖𝑛𝑛𝑜𝑣𝑎𝑡𝑖𝑣𝑒 𝑎𝑏𝑖𝑙𝑖𝑡𝑦̂ 𝑖,𝑡 is the predicted values from equation (6). All other variables are as previously defined.
Table 4 reports the second stage regression results.26 In Panels A, when a CEO’s innovative ability is measured by a dummy variable, there is a significantly positive relation between the firm’s innovation and the CEO’s innovative ability, suggesting that firms led by innovator CEOs have a greater firm innovation compared to firms led by non-innovator CEOs. In Panel B, a CEO’s innovative ability is measured by cumulative average citation. The first-stage results show a positive relation between CEO coauthors’ ability and CEOs’ innovative ability, consistent with the prediction that people with higher innovative ability are more likely to work with other people with higher innovative ability. The second-stage results show that CEOs’ innovative ability has a positive impact on firm innovation. Overall, the results are consistent with hypothesis one that CEOs with innovative ability have a positive effect on the firm’s innovation for all the industries.27
Consistent with prior literature, Table 4 shows that in general, firm innovation is
associated with bigger firms, firms with lower stock return, higher Tobin’s Q and younger CEO.
26 Since only the firms with innovator CEOs have a measured of CEO coauthors’ ability, I also run regressions excluding firms led by non-innovator CEOs. The results are available upon request.
25
I also find that in general lower delta value and higher vega value are associated with higher firm innovation consistent with Coles, Naveen and Naveen (2006).
PROPENSITY SCORE MATCHED SAMPLES
Second, I employ a propensity score matching procedure (Rosenbaum and Rubin, 1983) to deal with the endogeneity issue. This methodology allows me to construct a control sample of firms that are led by non-innovator CEOs and exhibit no observable differences in firm and CEO characteristics relative to the firms that are led by innovator CEOs. Therefore, if firm’s
innovation is different between the matched firms, the only reason can be due to the fact the innovator CEO.
To implement this methodology, I first calculate the probability (propensity score) from the logit regression to construct a nearest-neighbor matched sample for innovator CEOs using all the control variables in equation (5). In each year, I choose, with replacement, the non-innovator CEOs with propensity scores closest to those of each innovator CEO. After constructing the matched sample, I run OLS regression (equation (5)) controlling firm and CEO characteristics, year fixed effects and industry fixed effects. The results are presented in Table 5.28 Results indicates that innovator CEOs increase firm innovation when measured by patents, citations, average citations per patent and citation-weighted firm innovation, suggesting that firms led by innovator CEOs experience a greater firm innovation compared to firms led by non-innovator CEOs. The results are the same whether there is one or two nearest matching firms.
26
EFFECT OF INDUSTRY INNOVATIVENESS
I expect that the effect of an innovator CEO on firm’s innovative outcomes should be larger for industries that need innovation the most. I follow Hirshleifer, Low and Teoh (2012) to identify industry innovativeness. Specifically, I identify an industry as an innovative industry if the average citation per patent for the industry is greater than the median average citation per patent across all industries, where industries are classified at the four-digit SIC level.29 In my
sample, the innovative industries have 1,703 innovator CEOs, and non-innovative industries have only 101 innovator CEOs. In order to study the impact of CEOs’ innovative ability on innovative industries, I include 𝐼𝑛𝑛𝑜𝑣𝑎𝑡𝑖𝑣𝑒 𝑖𝑛𝑑𝑢𝑠𝑡𝑟𝑦𝑖 defined as a dummy variable equal to one if the firm is in innovative industry and zero otherwise, and the interaction of 𝐼𝑛𝑛𝑜𝑣𝑎𝑡𝑜𝑟 𝐶𝐸𝑂𝑖
and 𝐼𝑛𝑛𝑜𝑣𝑎𝑡𝑖𝑣𝑒 𝑖𝑛𝑑𝑢𝑠𝑡𝑟𝑦𝑖 as additional independent variables. The results are presented in
Table 6. I find that the coefficients of the interaction term between 𝐼𝑛𝑛𝑜𝑣𝑎𝑡𝑜𝑟 𝐶𝐸𝑂𝑖 and
𝐼𝑛𝑛𝑜𝑣𝑎𝑡𝑖𝑣𝑒 𝑖𝑛𝑑𝑢𝑠𝑡𝑟𝑦𝑖 are negatively significant when firm innovation is measured by firm average citation and citation-weighted firm innovation after controlling for endogeneity. The results do not support hypothesis two and suggest that innovator CEOs in innovative industry lower firm innovation compared to less innovative industry.30 The results also suggest innovator
CEOs’ potential overinvestment problem since innovator CEOs have a better opportunity to
29 The results are robust to classify industries at the two-digit SIC level.
30 I also study the impact of CEOs’ innovative ability on the high-tech industry. I follow Loughran and Ritter’s (2004) definition of high-tech industry and non-high-tech industry. I find that innovator CEOs impact firm innovation for both the high-tech and the non-high-tech industry, suggesting that the potential overinvestment problem of innovator CEOs is related to the industry innovativeness and not simply the high-tech industry. The results are available upon request.
27
invest in R&D projects in innovative industries compared to less innovative industries and then this leads to the overinvestment problem.
THE USEFULNESS OF A CEO’S INNOVATIVE ABILITY TO THE FIRM Next, I examine why and how innovator CEOs spur firm innovation. Specifically, I ask the question: what kind of innovative ability can spur firm innovation? For example, if a firm led by an innovator CEO is in the retail industry and the innovator CEO has a patent in the health care industry, does this innovative ability spur the high-tech firm’s innovation? I expect that if the innovator CEO’s innovative ability is more useful for the firm, the effect of the innovator CEO on firm’s innovation will be greater. In other words, if the CEO’s patent technological classification is the same as the firm’s, the CEO’s innovative ability is useful for the firm and can spur more firm innovation.
For the firms with innovator CEOs, I split the sample into two subsamples based on CEO patent classification for the technologies to which the patented inventions belong and the firm industry classification.31 Patent technological classification is from USPTO and Hall et al.
(2001).32 I use Fama-French 12 industry classification as the firm industry classification. I manually matched patent technological classification and firm industry classification. Table 7 presents the results. I find that when a CEO’s patent technological classification is the same as
31 I also split the sample based on CEO patent technological classification and firm patent technological
classification. I define firm’s patent technological classification but do not count for the CEO’s patent. The results remain the same and are available upon request.
32 USPTO has developed 400 main patent technologies class and over 120,000 patent subclasses. Hall et al. (2001) have developed a higher-level classification and aggregated the 400 classes into 36 two-digit technological sub-categories. And these in turn further aggregated into 6 main categories: Chemical (excluding Drugs); Computers and Communications; Drugs and Medical; Electrical and Electronics; Mechanical; and Others.
28
the firm industry classification, CEOs’ innovative ability has a positive effect on firm average citation and citation-weighted innovation. However, when CEO patent technological
classification is not the same as the firm industry classification, the positive coefficients on CEOs’ innovative ability disappears after controlling for endogeneity. Surprisingly, the estimated coefficients on CEO’s innovative ability are negatively significant when the firm’s innovation is measured by citation-weighted firm innovation and patent market-value, suggesting that a CEO’s innovative ability hurts the firm’s innovation. Further, the equality tests of coefficients show that the differences of CEO cumulative average citation coefficients between the two subsamples are significantly different. This result is also in line with agency theory that innovator CEOs may have overinvestment problem (Jensen and Meckling, 1976) especially when CEOs’ innovative ability is not useful for the firm. Overall, the results suggest that innovator CEOs can spur firm innovation only when their patent technological classification is the same as the firm industry classification.33 In other words, innovator CEOs can spur firm innovation only when the CEO’s innovative ability is beneficial for the firm.
R&D SPENDING
I further study how innovator CEOs spur firm innovation by examining the R&D spending. If the innovator CEO values innovation for the firm, then they will invest more in innovative projects. Following Sunder et al. (2017), R&D spending is a measure of innovation
33 The equality of coefficients tests show that the coefficients between firms where CEO patent technological classification is the same as the firm industry classification and firms CEO patent technological classification is not the same as the firm industry classification are significantly different. The results are available upon request.
29
input. R&D spending is calculated as the ratio of R&D spending to lagged total assets. If R&D spending is missing, the value is set to zero.
Table 8 displays the results from regressing CEOs’ innovative ability on R&D spending. When CEOs’ innovative ability is measured by a dummy variable, the estimated coefficients on CEOs’ innovative ability are positively significant in both OLS and 2SLS regressions,
suggesting that innovator CEOs invest more in firm’s innovation activities compared to non-innovator CEOs. When CEOs’ innovative ability is measured by the cumulative average citation per patent up to a given year, CEOs’ innovative ability is positively significantly related to R&D spending in OLS and 2SLS regressions for the whole sample and the sample excluding firms led by non-innovator CEOs, suggesting that CEOs with higher innovative ability invest more in firm’s innovation activities. The results show that innovator CEOs could potentially have overinvestment problems.
INNOVATION EFFICIENCY
Thus far, results indicate that innovator CEOs spur more firm innovation and they spend more on these innovative activities. However, it is not clear if a firm’s investments in R&D spending are efficient or not. Therefore, I examine the innovation efficiency for innovator CEOs. Specifically, I estimate the following regression:
30 𝐹𝑖𝑟𝑚 𝑖𝑛𝑛𝑜𝑣𝑎𝑡𝑖𝑜𝑛𝑖,𝑡+1 = 𝛼1+ 𝛽1𝐶𝐸𝑂 𝑖𝑛𝑛𝑜𝑣𝑎𝑡𝑖𝑣𝑒 𝑎𝑏𝑖𝑙𝑖𝑡𝑦𝑖,𝑡 + 𝛽2𝐶𝐸𝑂 𝑖𝑛𝑛𝑜𝑣𝑎𝑡𝑖𝑣𝑒 𝑎𝑏𝑖𝑙𝑖𝑡𝑦 ∗ 𝑅&𝐷 𝑠𝑝𝑒𝑛𝑑𝑖𝑛𝑔𝑖,𝑡+ 𝛽3𝑅&𝐷 𝑠𝑝𝑒𝑛𝑑𝑖𝑛𝑔𝑖,𝑡 + 𝛽4𝐿𝑜𝑔(𝑎𝑠𝑠𝑒𝑡𝑠)𝑖,𝑡 + 𝛽5𝐿𝑜𝑔 (𝑐𝑎𝑝𝑖𝑡𝑎𝑙 𝑖𝑛𝑡𝑒𝑛𝑠𝑖𝑡𝑦)𝑖,𝑡+ 𝛽6𝑆𝑡𝑜𝑐𝑘 𝑟𝑒𝑡𝑢𝑟𝑛𝑖,𝑡 + 𝛽7𝑇𝑜𝑏𝑖𝑛′𝑠 𝑄𝑖,𝑡+ 𝛽8𝐿𝑜𝑔 (1 + 𝑡𝑒𝑛𝑢𝑟𝑒)𝑖,𝑡+ 𝛽9𝐶𝐸𝑂 𝑎𝑔𝑒𝑖,𝑡 + 𝛽10𝐿𝑜𝑔 (1 + 𝑑𝑒𝑙𝑡𝑎)𝑖,𝑡+ 𝛽11𝐿𝑜𝑔 (1 + 𝑣𝑒𝑔𝑎)𝑖,𝑡 + 𝛾𝑘+ 𝛿𝑡 + 𝜀𝑖, (9)
Controlling for CEO innovative ability and R&D spending, the estimated coefficients on the interaction term, 𝐶𝐸𝑂 𝑖𝑛𝑛𝑜𝑣𝑎𝑡𝑖𝑣𝑒 𝑎𝑏𝑖𝑙𝑖𝑡𝑦 ∗ 𝑅&𝐷 𝑠𝑝𝑒𝑛𝑑𝑖𝑛𝑔𝑖,𝑡, stand for the innovation efficiency. All other variables are as previously defined. The results are reported in Table 9. In Panel A, I find that innovator CEO and R&D spending are positively related to firm innovation consistent with previous findings. After controlling for innovator CEO and R&D spending, the interaction term is negatively significant associated with all the firm’s innovation measurements in both OLS and 2SLS regressions, suggesting that innovator CEOs do not use R&D funding efficiently to spur firm innovation. In Panel B, CEOs’ innovative ability is measured by cumulative citation per patent up to a given year. I find that after controlling for CEOs’
innovative ability and R&D spending, the interaction term is negatively significant in both OLS and 2SLS regressions, suggesting that innovator CEOs with greater innovative ability use R&D funding even less efficiently to spur firm innovation. The results are the same for the whole sample and the sample excluding firms led by non-innovator CEOs. The results in Table 9 are consistent with the hypothesis 3 and the agency cost theory that CEOs overinvest in the projects that satisfy their own interests (Jensen and Meckling, 1976; Jensen 1986).
31
V. INNOVATOR CEO AND FIRM CASH HOLDINGS
In order to understand the negative relation between a CEO’s innovative ability and the stock abnormal return on the announcement date of hiring a new innovator CEO, I further investigate the effect of innovator CEOs on firm cash holdings. Following Qiu and Wan (2015), I estimate the regression as below:
𝐶𝑎𝑠ℎ𝑖,𝑡+1 = 𝛼1+ 𝛽1𝐼𝑛𝑛𝑜𝑣𝑎𝑡𝑜𝑟 𝐶𝐸𝑂𝑖,𝑡+ 𝛽2𝐿𝑜𝑔(𝑠𝑎𝑙𝑒)𝑖,𝑡+ 𝛽3𝑆𝑡𝑜𝑐𝑘 𝑟𝑒𝑡𝑢𝑟𝑛𝑖,𝑡 + 𝛽4𝑇𝑜𝑏𝑖𝑛′𝑠 𝑄𝑖,𝑡+ 𝛽5𝑅𝑂𝐴𝑖,𝑡+ 𝛽6𝑆𝑎𝑙𝑒𝑠 𝑔𝑟𝑜𝑤𝑡ℎ𝑖,𝑡
+ 𝛽7𝐼𝑛𝑐𝑜𝑚𝑒 𝑣𝑜𝑙𝑎𝑡𝑖𝑙𝑖𝑡𝑦𝑖,𝑡+ 𝛽8𝐿𝑜𝑔 (1 + 𝑑𝑒𝑙𝑡𝑎)𝑖,𝑡+ 𝛽9𝐿𝑜𝑔 (1 + 𝑣𝑒𝑔𝑎)𝑖,𝑡+ 𝛾𝑘 + 𝛿𝑡+ 𝜀𝑖, (10)
where 𝐼𝑛𝑛𝑜𝑣𝑎𝑡𝑜𝑟 𝐶𝐸𝑂𝑖,𝑡 is a dummy variable equal to one if the CEO had any patents during 1975-2010, 𝐶𝑎𝑠ℎ𝑖,𝑡+1 is the ratio of cash and marketable securities to total book assets, and all
other variable definitions are provided in Appendix. Table 10 presents the results from
estimating equation (10). In column (1), I do not control for year and industry fixed effects. In column (2), I control for year fixed effect, in column (3), I control for both year and industry fixed effects. I find the coefficients on innovator CEO are positively significant in all three regressions, suggesting that firms led by innovator CEOs hold more cash compared to firms led by non-innovator CEOs.34 Control variables are consistent with the literature. For example, small
34 I also find that when CEOs’ innovative ability is useful for the frim, firms with innovator CEOs hold less cash compared to firms with non-innovator CEOs. When CEOs’ innovative ability is not useful for the firm, firms with innovator CEOs hold more cash compared to firms with non-innovator CEOs, suggesting the agency problems of innovator CEOs.
32
firms, and firms with lower Tobin’s Q and high income volatility hold more cash (Qiu and Wan, 2015).
Next, I compare the value of cash for firms with innovator CEOs and firms with non-innovator CEOs. I follow Faulkender and Wang (2006) to measure cash value and estimate the following regression: 𝑟𝑖,𝑡− 𝑅𝑖,𝑡𝐵 = 𝛼1+ 𝛽1 ∆𝐶𝑖,𝑡 𝑀𝑉𝑖,𝑡−1+ 𝛽2 ∆𝐸𝑖,𝑡 𝑀𝑉𝑖,𝑡−1+ 𝛽3 ∆𝑁𝐴𝑖,𝑡 𝑀𝑉𝑖,𝑡−1+ 𝛽4 ∆𝑅𝐷𝑖,𝑡 𝑀𝑉𝑖,𝑡−1+ 𝛽5 ∆𝐼𝑖,𝑡 𝑀𝑉𝑖,𝑡−1 + 𝛽6 ∆𝐷𝑖,𝑡 𝑀𝑉𝑖,𝑡−1+ 𝛽7 𝐶𝑖,𝑡−1 𝑀𝑉𝑖,𝑡−1𝑖,𝑡+ 𝛽8𝐿𝑖,𝑡 + 𝛽9 𝑁𝐹𝑖,𝑡 𝑀𝑉𝑖,𝑡−1 + 𝜀𝑖, (11)
The dependent variable, 𝑟𝑖,𝑡− 𝑅𝑖,𝑡𝐵, is the excess stock return adjusted for size and book-to-market, where 𝑟𝑖,𝑡 is the stock return for firm i in year t and 𝑅𝑖,𝑡𝐵 is the stock i’s benchmark return at year t.35 The benchmark return is the 25 Fama and French (1993) portfolios returns formed on size and book-to-market. The independent variables, ∆𝑋𝑖,𝑡, stand for a change in variable X for firm i over year t-1 to year t. The independent variables include cash and
marketable securities (𝐶𝑖,𝑡), earnings before extraordinary items (𝐸𝑖,𝑡), net assets (𝑁𝐴𝑖,𝑡), research and development expense (𝑅𝐷𝑖,𝑡), interest expense (𝐼𝑖,𝑡), total dividends (𝐷𝑖,𝑡), market leverage
(𝐿𝑖,𝑡) and the firm’s net financing (𝑁𝐹𝑖,𝑡). The coefficient of cash and marketable securities (𝐶𝑖,𝑡),
𝛽1, reflects the cash value of a firm. The dependent variable and all the independent variables
(except leverage) are scaled by, 𝑀𝑉𝑖,𝑡−1, the market value of firm i in year t-1. Therefore, 𝛽1
measures the dollar change in shareholder value when one dollar cash holding changes in a firm.
33
Table 11 presents the results of comparing the cash value between firms with innovation CEOs and firms with non-innovator CEOs. In column (1) and (2), I do not control for year and industry fixed effects. In column (3) and (4), I control for year fixed effect. In column (5) and (6), I control for both year and industry fixed effects. I find that the cash value of firms with innovator CEOs is lower than the firms with non-innovator CEOs in all six regressions. For example, after controlling for year and industry fixed effects, one dollar change in cash holdings results 0.347 dollar change in shareholder values for firms with innovator CEOs. However, the cash value is 0.566 in firms with non-innovator CEOs. The results suggest that the stock market values the cash holdings lower in firms with innovator CEOs than firms with non-innovator CEOs. Although firms with innovator CEOs hold more cash, the cash value is lower, suggesting that firms with innovator CEOs hold excess cash and hurt shareholders’ value.
34
VI. LONG-RUN EFFECTS
In this section, I examine the long-run effects of innovator CEOs on stock return and firm innovation. First, I estimate the following regressions to test the impact of innovator CEOs on firm long-run stock return up to five years after the firm hires the innovator CEO:
𝐴𝑅0,𝑛𝑖 = 𝛼1+ 𝛽1𝐼𝑛𝑛𝑜𝑣𝑎𝑡𝑜𝑟 𝐶𝐸𝑂𝑖,𝑡+ 𝛽2𝐿𝑜𝑔(𝑠𝑎𝑙𝑒)𝑖,𝑡+ 𝛽3𝐶𝑎𝑝𝑖𝑡𝑎𝑙 𝑖𝑛𝑡𝑒𝑛𝑠𝑖𝑡𝑦𝑖,𝑡 + 𝛽4𝑇𝑜𝑏𝑖𝑛′𝑠 𝑄𝑖,𝑡+ 𝛽5𝐿𝑜𝑔 (1 + 𝑑𝑒𝑙𝑡𝑎)𝑖,𝑡+ 𝛽6𝐿𝑜𝑔 (1 + 𝑣𝑒𝑔𝑎)𝑖,𝑡 + 𝛾𝑘+ 𝛿𝑡+
𝜀𝑖, (12)
where 𝐴𝑅0,𝑛𝑖 is the buy-and-hold benchmark-adjusted return for firm 𝑖 for months 1-n after the date of hiring the innovator CEO, 𝑟𝑡𝑖 is the stock raw return for firm 𝑖 in month 𝑡 after the date of hiring a new innovator CEO, and 𝑟𝑡𝑏 is the benchmark return in month 𝑡. The benchmark returns
are CRSP value-weighted index and CRSP equal-weighted index. I calculate the buy-and-hold benchmark-adjusted return of months 1-12 (𝐴𝑅0,1𝑖 ), 1-24 (𝐴𝑅0,2𝑖 ), 1-36 (𝐴𝑅0,3𝑖 ), 1-48 (𝐴𝑅0,4𝑖 ), 1-60 (𝐴𝑅0,5𝑖 ) after firm 𝑖 hiring the innovator CEO. I also control for industry fixed effects (𝛾𝑘)
and year fixed effects (𝛿𝑡). All the other variables are as previously defined.
Table 12 presents the results from estimating equation (13). I find that CEOs’ innovative ability has no impact on stock return for the first two years after the firm hires the innovator CEO. However, firms with innovator CEOs experience greater abnormal buy-and-hold stock return starting the third year of hiring innovator CEOs compared to firms with non-innovator CEOs. The results are consistent with the previous results and the expectation that since
35
innovator CEOs positively impact firm innovation but pose agency problems to the firm,
innovator CEOs do not drive firm value in the short-run while drive firm value in the long-run. 36
Second, I employ 2SLS regressions to investigate the effects of innovator CEOs on firm innovation in the long-run. I estimate regression equation (6)-the first-stage, and equation (7)-the second-stage by changing the dependent variable in the second-stage to firm innovation in the year three (𝐹𝑖𝑟𝑚 𝑖𝑛𝑛𝑜𝑣𝑎𝑡𝑖𝑜𝑛𝑖,𝑡+3), or firm innovation in the year ten (𝐹𝑖𝑟𝑚 𝑖𝑛𝑛𝑜𝑣𝑎𝑡𝑖𝑜𝑛𝑖,𝑡+10). Table 13 reports the results. In Panel A, when firm innovation is measured in the year three, firms with innovator CEOs experience greater firm innovation measured in all five proxies. However, the effects of CEOs’ innovative ability on firm innovation measured in the year three are smaller compared to when firm innovation is measured in the next year in Table 4 Panel A. In Panel B, firm innovation is measured in the year ten. I find that the innovator CEO still has a positive impact on firm innovation but the effects of innovator CEO on firm innovation are smaller compared to when firm innovation is measured in the year three in Panel A. The results suggest that CEOs’ innovation ability can impact firm innovation for up to ten years but the effects of CEOs’ innovative ability on firm innovation decrease over time.
36 The results for the impact of innovator CEOs on stock return around the date of hiring a CEO is in Appendix Table 7A. I find that the stock cumulative abnormal return in the three days window for innovator CEOs is lower than for non-innovator CEOs around the date of hiring an innovator CEO, and that the CEO’s innovative ability is negative and statistically significant associated with the abnormal stock return around the date of hiring a new innovator CEO. The results suggest that the market recognizes that innovator CEOs have inefficient overinvestment problems.