Expected Payments and Considerations for the New ACRE Program
By Nicholas D. Paulson and Gary D. Schnitkey
Introduction
The 2008 Farm Bill debate lasted more than a full year, with House Agriculture subcommittee markups beginning in May 2007 and final passage, through veto override, finally being achieved in May 2008. One of the major changes to the Commodity Programs Title was the creation of the new Average Crop Revenue Election (ACRE) program, which is based on crop-specific revenues at the state level, and serves as an optional alternative to the existing price-based countercyclical program. Development of a safety net option based on crop revenues, rather than prices, was widely supported by a number of national agricultural organizations including the National Corn Growers Association, American Farm Bureau Federation, and American Farmland Trust. Enrollment numbers in the program were initially low with less than 1,000 farms committed to the program as of June 2009. As the August enrollment deadline approached, enrollment numbers increased sharply. Approximately 128,000 farms, comprising more than 32.5 million acres, ultimately opted to enroll in the new program. This represents just under 13 percent of total acreage enrolled in commodity programs.
A number of economists at land grant universities have provided the agricultural community with educational materials, analysis and outlook, and payment calculator tools for the ACRE program (e.g., AGDM 2009; AgManager 2009; AFPC 2009; Babcock 2009a, 2009b; FAPRI 2009; Farmdoc 2009; Zulauf 2009a, 2009b). These materials are generally directed to regional audiences and, in addition to educating users on the specific mechanics of the ACRE program, allow them to calculate ACRE payment levels under various yield and price scenarios. Many economists have also provided recommendations and suggestions regarding the ACRE program enrollment decision. The main consensus has been, given the complexities of the program, enrollment decisions should be made only after the specific characteristics of the farm have been carefully analyzed.
Abstract
The 2008 Farm Bill provided an option for receiving commodity program payments through existing programs or a new revenue-based alternative – the Average Crop Revenue Election (ACRE) program. ACRE is a state-level revenue program which, if elected, replaces the price-based countercyclical program. Enrollment requires the forfeiture of 20 percent of a producer’s direct payments and reduces loan rates by 30 percent. This article provides estimates of long-term expected ACRE payments for corn, soybean, and wheat acres across a variety of states. Within the cornbelt, expected ACRE payments are similar across regions for each of the crops considered, and will likely exceed the required reduction in direct payments. Outside of the cornbelt, expected ACRE payments vary considerably.
Nick Paulson is an Assistant Professor in the Department of Agricultural and Consumer Economics at the University of Illinois. His research focuses on finance and risk management for agriculture, and policy analysis related to those areas. Dr. Paulson grew up on a grain farm in southern Minnesota and earned his PhD in Economics from Iowa State University.
Gary Schnitkey is a Professor and Farm Management Specialist in the Department of Agricultural and Consumer Economics at the University of Illinois. His research and outreach activities focused on farm management and risk management. Dr. Schnitkey grew up on a grain and hog farm in northwest Ohio and earned his PhD in Agricultural Economics from the University of Illinois.
In this paper, potential or expected ACRE payments are provided for corn, soybeans, and wheat based on historical yield and price experience from 1977 through 2007. Summaries of historical payments are reported for all states for which at least 30 years of yield data were available. For those farms that did not enroll in ACRE for the 2009 crop year, there will be additional enrollment periods for future crop years. Thus, these payment estimates are useful for both operators and landlords as they continue to make their ACRE enrollment decisions. Moreover, ACRE payment estimates will be of value to lenders and rural appraisers in determining the potential impact of the program on farm profitability and cash flows, and farmland values and cash rent levels. Finally, as an additional contribution, this article provides a number of references and links to existing resources on the ACRE program.
Choice between Traditional and ACRE Commodity Program Payments
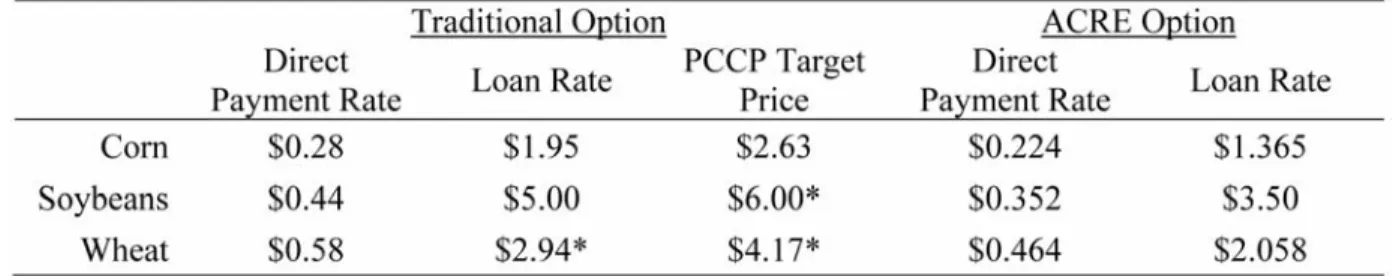
The ACRE program is effectively a put option on a state-level revenue index, where the option strike is set equal to a revenue guarantee based on historical state yields and national price levels. ACRE began with the 2009 crop year and serves as an alternative to the suite of existing commodity programs which include direct payments, price-based countercyclical payments, and marketing loan programs. Producers make the choice between ACRE and traditional programs at the Farm Service Agency (FSA) farm level, with the option of deferring the decision into future crop years. However, once elected, all program crops grown on the farm will be covered by the ACRE program throughout the life of the current Farm Bill which applies through the 2012 crop year.If elected, ACRE replaces the current price-based countercyclical program (PCCP). ACRE farms continue to be eligible for direct payments and marketing loan programs. However, direct payment rates are reduced by 20 percent, and the loan rates which define the marketing loan programs are reduced by 30 percent. Table 1 compares direct payment and national loan rates for corn, soybeans, and wheat under the traditional and ACRE program options as outlined in the 2008 Farm Bill. National loan rates are then adjusted to county-specific levels; the 30 percent loan rate reduction will apply nationwide for ACRE farms.
Between 2009 and 2012, it is highly unlikely that PCCP payments will be received under the traditional commodity program for the three crops considered as market prices are expected to be well above the PCCP trigger prices (Irwin and Good 2009). Similarly, payments
from the marketing loan programs under either the ACRE or traditional alternatives are highly unlikely for corn, soybeans, and wheat. As a result, direct payments are likely to be the only form of support offered by the traditional programs option. In comparison, the ACRE option will result in smaller direct payments, but also provide a greater likelihood of receiving payments from the ACRE program.
Therefore, the expected level of support provided by the ACRE option will be greater than traditional programs if expected ACRE payments exceed the associated reduction in direct payments. However, ACRE payments are uncertain at the time of enrollment whereas the 20 percent reduction in direct payments represents support which is foregone regardless of realized price and yield levels. Additionally, risk management should also be considered in choosing between the two options. Since the ACRE program is based on revenues rather than prices, the program is able to provide support in the event of poor yields as well as low prices. Thus, ACRE may be a more efficient risk management program than the traditional alternative.
ACRE Program Details
As previously stated, the ACRE program is based on a revenue index at the state-level. In any crop year, the revenue guarantee for each program crop is defined as 90 percent of the product of the 5-year Olympic average state-level yield and the 2-5-year simple average of the U.S. marketing year average price . For example, the 2009 revenue guarantee for corn acres in Illinois is based on average Illinois corn yields from 2004 through 2008, and the 2007 and 2008 marketing year average prices for corn. The Olympic average for yields is found by dropping the maximum and minimum yield levels over the 5-year period and then taking the simple average of the remaining three years.
(1)
By definition, the revenue guarantee will adjust each year with changes in market prices and yield levels. However, the adjustments to the state-level revenue guarantee are limited to 10 percent from the previous crop year’s level. This rule sets lower and upper limits, or cups and caps, on the revenue guarantee for each crop year beginning in 2010. Actual revenue for the crop year is then equal to the product of the actual state-level yield and U.S. MYA price Again, using Illinois corn acres as the example,
the actual revenue measure for 2009 would be equal to the product of the 2009 Illinois average corn yield and the national marketing year average corn price for 2009.
(2)
State-level ACRE payments are triggered if actual revenue falls below the revenue guarantee. However, the ACRE program operates under a “double trigger” eligibility rule. Farm-level revenue losses must also be proven for a producer to be eligible for an ACRE payment. The farm-level revenue guarantee, or farm benchmark revenue, is calculated as the product of the 5-year Olympic average of farm-level yields and the 2-year average of the U.S. MYA price
. Any multi-peril, Federally-subsidized crop insurance premiums paid by the producer (I) are also included in the farm’s benchmark revenue. Actual farm-level revenue is calculated as the product of actual farm yield and the U.S. MYA price for the current year . An important implication of the double trigger rule is that not all farms may receive an ACRE payment in a year in which payments are triggered at the state level. Also, farm-level losses alone will not trigger an ACRE payment. Revenue shortfalls must be realized at both the state and farm levels for a producer to receive a payment.
(3) (4)
If both state- and farm-level revenue measures fall below their respective guarantees (i.e., < and the farm is eligible to receive an ACRE payment. The payment per planted acre (Payment) is equal to 83.3 percent of the product of the state revenue shortfall and a farm yield factor. The farm yield factor is equal to the ratio of the farm and state benchmark yields, and acts as a scaling factor to tailor payment levels to farm-level productivity. Additionally, ACRE payments cannot exceed 25 percent of the revenue guarantee for the year on a per-acre basis.
(5)
Historical ACRE Payments — Methods
We generate the expected level of ACRE payments for corn, soybean, and wheat acres across a variety of states using an approach relying on historical price and yield experience. These expected ACRE payment
amounts can then be used by farm operators and landowners to assess differences in expected returns between the ACRE and traditional alternatives. Expected ACRE payments were estimated by conducting a historical analysis of program performance had the program existed from 1977 through 2007. The ACRE payments for each year were then divided by the corresponding year’s revenue guarantee to provide payment levels in percentage terms. A state revenue factor was then defined for each state as the average payment level as a percentage of the revenue guarantee. The product of the historic state revenue factor and the state revenue guarantee in 2009 multiplied by the 83.3 percent payment rate results in the average expected ACRE payment for the state. This procedure accounts for the fact that state revenues have increased over time due to increased yield and price levels, and provides estimates of expected ACRE payments represented in 2009 dollars. Furthermore, this procedure assumes that the likelihood of receiving payments and their expected size, stated as a percent of the state guarantee, will remain constant over time.
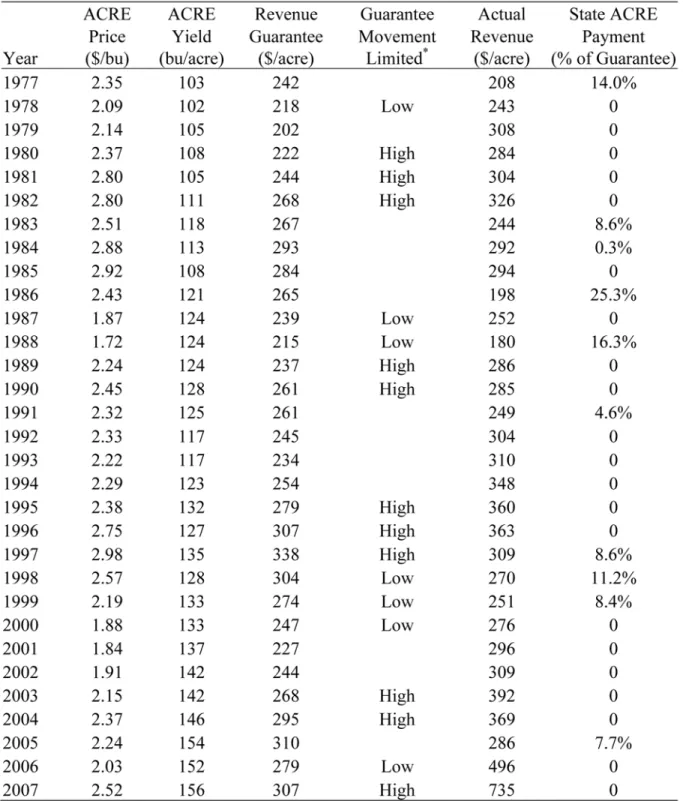
The details of the procedure are illustrated in Table 2 for corn acres in Illinois. Columns 2, 3, and 4 of Table 2 report the prices, yields, and revenue guarantees for the ACRE program, respectively, which would have been used had the program been available from the 1977 through 2007 crop years. The ACRE price denotes the benchmark price used to calculate the revenue guarantee for each year, and equals the average of the previous two years’ MYA prices. For example, the benchmark price for 1977 would have equaled $2.35, or the average of the 1975 and 1976 MYA prices of $2.54 and $2.15 per bushel. The ACRE Yield equals the Olympic average of yields for the previous five crop years. In 1977, the benchmark state yield for Illinois would have been set at 103 bushels per acre based on average corn yields from 1972 through 1976.
The Revenue Guarantee then equals 90 percent of the ACRE price times the ACRE Yield, with the exception of when this calculation results in a move of more than 10 percent from the previous year’s state revenue guarantee. Table 2 also illustrates when the changes in the revenue guarantee would have been limited by the 10 percent cup and cap rule. For example, the state revenue guarantee of $218 in 1978 would have been limited on the low end since the product of the ACRE price ($2.09) and the ACRE yield (102) would have been more than 10 percent below the $242 state revenue guarantee for the previous year. As can be seen in Table 2, changes in the revenue guarantee for corn acres in Illinois would have been limited in 17 out of the 31 years considered.
Table 2 also reports actual state revenue and the state ACRE payment, as a percentage of the revenue guarantee, for each year. In 1977, actual revenue was $208 for corn acres in Illinois, which would have resulted in an ACRE payment of $34 per acre planted to corn. Thus, the state revenue factor for Illinois corn in 1977 equaled 14 percent ($34 payment/$242 guarantee). In Table 2, positive ACRE revenue factors are reported for each year the program would have triggered a payment on Illinois corn acres. Between 1977 through 2007, ACRE would have triggered payments in 10 out of the 31 years, with an average size of 3.4 percent of the revenue guarantee. This is equivalent to an expected ACRE payment level of $17.67 per acre for Illinois corn. Similar calculations were made for corn, soybeans, and wheat for all U.S. states where at least 30 years of yield and price data were available from 1977 to 2007.
Historical ACRE Payments — Results
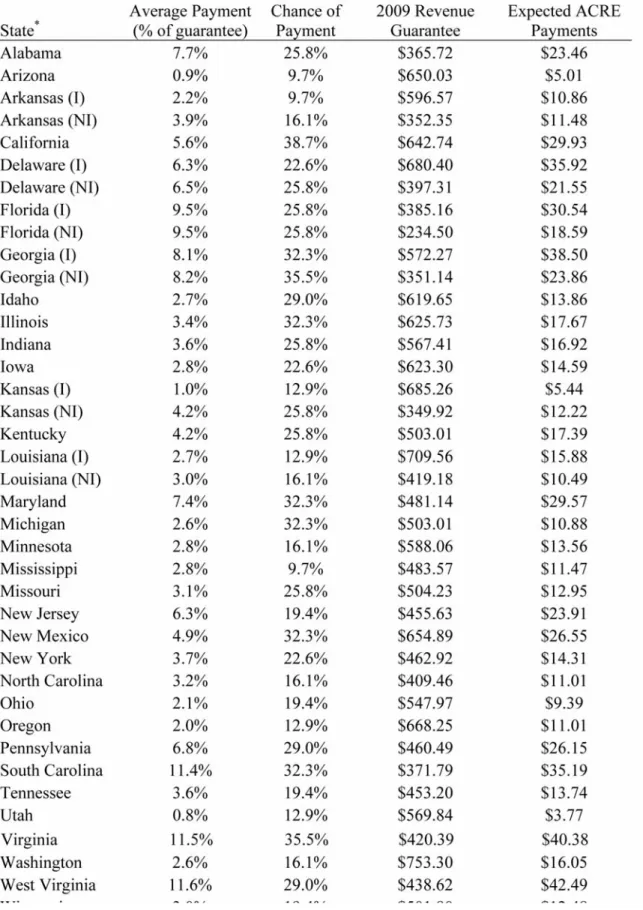
Historical ACRE payment statistics for corn across selected states are provided in Table 3. Considerable variability exists across states, with average historical payments ranging from $3.77 in Utah to $42.49 in West Virginia. For Illinois, Indiana, and Iowa – the heart of the cornbelt – history indicates that ACRE payments will average $17.67, $16.92, and $14.59 in those states, respectively. Direct payments in these areas average between $20 and $25 per acre. Hence, farms enrolled in ACRE will realize a reduction in direct payments of $4 to $5 per acre and should expect to receive a greater level of funding from the ACRE option.
The probabilities of ACRE payments being triggered on corn acres range from a low of 9.7 percent per year in Arizona and on irrigated corn acres in Arkansas, to 38.7 percent in California. Within the cornbelt, percentages are 32.3 percent for Illinois, 25.8 percent for Indiana, and 22.6 percent for Iowa. Hence, it would be reasonable to expect that, within the major corn production regions of the U.S., ACRE payments will be triggered an average of one out of every three or four years.
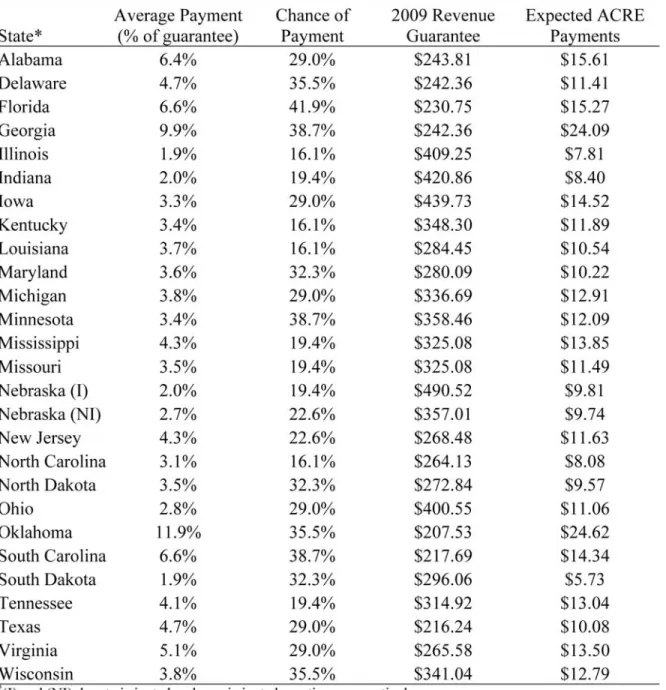
The historical analysis for soybean acres is summarized in Table 4. Expected ACRE payments for soybean acres range from $5.73 per acre in South Dakota to $24.62 per acre in Oklahoma. Expected ACRE payments on soybean acres are $7.81 for Illinois, $8.40 for Indiana, and $14.52 for Iowa. Similar to corn acres, expected ACRE payments for soybeans exceed the reduction in direct payments that would be required for ACRE program enrollment in these cornbelt states. The probability of payments being triggered on soybean acres
varies significantly from 16.1 percent in the states of Illinois, Kentucky, Louisiana, and North Carolina to more than 40 percent in Florida.
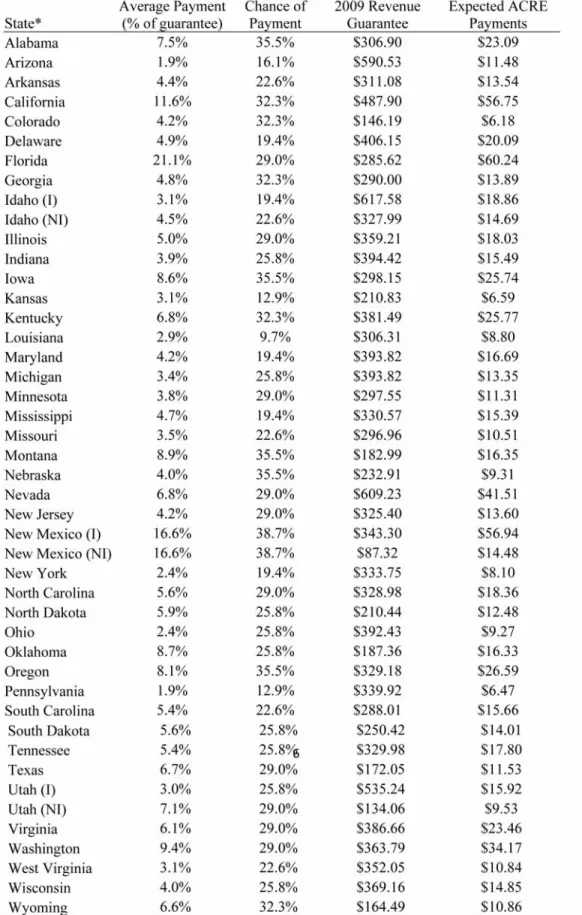
The historical experience on wheat acres, reported in Table 5, indicates a similar level of regional variability, in percentage terms, to that experienced on soybean acres. However, variability in terms of dollars per acre tends to be much higher on wheat acres. Average expected payments range from $6.18 per acre in Colorado to more than $60 per acre in Florida. Expected ACRE payments on wheat acres in the cornbelt also exceed the loss in direct payments required for program enrollment. Expected payments in the top wheat-producing states of Kansas and North Dakota were calculated to be $6.59 and $12.48 per acre, respectively, further illustrating the greater variability in historical ACRE program performance on wheat acres. Our results consider the payment trigger rules at the state level only, implicitly assuming an average farm yield equal to the average state yield in reporting the level of potential ACRE payments. However, the farm trigger rule must also be considered since the triggering of ACRE payments at the state level does not necessarily guarantee farm eligibility. The level of correlation between yields at the farm and state levels, or how closely farm- and state-level yields follow each other, is the main factor in determining the likelihood of a farm being ineligible for an ACRE payment.
Schnitkey and Paulson (2009) used historical farm-level yield data from the Illinois Farm Business Farm Management Association to assess the effect of the farm trigger rules. They found that, on Illinois corn acres, between 78 and 86 percent of farms would have met the farm trigger criteria for ACRE payment eligibility in years in which a payment was triggered at the state level. On soybean acres between 81 and 93 percent of farms would have met the farm trigger criteria in ACRE payment years. Including a $20 per acre crop insurance payment was found to increase the percentage of farms meeting the criteria by five to ten percent for both corn and soybean acreage. Similar results could be expected for other cornbelt states.
Potential Impacts on Cash Rents and Farmland Values
Economic theory suggests that, due to competition among tenants for an inelastic supply of farm land, subsidies should be fully capitalized into land values and cash rent levels. Previous research has shown that cash rent levels generally increase (decrease) as Federal subsidy levels increase (decrease). However the form of the subsidy, and the degree
of perceived permanence, impact the relative magnitude of the effect (Lence and Mishra, 2003). Furthermore, a recent study by Kirwan (2009) found that a much smaller share of federal subsidies – only 25 percent – accrues to landowners through changes in cash rent levels. Since ACRE is an optional program, one could argue that rational producers and landowners would only elect to enroll farms for which ACRE resulted in greater expected payments than what is given up in terms of direct payments and the value of loan rate reductions. This would further imply that cash rents, and land values, would have to either increase or remain constant (all else equal) if a farm is enrolled in the program. However, the magnitude of this effect would likely be reduced by the fact that ACRE is new and relatively complex, which is one of the top reasons cited by producers for deciding not to enroll farms in the ACRE program.
Again using cornbelt states as an example, ACRE might be expected to increase cash rent levels by as much as $12 per acre per year – the difference between expected ACRE payments and the reduction in direct payments in this region. In a discounted cash flow framework, land values might be expected to increase by a larger amount depending on an individual’s discount factor and whether ACRE is expected to be a permanent support program. However, because ACRE payments are uncertain, it is unlikely that the full expected difference between ACRE support and foregone direct payments – which are certain payments – will be capitalized into cash rents or land values. Additionally, as was illustrated by the historical ACRE payment calculations, program performance may vary significantly across both states and crops, with some regions not realizing an increase in expected support levels from enrolling in the ACRE program.
Other Considerations for the ACRE Enrollment Decision
The decision to elect ACRE program coverage or to remain in the existing programs hinges on a number of factors. The ACRE program is based on a state-level revenue index that will adjust over time whereas the countercyclical program is based on fixed target price levels. If state revenue levels remain fairly stable, or increase through 2012, the likelihood of ACRE payments being triggered is relatively low and total payments from the traditional programs will be greater due to the higher direct payments.
If price levels decline but stay above target price levels, the ACRE program may generate large payments while no support would be
provided by the countercyclical program. If prices fall below target price or loan rate levels the ACRE program could potentially reach payment limits. In this situation countercyclical payments would also be triggered, and any marketing loan gains or loan deficiency payments that would be generated would be larger under the traditional option because of the 30 percent reduction in loan rates associated with the ACRE program. Therefore producers need to assess their expectations with respect to future price levels. In general the traditional program option will result in higher direct payments, but provide little support for price declines in the range of current levels and target prices for corn, soybeans, and wheat.
Other issues that need to be considered include the relationship between farm and state yields, and the availability of historical records and documentation requirements for proving farm-level yields. If farm yields tend to closely follow the state average, the farm trigger criteria will have a greater chance of being met in years when ACRE payments are triggered. The timing of payments is yet another issue that should be considered. Because of the definition of the price component used by the ACRE program, the revenue guarantee will not be established prior to sign-up periods in future crop years and, given the use of MYA prices, the actual revenue measure used to determine ACRE payments will not be determined until prior to harvest of the following crop year. As a result, ACRE payments associated with any given crop year will likely not be made until the harvest of the following crop year.
Base acre allocations and future plans for planted acreage should also be examined. For example, in the cornbelt, the actual reduction in direct payments will be larger for farms with higher proportions of corn base acres relative to soybeans or wheat. Thus the relative cost of ACRE enrollment is contingent upon a farm’s base acreage and current production practices. Because payments are based on planted acreage, support offered by the ACRE program may more accurately reflect current practices, especially if they differ considerably from base acre allocations.
Conclusions
Introduction of the new ACRE program gives producers the option of electing commodity program support based on a state-level revenue index which can adjust, at least partially, through time to changes in yield and price levels. The ACRE program is an optional alternative to the existing countercyclical program which is based on legislatively fixed target prices. Producers must give up a portion of their direct
payments to elect the ACRE option, meaning they must forego guaranteed dollars to be eligible for an uncertain, or contingent, payment from the ACRE program.
Using an historical approach, we provide long-term expected ACRE payments for corn, soybean, and wheat acres across a variety of U.S. states. Results indicate that, within the cornbelt, ACRE payments for all three crops considered are likely to exceed the typical reduction in direct payments required for ACRE enrollment in that region. However, historical experience outside of the cornbelt was found to be significantly more variable with respect to the expected size and probability of ACRE payments being triggered. Thus, as recommended by most extension economists, the decision to enroll a farm in the ACRE program hinges heavily on the specific characteristics of that farm, including yield histories and the relationship between farm- and state-level yields.
For the three crops considered – corn, soybeans, and wheat – current market conditions suggest that prices are rather unlikely to fall below target price and loan rate levels in upcoming crop years. This implies that direct payments are likely to be the only form of support offered through the traditional alternative. Even for the cornbelt region, ACRE payments may not be triggered, resulting in greater support
coming from the larger direct payments available under the traditional option. However, the value of the ACRE program should be considered from both an expected payment and risk management perspective. Since ACRE is based on relatively current price and yield levels, the program has the potential to trigger payments under conditions where the price-based countercyclical program would not provide support.
Agricultural economists have done a significant amount of analysis on the new ACRE program. While the examples provided in the references section of this paper do not represent an exhaustive set of the available resources, readers are encouraged to utilize the information. The ACRE program represents a relatively significant change in the design of Federal support for agriculture. Given the program’s revenue-based design, it has the potential to impact farm profitability and cash flows under different conditions than current programs. Since ACRE enrollment is tied to the farm – rather than the operator – it also has the potential to impact land values and cash rent values over the coming crop years. The optional nature of ACRE implies that land values and cash rents may increase for farms that are enrolled in the program, although the magnitude of that increase will vary due to both the expected size and likelihood of expected payments, and more fundamental risk management factors.
References
AGDM. 2009. ACRE Decision Tool. Ag Decision Maker, Iowa State University Extension, Ames, IA. Accessed December 2009. Available online at: http://www.extension.iastate.edu/agdm/decisionaidscd.html
AgManager. 2009. “Policy: 2008 Farm Bill, Background Papers and Presentations.” AgManager, Department of Agricultural Economics, Kansas State University, Manhattan, KS. Accessed August 2009. Available online at: http://www.agmanager.info/policy/
commodity/2007default.asp
AFPC. 2009. ACRE Decision Aid. The Agriculture and Food Policy Center, Texas A&M University, College Station, TX. Accessed August 2009. Available online at: http://www.afpc.tamu.edu/models/acre/index.php
Babcock, B.A. 2009a. “Odds of an ACRE Payment for Corn and Soybean Farmers.” Iowa Ag Review15(3). http://www.card.iastate.edu/iowa_ag_review/summer_09/article3.aspx
Babcock, B.A. 2009b. “ACRE: Price Support or Crop Insurance?” Iowa Ag Review15(2). http://www.card.iastate.edu/iowa_ag_review/spring_09/article3.aspx
FAPRI. 2009. FARM Tool. Food and Agricultural Policy Research Institute, University of Missouri, Columbia, MO. Accessed December 2009. Available online at: http://www.fapri.missouri.edu/farmers_corner/tools/acre.asp
Farmdoc. 2009. ACRE Resources. Farmdoc, University of Illinois at Urbana-Champaign, Urbana, IL. Accessed August 2009. Available online at: http://www.farmdoc.uiuc.edu/ policy/index.asp
FSA. 2009. ACRE Calculator. Farm Service Agency, United States Department of Agriculture, Washington, DC. Accessed August 2009. Available online at: http://www.fsa.usda.gov/ FSA/webapp?area=home&subject=dccp&topic=landing
Irwin, S.H., and D.L. Good. 2009. “Market Instability in a New Era of Corn, Soybean, and Wheat Prices.” Choices24(1): 6-11.
Kirwan, B. 2009. “The Incidence of U.S. Agricultural Subsidies on Farmland Rental Rates.” Journal of Political Economy117(1): 138-164. Lence, S.H. and A.K. Mishra. 2003. “The Impacts of Different Farm Programs on Cash Rents.” American Journal of Agricultural Economics,
Vol. 85, Issue 3: 753-761.
Schnitkey, G.D. and N.D. Paulson. 2009. “Historical Analysis of ACRE.” Farm Economics: Facts and Opinions 09-11. Department of Agricultural and Consumer Economics, University of Illinois at Urbana-Champaign, Urbana, IL. Accessed August 2009. Available online at: http://www.farmdoc.uiuc.edu/manage/newsletters/fefo09_11/ fefo09_11.html
Zulauf, C. 2009a. “ACRE Decision Question.” Department of Agricultural, Environmental, and Development Economics, The Ohio State University, Columbus, OH. Accessed August 2009. Available online at: http://aede.osu.edu/resources/docs/pdf/FS6QFAU0-7L5Q-VWXX-ZXK0PXVYKL69O5DV.pdf .
Zulauf, C. 2009b. “ACRE Decision Strategy: Diversify Election of Farm Program Suite.” Department of Agricultural, Environmental, and Development Economics, The Ohio State University, Columbus, OH. Accessed August 2009. Available online at: