BEST AVAILABLE TECHNIQUES GUIDANCE DOCUMENT ON
POWER GENERATION
FOREWORD
Best Available Techniques Economically Achievable (BAT) document had been prepared as a guidance notes for the nine (9) major industries in Malaysia and to support the implementation of the new Environmental Quality (Clean Air) Regulations 20xx. These documents were prepared based on the latest state-of-the-art technologies, internationally accepted limit values but had been adjusted and tailored to local requirements.
BAT is defined as the effective methods in preventing pollution and, where generally that is not practicable, to reduce emissions from industrial activities and their impact on the environment. This definition implies that BAT not only covers the technology used but also the way in which the installation is operated, to ensure a high level of environmental protection. Implementations of BAT in any specific industrial sectors are under economically and technically viable condition.
It is hope that the technical contents of these documents will prove beneficial to the industries in their endeavour to comply with the environmental regulations and standards through more cost-efficient means. In the identification of BAT, emphasis is placed on pollution prevention techniques rather than end-of-pipe treatment. These documents will be reviewed and updated from time to time. These documents have been prepared in consultations with the University of Malaya Consultancy Unit (UPUM), Malaysia German Technical Cooperation (GTZ) and the relevant industries/stakeholders. The Department of Environment wishes to record appreciation to representatives of the relevant industrial sectors, government agencies and individuals for their invaluable input.
DATO’ HALIMAH HASSAN
Director General
TABLE OF CONTENTS
LIST OF TABLES v
LIST OF FIGURES vii
LIST OF ABBREVIATIONS viii
1.0 PREFACE
1.1 Status of This Document 1
1.2 Definition of BAT 1
1.3 Objective of This Document 3
1.4 Information Sources 3
1.5 How to Use This Document 4
2.0 OVERVIEW OF POWER GENERATION IN MALAYSIA 5
3.0 PROCESS DESCRIPTION 6
3.1 Steam Boiler Turbine Power Plants 6
3.2 Fluidised Bed Combustion (FBC) 7
3.3 Internal Combustion Generation 8
3.4 Open Cycle Gas Turbine Generation (OCGT) 9
3.5 Combined-Cycle Gas Turbine (CCGT) 9
3.6 Cogeneration 11
4.0 PROCESS OPTIMIZATION 12
5.0 SOURCES OF AIR POLLUTANT EMISSIONS 13
5.1 Sulphur Oxides 13
5.2 Nitrogen Oxides 13
5.3 Dust and Particulate Matter 14
5.4 Heavy Metals 14
5.5 Carbon Monoxides 15
5.6 Hydrochloric Acid 15
5.7 Hydrogen Fluoride 15
5.8 Ammonia 15
6.0 EMISSION CONTROL OPTIONS 16
6.1 Primary Measures 16
6.2 Secondary Measures 16
7.0 RECOMMENDED PRACTICES AND EMISSION VALUES 34
7.1 Combustion of Solid Fuels 34
7.2. Combustion of Liquid Fuels 41
7.3 Liquid-Fuel-Fired (Diesel) Engines 46
7.4 Combustion of Gaseous Fuels 48
7.5 Combustion of Biomass Fuels 52
8.0 EMISSION MONITORING AND REPORTING 56
8.1 Online Monitoring 56
8.2 Stack Sampling 57
LIST OF TABLES
Table 1: Installed Capacity and power Generation in Malaysia
According to Fuel Type 5
Table 2: Status of Approved SREP 6
Table 3: Primary Measures for Emission Control 16
Table 4: General Performance of Particulate Matter Cleaning
Devices 19
Table 5a: General Performance of the Wet Lime/Limestone
Scrubber for Reducing Sulphur Oxide Emissions 23
Table 5b: General Performance of Seawater Scrubbing for
Reducing Sulphur Oxide Emissions 24
Table 5c: General Performance of the Spray Dry Scrubber for
Reducing Sulphur Oxide Emissions 25
Table 5d: General Performance of Different Sorbent Injection
Techniques for Reducing Sulphur Oxide Emissions 26
Table 5e: General Performance of Regenerative Techniques
for Reducing Sulphur Oxide Emissions 27
Table 6: General Performance of Primary Measures for
Reducing NOx Emission 29
Table 7: General Performance of Secondary Measures for
Reducing NOx Emission 32
Table 8: General Performance of Different Sorbent Injection
Techniques for Reducing Sulphur Oxide and
Nitrogen Emissions 33
Table 9: BAT for the Unloading, Storage and Handling of Coal,
Lignite and Additives 34
Table 10: Levels of Thermal Efficiency Associated with the
Application of the BAT Measures 36
Table 11: BAT for Dedusting Off-Gasses from Coal-Fired
Table 12: BAT for the Prevention and Control of Sulphur
Dioxide from Coal-Fired, Lignite Combustion Plants 39
Table 13: BAT for Nitrogen Oxide Prevention and Control
in Coal-and Lignite-Fired Combustion Plants 40
Table 14: BAT for the Unloading Storage and Handling of Liquid
Fuel and Additives 41
Table 15: BAT or the Dedusting Off-Gases from Liquid Fuel
Fired Combustion Plants 43
Table 16: BAT for Prevention and Control of Sulphur Dioxide
from Liquid-Fuel-Fired Combustion Plants 44
Table 17: BAT for Prevention and Control in Liquid-Fuel-Fired
Combustion Plant 45
Table 18: BAT for Dedusting Off-Gases from Engines Plants
by Primary Engine Measures 46
Table 19: BAT Associated NOx Levels for Liquid-Fuel-Fired
Engine Plants with SCR as BAT 47
Table 20: BAT for the Supply and Handling of Gaseous Fuels 48
Table 21: Efficiency of Gas-Fired Combustion Plants Associated
to the Use of BAT 50
Table 22: Reduction of NOx and CO Emission from Gas
Fired Combustion Plants 51
Table 23: Types of Biomass Furnaces with Typical Applications
and Fuels 52
Table 24: Supply and Handling of Biomass Fuels 53
Table 25: BAT for Biomass Fuel Pretreatment and Combustion 54
Table 26: PCDD/PCDF Emission Control Measures for Biomass
LIST OF FIGURES
Figure 1: Schematic Diagram of Steam Turbine Power Plant 7
Figure 2: Schematic Diagram of Open Cycle Gas Turbine 9
Figure 3: Schematic Diagram of Combine Cycle Gas Turbine 11
Figure 4: Schematic Diagram of Cogeneration System 12
Figure 5: Overview of currently used Particulate Matter Control
Devices 18
Figure 6: Overview of Technologies Used to Reduce Sulphur
Oxide Emissions 22
Figure 7: Overview of Primary Measure for Reducing Nitrogen
Oxide Emissions 28
Figure 8: Process Control and Air Emissions Monitoring in Power
Plants 56
LIST OF ABBREVIATIONS
BAT - Best Available Techniques
BFBC - Bubbling Fluidised Bed Combustion
BREF - Best Available Technique Reference Document
CAR - Clean Air Regulation
CCGT - Combined Cycle Generation
Cd - Cadmium
CFBC - Circulating Fluidised Bed Combustion
CO - Carbon Monoxide
DOE - Department of Environment
ESP - Electrostatic Precipitators
FBC - Fluidised Bed Combustion
FGD - Flue Gas Desulphurization
HCl - Hydrogen Chloride
HF - Hydrogen Flouride
HRSG - Heat Recovery Steam Generation
IPPC - Integrated Pollution Prevention Control
kg/h - kilogram per hour
mg/Nm3 - milligram per cubic metre at standard temperature
(273K) and pressure (1atm)
N2O - Nitrous Oxide
NMVOCs - Non Methane Volatile Organic Compounds
NOx - Nitrogen Oxide
SOx - Sulphur Oxide
TOC - Total Organic Compound
1.0 PREFACE
1.1 Status of This Document
This document forms a part of a series presenting the guidance notes for selected industries in Malaysia (list given at the end of this preface) to apply best available techniques economically achievable (BAT), associated monitoring and developments in them. This series is published by the Department of Environment (DOE) in accordance to the Environmental Quality (Clean Air) Regulations 2014 (CAR 2014).
1.1 Definition of BAT
In order for the user of this document to understand the legal context of this document, the interpretation on the definition of BAT is taken from Regulation 2 – Interpretation of CAR 2014 and described as below:
―Best Available Techniques Economically Achievable‖ means the effective methods in preventing pollution and, where that is not practicable, generally to reduce emissions in the air from the industrial activities and their impact on the environment as a whole. In this regard:
―Techniques‖ includes both the technology used and the way in which the facility is designed, built, maintained, operated and decommissioned;
―Available Techniques‖ means those techniques that are accessible to the occupier and that are developed on a scale that allows implementation in the relevant industrial sector, under economically and technically viable conditions, taking into consideration the costs and advantages; and
―Best‖ means effective in achieving a high general level of protection of the environment as a whole;
On the basis of this assessment, techniques, and as far as possible emission and consumption levels associated with the use of BAT, are presented in this
document that are considered to be appropriate to the sector as a whole and in many cases reflect current performance of some installations within the sector. Where emission or consumption levels ―associated with best available techniques‖ are presented, this is to be understood to mean those levels representing the environmental performance that could be expected as a result of the application, of the techniques described, taking into account the balance of costs and advantages inherent within the definition of BAT. However, they are neither emission nor consumption limit values and should not be understood as such.
In some cases it may be technically possible to achieve better emission or consumption levels but due to the costs involved or cross media considerations, they are not considered to be appropriate as BAT for the sector as a whole. However, such levels may be considered to be justified in more specific cases where there are special driving forces.
The emission and consumption levels associated with the use of BAT have to be seen together with any specified reference conditions (e.g. averaging periods).
The concept of ―levels associated with BAT‖ described above is to be distinguished from the term ―achievable level‖ used elsewhere in this document. Where a level is described as ―achievable‖ using a particular technique or combination of techniques, this should be understood to mean that the level may be expected to be achieved over a substantial period of time in a well maintained and operated installation or process using those techniques.
The actual cost of applying a technique will depend strongly on the specific situation such as taxes, fees, and the technical characteristics of the installation concerned. It is not possible to evaluate such site-specific economic viability of techniques drawn from observations on existing installations.
The purpose of CAR 2014 is to achieve prevention and control of pollution arising from activities listed in its First Schedule and Second Schedule. More specifically, it provides for a notification system for certain categories of industrial installations to conduct an integrated and comprehensive view of the pollution and consumption potential of their installation. The overall aim is to ensure a high level of protection of the environment as a whole based on appropriate preventative measures through the application of BAT.
1.2 Objective of This Document
The ‗emission minimization principle‘ as cited in CAR 2014 requires that the goal of emission abatement is to achieve minimum emissions as a result of applying current BAT. Hence this guideline document is meant to provide the reference information for the permitting authorities to take into account when determining permit conditions. This document should serve as valuable input to achieve better environmental performance.
1.3 Information Sources
The information is mainly based on the European IPPC BREF document
where the assessment was achieved through an iterative process involving the following steps:
identification of the key environmental issues for the sector
examination of the techniques most relevant to address those key issues;
identification of the best environmental performance levels, on the basis of the available data world-wide;
examination of the conditions under which these performance levels
were achieved; such as costs, cross-media effects, main driving forces involved in Implementation of these techniques;
selection of the BAT and the associate emission and/or consumption levels for this sector
1.5 How to Use This Document
It is intended that the general BAT in this document could be used to judge the current performance of an existing installation or to judge a proposal for a new installation and thereby assist in the determination of appropriate BAT based conditions for that installation. It is foreseen that new installations could be designed to perform at or even better than the general BAT levels presented here. It is also considered that many existing installations could reasonably be expected, over time, to move towards the general "BAT" levels or perform better. This reference document does not set legally binding standards, but they are meant to give information for the guidance of industry, the relevant government bodies and the public on achievable emission and consumption levels when using specified techniques.
The structure of the guideline document is as follows:
An overview of each particular sector in the Malaysian context is firstly covered briefly followed by process description, process optimization, sources of pollution, emission control options, recommended practices and emission values and finally emission monitoring and reporting. More often than not, trade-off judgements between different types of environmental impacts and specific site condition are the influencing factors.
Another important point to note is that BAT change over time and this guidance document needs to be reviewed and updated as appropriate.
2.0 OVERVIEW OF POWER GENERATION IN MALAYSIA
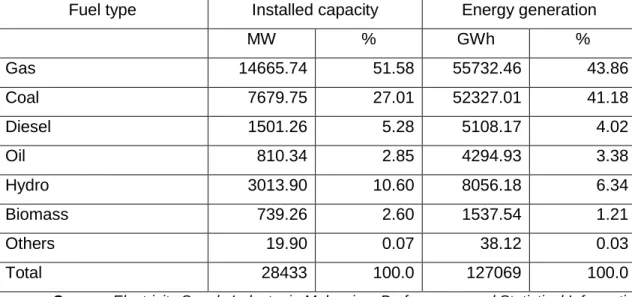
The three main electricity utilities in Malaysia are: Tenaga Nasional Berhad (TNB) which operates in Peninsular Malaysia, Sabah Elctricity Sendirian Berhad (SESB) in Sabah, and Sarawak Electricity Supply Corporation (SESCO) in Sarawak. In addition independent power producers (IPPs) contribute significantly to the supply of electricity in the country. The total installed generation capacity in the country at the end of 2011 was 28433 MW with a plant mix of 51.58% gas turbine and combined cycle, 27.01% coal, 10.60% hydro, 5.28% diesel, 2.85 % oil/gas thermal and the remaining others such as biomass and co-generation. In the year 2011, the total electricity generated was 127069 GWh with a generation mix of gas (43.86%), coal (41.18%), hydro (6.34%) and the rest diesel and biomass. (Source: Electricity Supply Industry in Malaysia – Performance and Statistical Information, Energy
Commission, 2011 Edition).
The installed capacities of power plants in Malaysia and electricity generation according to fuel type are given in Table 1.
Table 1: Installed Capacity and Power Generation in Malaysia According to Fuel Type
Fuel type Installed capacity Energy generation
MW % GWh % Gas 14665.74 51.58 55732.46 43.86 Coal 7679.75 27.01 52327.01 41.18 Diesel 1501.26 5.28 5108.17 4.02 Oil 810.34 2.85 4294.93 3.38 Hydro 3013.90 10.60 8056.18 6.34 Biomass 739.26 2.60 1537.54 1.21 Others 19.90 0.07 38.12 0.03 Total 28433 100.0 127069 100.0
Source: Electricity Supply Industry in Malaysia – Performance and Statistical Information,
The Small Renewable Energy Programme (SREP) which was launched in year 2001 to encourage private sector to undertake small power generation project using renewable resources has not been progressing well due to number of factors such as uncertainty in long term fuel supply and challenges in securing loans for financing projects.
Table 2: Status of Approved SREP Type of renewable energy Number of approved applications Capacity MW Biomass 21 204 MW Biogas 9 20.85 MW Minihydro 13 61.3 MW
Wind and solar 0 0
Total 43 286.15MW
Source: Energy Commission, March 2010
3.0 PROCESS DESCRIPTION
In the fuel electric power generation, the thermal energy is transformed to electrical energy. There are six main processes:
3.1 Steam Boiler Turbine Power Plants
Heat for the system is provided by the combustion of coal, biomass, natural gas or oil. The fuel is pumped into the boiler‘s furnace. The boiler generates steam in the pressurized vessel in small boilers or in the water-wall tube system in modern utility and industrial boilers. High temperature, high-pressure steam generated in the boiler is fed to a turbine as shown schematically in Figure 1. At the outlet of the steam turbine there is a condenser, which is kept at low temperature and pressure. Steam rushing from the high-pressure boiler to the low-pressure condenser drives the turbine blades, which power the electric generator. There are three types of boilers
commonly used: natural circulation, forced circulation, and once-through boilers.
Figure 1: Schematic Diagram of Steam Turbine Power Plant
3.2 Fluidised Bed Combustion (FBC)
Fluidised bed combustion is mainly used for industrial applications where different solid fuels such as coal, lignite, peat, and particularly biomass are burned. There are two main types of FBC boilers:
Bubbling fluidised-bed combustion (BFBC) is a modern combustion
technology especially suited for burning inhomogeneous biofuels: BFBC consists of a 0.5-1.0 m high bed on a fluidizing air distribution plate. The fluidising velocity is about 1 m/s. The density of the bubbling bed is about 1000 kg/m3. Typical bed materials used are sand, ash, fuel, dolomite, limestone etc. The particle size distribution in the fluidising bed material is typically within 0.5-1.5 mm.
Circulating fluidized bed combustion (CFBC) in which a part of the bed
second pass of the boiler. The particles exiting the furnace are separated from the flue gas flow by a cyclone or by other separation methods and recirculated back to the fluidized bed. The separation can be done in the middle of the second pass and also at the outlet of the boiler. Electrostatic precipitators and fabric filters can be used as an emission control device for this process. As a rule of thumb, the bed material particle size is in the range of 0.1-0.6 mm, and fluidizing velocity is 4-6 m/s.
3.3 Internal Combustion Generation
Internal combustion generation units, also known as diesel engines, have one or more cylinders in which fuel combustion occurs. Internal combustion generating units convert the chemical energy of fuels into mechanical energy in a design similar to that of an automobile engine. The engine is attached to the shaft of the generator to produce electricity. Internal combustion generators are small and medium, ranging from 2 MW to greater than 50 MW capacities.
Mitigation measures given below can be considered to reduce pollution emitted from the process.
* Catalytic converter – typically a stainless steel box mounted in the exhaust system fitted with an autocatalyst (a ceramic or
metallic substrate with an active coating
incorporating alumina, ceria and other oxides and combinations of the precious metals - platinum, palladium and rhodium).
* Diesel particulate trap filter (soot trap) – consist of a filter material positioned in the exhaust designed to collect solid
and liquid particulate
3.4 Open Cycle Gas Turbine Generation (OCGT)
Gas turbine systems operate in a manner similar to steam turbine systems except that combustion gases are used to turn the turbine blades instead of steam. In addition to the electric generator, the turbine also drives a rotating compressor to pressurize the combustion air, which is then mixed with either gas or liquid fuel in a combustion chamber. Unlike a steam turbine system, gas turbine systems do not have boilers and condensers. A schematic diagram of gas turbine generation system is given in Figure 2.
Figure 2: Schematic Diagram of a Open Cycle Gas Turbine
3.5 Combined-Cycle Gas Turbine (CCGT)
Combined-cycle generation is a configuration using both gas turbines and
steam generators as shown in Figure 3. In a CCGT, the hot gases of a gas
turbine are used to provide all, or a portion of, the heat source for the boiler, which produces steam for the steam generator turbine. This combination
increases the thermal efficiency over that of a coal- or oil- fuelled steam generator.
There are four main configurations:
Gas Turbine plus Heat Recovery Steam Generator (HRSG): The hot
off-gases from the gas turbine are used to generate steam in a heat recovery steam generator downstream of the gas turbine.
Gas Turbine plus Supplementary-Fired Steam Generator: A portion of
the oxygen in the gas turbine exhaust is used to support further combustion in a supplementary firing system in the connecting duct between the gas turbine and the steam generator.
Gas Turbine plus Furnace-Fired Steam Generator: this generator is the
same as the gas turbine plus supplementary-fired steam generator, except that essentially all of the oxygen from the gas turbine exhaust is used to support further combustion.
Supercharged Furnace-Fired Steam Generator plus Gas Turbine: A
steam generator is placed between the air compressor and the gas turbine. The air compressor is used to pressurize the boiler where the fuel is fired. The products of combustion that have been cooled within the boiler are then discharged through a gas turbine.
Figure 3: Schematic Diagram of a Combined Cycle Gas Turbine
3.6 Cogeneration
Cogeneration is a merging of a system designed to produce electric power and a system used for producing industrial heat and steam. A schematic diagram is given in Figure 4. This system is a more efficient way of using energy inputs and allows the recovery of otherwise wasted thermal energy for use in an industrial process. Cogeneration technologies are classified as ―topping cycle‖ and ―bottoming cycle‖ systems, depending on whether electrical (topping cycle) or thermal (bottoming cycle) energy is derived first.
Figure 4: A Schematic Diagram of a Cogeneration System
4.0 PROCESS OPTIMIZATION
To increase the efficiency of electricity and heat generation, the first option is to replace or further optimize the main process items such as turbines, pumps and pollution control systems. Further measures to increase conventional power plant efficiency include lowering the condenser pressure, optimize the feed-water preheat system, utilization of waste heat and the use of supercritical steam cycle conditions.
The use of advanced computerized control system in order to achieve a high boiler efficiency with improve combustion conditions that support the reduction of emissions are considered as BAT.
5.0 SOURCES OF AIR POLLUTANT EMISSIONS
The major air pollutants released from the combustion of fossil fuels and biomass are SO2, NOx, particulate matter including emissions of particulate
matter of aerodynamic diameters less than 10µm, called PM10. Other
substances such as heavy metals, HF, HCl, unburned hydrocarbons, non-methane volatile organic compounds (NMVOCs) and dioxins are emitted in smaller quantities.
5.1 Sulphur Oxides (SOx)
Emissions of SOx result mainly from the presence of organic and inorganic
sulphur in the fuel. During combustion, by far the majority of sulphur oxides are produced in the form of sulphur dioxide SO2. For solid and liquid fuels, 1
to 3 % of the sulphur is oxidized to sulphur trioxide (SO3). This reaction is
catalysed by transition metals. Biomass fuels are characterized by lower sulphur content than coal.
5.2 Nitrogen Oxides (NOx)
The principal oxides of nitrogen emitted during combustion of fossil fuels are nitric oxide (NO), nitrogen dioxide (NO2), and nitrous oxide (N2O). The first
two of these form the mixture known as NOx, which accounts for more than 90
% of the NO in the main types of large combustion installations.
The formation of NOx is governed by three essential mechanisms:
thermal NOx results from the reaction between the oxygen and nitrogen
from air (high a combustion temperature more than 1000 C)
fuel NOx is formed from the nitrogen contained in the fuel (high
contribution when combustion temperature less than 1000 C).
prompt NOx is formed by the conversion of molecular nitrogen in the flame
front in the presence of intermediate hydrocarbon compounds (low contribution to NOx).
The formation mechanism of N2O is not well understood. A possible
mechanism is based on the formation of intermediate products (HCN, NH3),
which is comparable to the formation of NO. It has been found that lower combustion temperatures (below 1000 C), cause higher N2O emissions.
5.3 Dust and Particulate Matter
The dust emitted during the burning of coal, peat, and biomass arises almost from the mineral fraction of the fuel. A small proportion of the dust may consist of very small particles formed by the condensation of compounds volatilized during combustion.
The combustion of liquid fuels is also a source of particulate emissions, although to a lesser extent than coal. In particular, poor combustion conditions lead to the formation of soot, which is liable to produce acid agglomerates with corrosive properties in the presence of sulphur trioxide.
For many installations, there are also potential diffuse emissions (open-air handling and storage of coal, the crushing of the coal used in pulverized coal boilers, the handling of ash etc.)
5.4 Heavy Metals
The emission of heavy metals results from their presence as natural components in fossil fuels. Most of the heavy metals considered (As, Cd, Cr, Cu, Hg, Ni, Pb, Se, Zn, V) are normally released as compounds ( e.g. oxides, chlorides) in association with particulates. Only Hg and Se are at least partly present in the vapour phase.
5.5 Carbon Monoxide
Carbon monoxide (CO) always appears as an intermediate product of the combustion process, particularly under incomplete combustion conditions.
5.6 Hydrochloric Acid
The emission of hydrochloric acid (HCl) is due to trace amounts of chloride present in fossil fuels such as coal and oil. Emission of HCl is significant in combustion plants without flue-gas desulphurization (FGD).
5.7 Hydrogen Fluoride
When using fossil fuels such as coal without FGD, fluoride is liberated and released to the flue gas. It combines with hydrogen to form hydrogen flouride, and with the moisture of the ambient air to form hydrofluoric acid. It has been observed that hydrogen flouride may be emitted by carry-over from the rotating heat-exchanger and combustion air preheater.
5.8 Ammonia (NH3)
The emission of ammonia (NH3) does not result from the combustion of fossil
fuels, but rather the consequence of an incomplete reaction of ammonia in the denitrification process.
5.9 Volatile Organic Compounds (VOC)
Among the persistent organic compounds to be emitted during the combustion of fossil fuels are the polycyclic aromatic hydrocarbons (PAHs), the polychlorodibenzo-dioxins (PCDDs) and the polychlorodibenzo-furans (PCDFs).
6.0 EMISSION CONTROL OPTIONS
The reduction of emissions from large combustion plants should consider using both measures:
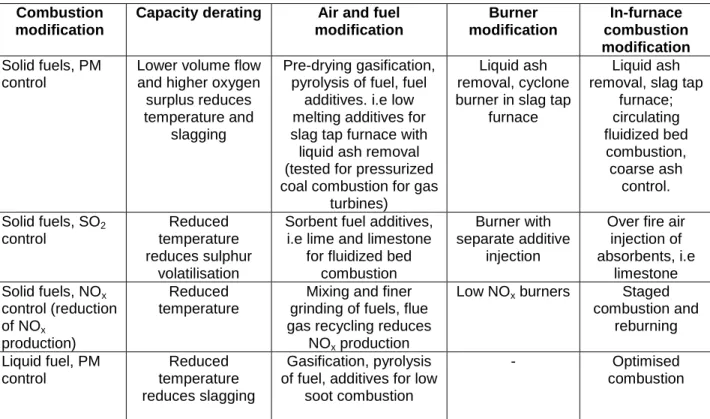
6.1 Primary measures: Integrated measures to reduce emissions at source or during combustion such as fuel switching (from solid to liquid or gas, liquid to gas), use of fuels with lower sulphur or nitrogen content, combustion modifications such as the use of additives to reduce emissions, capacity derating, burner modification, air and fuel modification (flue gas recycling, fuel air premix, fuel mixing, drying, finer grinding, gasification, pyrolysis). Possible measures to apply for combustion modification are given in Table 3.
6.2 Secondary measures: Control technologies used to reduce emissions before being released to air. They are pollutant specific measures that are described in the subsequent paragraph. A general schematic diagram for controlling emission as shown in Figure 5.
Table 3: Primary Measures for Emission Control
Combustion modification
Capacity derating Air and fuel modification Burner modification In-furnace combustion modification Solid fuels, PM control
Lower volume flow and higher oxygen surplus reduces temperature and
slagging
Pre-drying gasification, pyrolysis of fuel, fuel
additives. i.e low melting additives for slag tap furnace with
liquid ash removal (tested for pressurized coal combustion for gas
turbines)
Liquid ash removal, cyclone burner in slag tap
furnace
Liquid ash removal, slag tap
furnace; circulating fluidized bed combustion, coarse ash control. Solid fuels, SO2 control Reduced temperature reduces sulphur volatilisation
Sorbent fuel additives, i.e lime and limestone
for fluidized bed combustion
Burner with separate additive
injection
Over fire air injection of absorbents, i.e limestone Solid fuels, NOx control (reduction of NOx production) Reduced temperature
Mixing and finer grinding of fuels, flue gas recycling reduces
NOx production
Low NOx burners Staged combustion and reburning Liquid fuel, PM control Reduced temperature reduces slagging Gasification, pyrolysis of fuel, additives for low
soot combustion
- Optimised
Combustion modification
Capacity derating Air and fuel modification Burner modification In-furnace combustion modification Liquid fuel, SO2 control
- Additive for absorption - -
Liquid fuel, NOx control (reduction of NOx production) Reduced temperature
Flue-gas recycling Low NOx burners Staged combustion*, reburning water and steam injection.** Gaseous fuel, PM control Optimised combustion Gaseous fuel, SO2 control Gaseous fuel, NOx control (reduction of NOx production) Reduced temperature
Flue gas recycling fuel air premixing**
Low NOx burner Staged combustion* reburning, water
and steam injection** Notes:
* not applicable to gas turbines **
only practiced for gas turbines
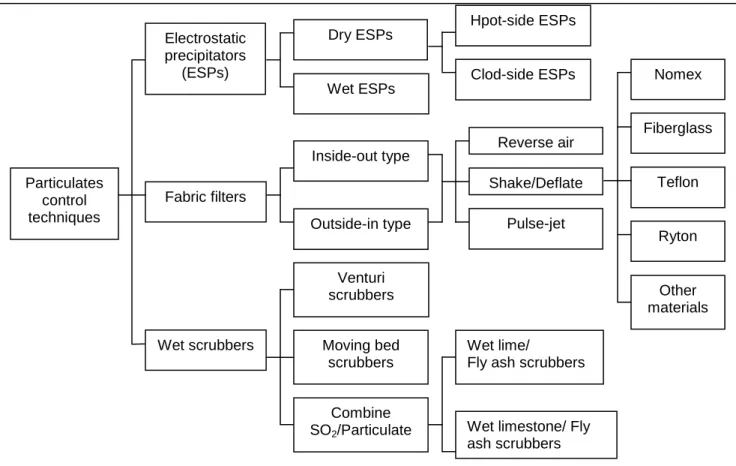
6.2.1 Techniques to Reduce Particulate Emissions:
Different technologies such as electrostatic precipitators (ESP), fabric filters, and wet scrubbers are commonly used to remove particulate matter from the flue gas. The currently used particulate matter control devices are given in Figure 5.
Figure 5: Overview of the Currently Used Particulate Matter Control Devices
ESPs with fixed/rigid electrodes are the most important technology currently used. Cold-side ESPs are located after the air preheater and operate over the temperature range of 130-180 C. Hot-side ESPs are located before the air preheater and operate over the temperature range of 300-450 C. Fabric
filters which operate over the temperature range of 120-220 C are becoming
increasingly important. The choice between applying an ESP or fabric filtration generally depends on the fuel type, plant size, boiler type and the configuration. Both technologies are highly efficient devices. Wet scrubbers for dust control are used far less than ESPs and fabric filters. They are characterized by lower removal efficiencies, especially of fine particles, compared to ESPs and fabric filters.
Table 4 gives the performance of particulate matter cleaning devices.
Particulates control techniques Electrostatic precipitators (ESPs) Fabric filters Wet scrubbers Dry ESPs Wet ESPs Inside-out type Outside-in type Moving bed scrubbers Venturi scrubbers Combine SO2/Particulate Hpot-side ESPs Fiberglass Clod-side ESPs Reverse air Shake/Deflate Pulse-jet Teflon Ryton Other materials Nomex Wet lime/
Fly ash scrubbers
Wet limestone/ Fly ash scrubbers
Table 4: General Performance of Particulate Matter Cleaning Devices
Technology Removal efficiency % [35, ERM 1996] Other performance parameters Remarks <1 µm 2 µm 5 µm >10 µm Parameter Value Electrostatic precipitator (ESP) >96.5 >98.3 >99.95 >99.95 Operating temperature 120 - 220 ° C (cold ESP) 300 – 450 ° C (hot ESP)
the ESP has a very high efficiency, even for smaller particles
can handle very large gas volume with low pressure drop
low operating costs, except at very high removal rates
can operate at any positive pressure condition
the ESP is not very flexible, once installed, to changes in operating conditions
it might not work on particulates with very high electrical resistivity. Fabric filter >99.6 >99.6 >99.9 >99.95 Operating temperature 200 °C (polyester ) 280 °C (fiberglas s)
filtration velocities generally lie in the range 0.01 to 0.04 m/s according to the application, the filter type and the cloth
typical values being used in power plant bag houses are 0.45 – 0.6 m/min for reverse-air, 0.75 -0.9m/min for shaker, and 0.9 -1.2m/min for pulse-jet applications
bag life decreases as coal sulphur content increases and as the filtering velocity increases
Individual bags fail at an average annual rate of about 1% of installed bags
the pressure drop increase as the particle size decreases for a given flue-gas throughput. Energy consumption 0.4 – 0.7 (kWh/100 0m3) Pressure drop 5 -20 (102 Pa) Residue Fly ash Off-gas flow
rate
<1100000 m3/h Applicability Solid and
liquid fuels
Cyclone 85 – 90 %. The smallest diameter of the dust trapped is 5 to 10 µm
Limited performance, can therefore only be used with other techniques for dust control
Wet scrubber (high energy venturi) 98.5 99.5 99.9 >99.9 Operating temperature
as a secondary effect, wet scrubbers contribute to the removal and absorption of gaseous heavy metals
waste water is produced, which needs treatment and further discharge. Energy consumption as % of electric capacity Up to 3% (5-15 (kWh/100 0m3)) Liquid to gas ratio 0.8 – 2.01/m3 Pressure drop 30 – 200(102 Pa) Residue Fly ash
sludge/ slurry
6.2.2 Techniques to Reduce Sulphur Oxide Emissions
Sulphure oxides are emitted from most fossil fuel combustion through oxidation of the sulphur contained in the fuel.
6.2.2.1 Primary Measures to Reduce Sulphur Oxide Emissions
Primary measures to reduce SOx emissions include the use of low sulphur content fuels and use of adsorbents in fluidized bed combustion. The adsorbents utilized are CaO, Ca(OH)2 or CaCO3 with a stoichiometric ratio
(fuel/adsorbent) ranging from 1.5 to 7 depending on the fuel.
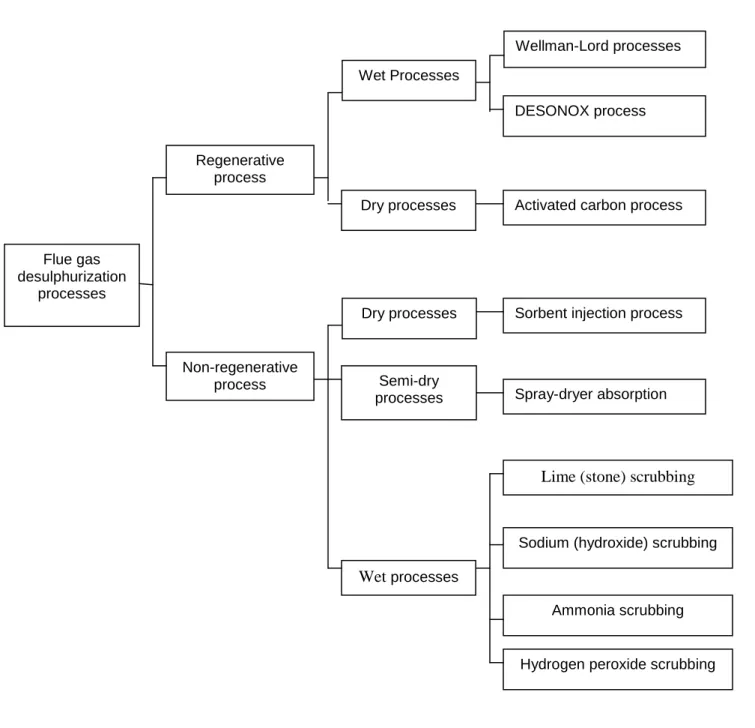
6.2.2.2 Secondary Measures to Reduce Sulphur Oxide Emissions
The common flue-gas desulphurization (FGD) technologies are given in Figure 6.
Wet scrubbers, especially the limestone-gypsum processes, are the leading
FGD technologies (80 % of the market share) due to their high SO2 removal
efficiency and their high reliability. Limestone is used in most cases as the sorbents. Other sorbent used include sodium and magnesium which as used in small industrial boilers.
The performance of flue gas desulphurization techniques are given in Tables
Figure 6: Overview of Technologies Used to Reduce Sulphur Oxide Emissions Flue gas desulphurization processes Regenerative process Non-regenerative process Wet Processes Dry processes Dry processes Wet processes Semi-dry processes Wellman-Lord processes DESONOX process
Activated carbon process
Sorbent injection process
Spray-dryer absorption
Ammonia scrubbing
Hydrogen peroxide scrubbing Sodium (hydroxide) scrubbing
Table 5a: General Performance of the Wet Lime/Limestone Scrubber for Reducing Sulphur Oxide Emissions
Technique General SO2
reduction rate
Other performance parameters Remarks
Parameter Value Wet lime/ limestone scrubber 92 - 98 % (depending on the absorber type)
Operating temperature 45 - 80 °C of the total installed FGD capacity, 80% are wet scrubbers of which 72% use limestone as the reagent, 16 % use lime and 12 % use other reagents
the selection of limestone (high calcium carbonate content, low Al, F and Cl content) is an important issue to assure a good SO2 removal rate
sometimes organic buffers are used to maintain the pH-value of the scrubbing solution
the energy loss due to the reheating of the flue gas is large compared to dry FGD systems and
combined SO2/NOx removal systems, which do not generally require flue-gas reheating
the problem associated with the rotating gas-gas heat –exchanger operating at about 150o
C is inherent internal flue gas leakage, with from 3-5 % of the raw flue gas going directly to the stack without reducing the SO2 content
several plants use wet FGD systems with cooling tower discharge of cleaned flue-gas eliminate the need for costly reheating, save the reheating energy and result in significantly lower ground level
concentrations of emissions
the production of waste water is a disadvantage of the wet limestone scrubber
high water consumption
loss in the overall plant efficiency because of the high energy consumption (in average, a suspension pump consumes about 1 MW)
Sorbent Limestone lime
Energy consumption as % of electrical capacity
Pressure drop 20 - 30 (102 Pa) Ca/S molar ratio 1.02 - 1.1 Reliability 95 -99 % (of operating
time) Residue/by-product Gypsum
Gypsum purity 90 - 95 %
Residence time 10 sec
Lifetime of rubber lining >10 years (hard coal) SO3 removal rate <70%
HCl removal rate 95 - 99 % HF removal rate 95 - 99 % in the
absorber Particulate >50 % depending on
Table 5b: General Performance of Seawater Scrubbing for Reducing Sulphur Oxide Emissions.
Technique General SO2
reduction rate
Other performance parameters Remarks
Parameter Value
Seawater
scrubbing 85 - 98 %
Operating temperature (example)
145 oC (flue gas inlet) 88 oC (flue gas outlet)
seawater must be available
by applying a seawater scrubbing process to a combustion plant, the local conditions such as seawater conditions, tidal flows, the marine (aquatic) environment close to the scrubber water outlet, etc. needs to be carefully examined in order to avoid negative environmental and ecology effects. Effects may arise from the reduction of the pH level in the general vicinity of the power plants as well as from the input of remaining metals (heavy metals sometimes called trace elements) and fly ash. This is especially applicable to plants situated in an estuary
the applicability of the seawater scrubbing is very high as the process is simple and does not require slurry handling
the operating cost are low compared with a wet FGD system
the flue gas needs first to be dedusted
applicable only for high sulphur fuel
Sorbent Seawater/air
Residence time of seawater in aerator:
15 min Max. flue-gas flow per
absorber (example) 250000 m3/h Reliability 98 - 99 % Residue/by-product None Energy consumption as % of electric capacity .08 - 1.6 % HCL removal rate 95 - 99 %
HF removal rate 95 - 99 % in the absorber Water consumption (example) 15000 m3/h Waste water None (but sulphate ions dissolved in seawater)
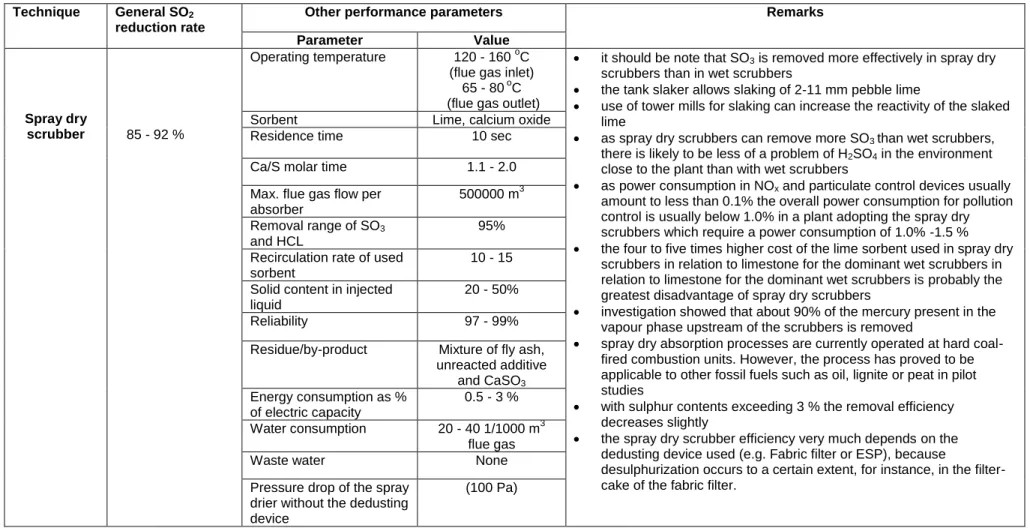
Table 5c: General Performance of the Spray Dry Scrubber for Reducing Sulphur Oxide Emissions
Technique General SO2
reduction rate
Other performance parameters Remarks
Parameter Value
Spray dry
scrubber 85 - 92 %
Operating temperature 120 - 160 oC (flue gas inlet)
65 - 80 oC (flue gas outlet)
it should be note that SO3 is removed more effectively in spray dry
scrubbers than in wet scrubbers
the tank slaker allows slaking of 2-11 mm pebble lime
use of tower mills for slaking can increase the reactivity of the slaked lime
as spray dry scrubbers can remove more SO3 than wet scrubbers,
there is likely to be less of a problem of H2SO4 in the environment
close to the plant than with wet scrubbers
as power consumption in NOx and particulate control devices usually
amount to less than 0.1% the overall power consumption for pollution control is usually below 1.0% in a plant adopting the spray dry scrubbers which require a power consumption of 1.0% -1.5 %
the four to five times higher cost of the lime sorbent used in spray dry scrubbers in relation to limestone for the dominant wet scrubbers in relation to limestone for the dominant wet scrubbers is probably the greatest disadvantage of spray dry scrubbers
investigation showed that about 90% of the mercury present in the vapour phase upstream of the scrubbers is removed
spray dry absorption processes are currently operated at hard coal-fired combustion units. However, the process has proved to be applicable to other fossil fuels such as oil, lignite or peat in pilot studies
with sulphur contents exceeding 3 % the removal efficiency decreases slightly
the spray dry scrubber efficiency very much depends on the dedusting device used (e.g. Fabric filter or ESP), because
desulphurization occurs to a certain extent, for instance, in the filter-cake of the fabric filter.
Sorbent Lime, calcium oxide Residence time 10 sec Ca/S molar time 1.1 - 2.0 Max. flue gas flow per
absorber
500000 m3 Removal range of SO3
and HCL
95% Recirculation rate of used
sorbent
10 - 15 Solid content in injected
liquid
20 - 50%
Reliability 97 - 99%
Residue/by-product Mixture of fly ash, unreacted additive and CaSO3 Energy consumption as % of electric capacity 0.5 - 3 % Water consumption 20 - 40 1/1000 m3 flue gas
Waste water None
Pressure drop of the spray drier without the dedusting device
Table 5d: General Performance of Different Sorbent Injection Techniques for Reducing Sulphur Oxide Emissions
Technique General SO2
reduction rate
Other performance parameters Remarks
Parameter Value Furnace sorbent injection 40 - 50 % 70 - 90% by recycling the reaction product Operating temperature 980 oC -1230 oC (upper furnace) 540 oC (economizer)
the efficiency of SO2 control is primarily a function of the Ca/S
molar ratio, the sorbent type, the degree of humidification, the additives available, the injection point and the boiler load.
to increase the SO2 removal efficiency, water can be sprayed
into the duct before the precipitator. This results in an improvement of the SO2 removal efficiency of about 10 %. problem of fouling, slagging and flame stability in the boiler
furnace sorbent injection can increase the amount of unburned carbon-in-ash
Sorbent Limestone, hydrated lime, dolomite
Reliability 99.9%
Boiler efficiency drop 2 % Energy consumption as
% of electric capacity
0.01 - 0.5 % Residue Ca salt mixture
Duct sorbent injection (dry
FGD)
50 - 90% (>90 % achieved at a power plant in the
US)
Operating temperature oC low capital costs and extremely simple installation
easy to retrofit (small space and short construction period)
no waste water
ash handling is more difficult because the ash is enriched with non-reacted lime, which causes the ash to harden after wetting
the tendency for duct wall deposits is increased. Sorbent Limestone, hydrated
lime, dolomite
Reliability 99.9 %
Energy consumption as % of electric capacity
0.5 % Residue Ca salt mixture Hybrid sorbent injection 50 - 90% (90% by reactivation of the unreacted CaO by humidification)
Residence time 3 sec used in some plant in the US
CFB dry scrubber
90 - 95 % Residence time 3 sec the CFB vessel is designed with an internal gas velocity range of 1.8 m/s to 6 m/s for boiler loads from 30% to 100 %
Table 5e: General Performance of Regenerative Techniques for Reducing Sulphur Oxide Emissions
Technique General SO2
reduction rate
Other performance parameters Remarks
Parameter Value Sodium sulphite bisulphate process 95 - 98 % Operating temperature in the absorber 55 – 90 o
C the sodium sulphite bisulphate process is actually not applied anymore in Europe
as the process uses a solution to absorb SO2, high efficiency
contacting devices such as valve trays or packed beds can be used without scaling problems
in some cases, for example, where a power station is near, or in, a city centre, transport of a large amount of materials (limestone and gypsum) into and out of the power station may well create a nuisance due to noise and traffic movements. In contrast, for the sodium sulphite bisulphate process, there are less traffic movements for caustic soda and sulphur
the sodium sulphite bisulphate process requires high capital cost, and a high demand both in number and qualification of the operating staff and a high power consumption.
Max S content in the fuel
3.5 % Max. flue gas flow 600000 m3/h Solid content in injected
liquid 20 - 50 % Energy consumption as % of electric capacity 3 - 5.8 % Water consumption 70 - 200 m3/h (only pre-scrubber) Reliability > 95% Magnesium oxide process
n.a Energy consumption as % of electric capacity
n.a By product Elemental sulphur,
sulphuric acid or concentrated sulphur
oxide
Reliability n.a.
6.2.3 Techniques to Reduce Nitrogen Oxide Emissions
6.2.3.1 Primary Measures to Reduce NOx Emissions
There is a wide variety of primary emission reduction measures for nitrogen oxide formation. In these techniques the operational and design parameters of combustion installations are modified in order to minimize the formation of nitrogen oxide or to convert the formed nitrogen oxide inside the boiler prior to their release. An overview of the primary measures for reducing nitrogen
oxide emissions are given in Figure 7. The performances of such measures
are given in Table 6.
Figure 7: Overview of Primary Measures for Reducing Nitrogen Oxide Emissions Combustion modification Air staging Flue gas recirculation Fuel staging Air staging in the furnace Low NOx burners In furnace Low NOx Burners In furnace (Reburning) Low NOx burner Biased burner firing Over-fire air Low excess air Reduced air preheat Burner out of service
Table 6: General Performance of Primary Measures for Reducing NOx Emissions
Primary measure General NOx
reduction rate* General applicability Applicability limitations Remarks
Low excess air 10 - 44 % All fuels
incomplete burnout
for NOx reduction, it might be
necessary to seal the furnace, the mills and the air preheater in order to allow application of low excess air firing
Air staging in the furnace Burner out of service (BOOS) 10 - 65 % Maximum abatement levels for tangential-fired boilers of 40 % for coal, 45% for oil and 65 % for gas may
be achieved [32, Rentz,
1999]
Generally restricted to
gas and oil fired plants for
retrofit only
Incomplete burn-out (and thus
high CO and carbon levels)
problems may arise maintaining the fuels input, because the same amount of thermal energy has to be supplied to the furnace with fewer operating burners.
Biased burner firing (BBF)
All fuels for retrofit only
retrofitting overfire air on an existing boiler involves water-wall tube modifications to create the ports for the secondary air
NOx reduction of 10 % to 40 %
is possible for wall-fired furnaces using OFA. Overfir e air (OFA) All fuels Flue-gas recirculation 20 - 50 % <20% for coal-fired boilers and from 30 - 50% for gas-fired plants combined with overfire air [33, [CIEMAT] All fuels flame instability
retrofitting an existing boiler with flue-gas recirculation presents some adaptation difficulties, mostly due to efficiency losses of both the boiler and the burners, except when recirculating very small amounts of flue gas.
this NOx abatement measure
can be used for retrofitting when combined with air staging
recirculation due to recirculation fan.
Reduced air
preheating 20 - 30 %
Not suitable for coal-firing wet bottom boilers
the amount of emission reduction achievable mainly depends on the initial air preheating temperature and on the temperature that is achieved after this measure has been implemented. *Notes:
if different primary measures to reduce nitrogen oxide emissions are combined the reduction rate can, in general, neither be added nor be multiplied. The combined reduction rate depends on a number of site-specific factors and needs to be validated on a plant-by-plant basis
not all of the primary measures can be applied to all existing boilers, depending on the combustion configuration and the fuel
Primary measure General NOx reduction rate* General applicability Applicability limitations Remarks
Fuel staging (Reburning)
50 - 60 % (70 - 80% of the NOx formed in the primary combustion zone can be reduced) all fuels
reburning offers some advantages, such as compatibility with other primary NOx emission
reductions measures, simple installation of the technique, use of a standard fuel as reducing agent, and very small amounts of additional energy. The additional energy consumption by reburning coal over coal can be higher than using natural gas as a reburning fuel
combustion downstream of the primary zone also produces nitrogen oxides
when using natural gas as the reburning fuel,
particulate matter, SO2 and
CO2 are also reduced in
direct proportion to the amount of coal replaced.
Low NOx burner (LNB) Air-staged LNB 25 - 35 % all fuels flame instability incomplete burn-out
low NOx burners can be
used in combination with other primary measures such as overfire air and reburning of flue gas recirculation
low NOx burners with
overfire air can achieve reduction rates of 30-70% [33,Ciemat, 2000]
a drawback of first generation low-NOx burners is the space requirement of the flame separation: the diameter of low-NOx flames is about 30 to 50% larger than for conventional flames. Flue gas recirculation LNB Up to 20 % all fuels flame instability Fuel-staged LNB 50 - 60 % all fuels flame instability incomplete burn-out * Notes:
when combining different primary measures to reduce nitrogen oxide emissions the reduction rate can in general neither be added nor be multiplied. The combined reduction rate depends on a number of side specific factors and needs to be validated on a plants-by-plant basis
not all of the primary measure can be applied to all existing boilers, their application depends on the combustion configuration and the fuel
6.2.3.2 Secondary Measures to Reduce NOx Emissions
These are end-of-pipe techniques to reduce nitrogen oxide (NOx) already
formed. Most of the techniques use the injection of ammonia, urea or other compounds, which reduce NOx in the flue gas to molecular nitrogen. The
reduction can be catalytic (selective catalytic reduction, SCR) or non-catalytic (Selective non-catalytic reduction, SNCR). The performances of these techniques are given in Table 7.
6.2.4 Combined Techniques to Reduce SO2 and NOx Emissions
Combined techniques for the simultaneous removal of SO2 and NOx are not
widely used due commercial reasons. They can be classified as: solid adsorption/regeneration
gas/solid catalytic operation electron beam irradiation alkali injection
wet scrubbing
Table 7: General Performance of Secondary Measures for Reducing Nox Emissions
Secondary measure
General NOx
reduction rate
Other performance parameters Remarks
Parameter Value Selective catalytic reduction (SCR) 80 - 95 % Operating temperature 320 - 420 oC (high-dust) 260 - 320 oC (tail-end)
the ammonia slip increases with increasing NH3/NOx ratio, which may cause problems, e.g. with a too-high ammonia content in the fly ash. This is a problem which can be solved by using a larger catalyst volume and/or by improving the mixing of NH3 and NOx in the flue-gas
incomplete reaction of NH3 with NOx may result in the formation of ammonium sulphates, which are deposited on downstream facilities such as the catalyst and air preheater, increased amounts of NH3 in flue gas desulphurization waste waters, the air heater cleaning water, and increased NH3 concentration in the fly ash
catalyst lifetime is 4 -5 years for coal combustion, 7-10 years for oil combustion, and more than 10 years for gas combustion. Reducing agent Ammonia, urea
NH3/NOx ratio 0.8 - 1.0 NH3-slip <20 mg Nm3 Availability >98 % SO2/SO3 - conversion
rate with catalyst 1.0 -1.5 % (tail gas) Energy consumption
as % of electric capacity
0.5 % (high-dust) 2 % (tail gas) Pressure drop at the
catalyst 4 -10 (10 2 Pa) Selective non – catalytic reduction (SNCR) 30 - 50 (80) % Operating temperature 850 - 1050 0C
though some manufacturers report a NOx reduction level of over 80 %, the common view is that SNCR processes are in general capable of 30 -50 % reduction as an average covering different operational conditions. Further NOx reductions can be obtained on specific boilers where the conditions are good, as well as lower values where the conditions are bad, sometimes on existing plants [33, Ciemat. 2000]
SNCR cannot be used on gas turbines because of the residence time and temperature window required
Reducing agent Ammonia, urea NH3/NOx ratio 1.5 - 2.5 Availability > 97 % Energy consumption as % of electric capacity 0.1 - 0.3 % Residence time within temperature range 0.2 -0.5 sec S
Table 8: General Performance of Different Sorbent Injection Techniques For Reducing SO2 and NOx
Technique General SO2/NOx reduction rate
Other performance parameters
Remarks Parameter Value Activated Carbon Process 98-%/60 – 80%
Operating temperature 90 -150 % the activated carbon process also has a considerable potential for removing SO3 and air-toxic substances such as mercury and dioxins
waste water is only produced in small amounts from the operation of the prescrubber
several commercial systems have been installed, mainly in Germany and Japan
the process is capable of cleaning flue gases from different fuel types such as coal and oil.
Reagent Activated carbon/ ammonia
Reliability 98 %
Other substances
removed HCI , HF, dioxin Energy consumption as
% of electric capacity 1.2 – 3.3 % By-products Elemental sulphur,
or sulphuric acid NOXSO process 97 %/70 % (anticipated) Reagent Alumina beads impregnated with sodium carbonate
the NOXSO process is in the demonstration stage and is scheduled to be tested in a 108 MWe cyclone in the US under US DOE CCT -3 programme [33, Ciemat,2000] Energy consumption as
% of electric capacity 4 % WSA-SNOX
process 95 %/95 %
Reagent Ammonia very low particulate emissions (below 5 mg/m3) Energy consumption as
% of electric capacity 0.2 % DESONOX
process 95 %/95 %
Reagent Ammonia waste water is generated by the use of a wet ESP for the removal of sulphuric acid area aerosols
in theory, liquid SO2 sulphuric acid and elemental sulphur are possible to produce but plants commissioned to date have only produced sulphuric acid.
Reliability 96 -98 % Energy consumption as
7.0 RECOMMENDED PRACTICES AND EMISSION VALUES
7.1 Combustion of Solid Fuels
7.1.1 Unloading, Storage and Handling of Fuel and Additives
The BAT for preventing releases from the unloading, storage and handling of coal, and lignite and additives are given in Table 9.
7.1.2 Fuel Pretreatment
Blending and mixing of fuel to ensure stable combustion conditions and reduce peak emissions are considered as BAT. Switching from one type of coal to another with lower sulphur content can also be regarded as BAT.
Table 9: BAT for the Unloading, Storage and handling of Coal, Lignite, and Additives
Material Pollutant BAT
Coal and lignite
Dust
the use of loading and unloading equipment that minimizes the height of coal drop to the stockpile, to reduce the generation of fugitive dust
using water spray systems to reduce the formation of fugitive dust from coal stockpiles
grassing over long-term storage areas of coal to prevent fugitive emissions of dust and fuel loss caused by oxidation in contact with the oxygen in the air
applying the direct transfer of lignite via belt
conveyors from the mine to the on-site lignite storage area
placing transfer conveyors in safe, open areas above ground so that damage from vehicles and other equipment can be prevented
using cleaning devices for conveyor belts to minimize the generation of fugitive dust
using enclosed conveyors with well designed, robust extraction and filtration equipment on conveyor transfer points to prevent the emission of dust
rationalizing transport systems to minimize the generation and transport of dust within the site
the use of good design and construction practices and adequate maintenance.
Fire prevention
surveying storage areas for coal and lignite with automatic systems, to detect fires, caused by self-ignition and to identify risk points.
Lime and
limestone Dust
having enclosed conveyors, pneumatic transfer systems and silos with well designed, robust extraction and filtration equipment on delivery and conveyor transfer points to prevent the emission of dust.
7.1.3 Combustion
For the combustion of coal and lignite, pulverized combustion (PC), fluidized bed combustion (CFBC and BFBC) as well as pressurized fluidized bed combustion (PFBC) are considered to be BAT.
For PC tangential- and cyclone-fired boilers are preferred, because NOx and
CO emissions are lower than in wall-fired boilers. Firing systems that assure a high boiler efficiency and which include primary measures to reduce the generation of NOx emissions, such as air and fuel staging, advanced low NOx
burners etc. are considered as BAT.
7.1.4 Thermal Efficiency
The cogeneration of heat and power (CHP) is one the technically and economically most efficient means to increase the energy efficiency of an energy supply system.
The level of the thermal efficiency associated with the application of the BAT measures are given in Table 10.
Table 10: Levels of Thermal Efficiency Associated with the Application of the BAT Measures
Fuel Comb. Tech.
Unit thermal efficiency (net) (%)
New plants Retrofitted plants Coal and lignite Cogeneration (CHP) 75-90 75-90 Coal PC (DBB and WBB) 43-47 The achievable improvement of the thermal efficiency depends on the specific
plants, but as an indication a level of 36 –
40 % can be seen as associated with the use
of BAT FBC >41 PFBC >42 Lignite PC (DBB) 42 – 45 FBC >40 PFBC >42 7.1.5 Particulate Matter
The BAT for particulate matter removal is the use of electrostatic precipitator (ESP) or fabric filter.
Cyclones and mechanical collectors alone are not BAT, but they can be used as a pre-cleaning stage in the flue gas path.
The BAT associated emission levels are given in Table 11. These values are
Table 11: BAT for Dedusting Off – Gasses From Coal-Fired Combustion Plants
7.1.6 Heavy Metals
The BAT to reduce the emissions of heavy metals from the flue gases of coal- and lignite-fired combustion plants is to use a high performance ESP (reduction rate > 99.95 %) or a fabric filter (reduction rate > 99.99 %).
For the reduction of Hg emissions, the best levels of control are generally obtained by emission control systems that use FFs. An Hg emission level of less than 0.03 mg/Nm3 is considered to be BAT.
Capacity (MWth)
Dust-emission level
(mg/Nm3) BAT to reach
these levels Monitoring Applicability Comments New plant Retrofitted plants 50 -100 10 - 20 10 - 20 ESP or FF Continuous New and existing plants
the reduction rate associated with the use of an ESP is considered to be 99.5 % or higher
the reduction rate associated with the use of a fabric filter is considered to be 99.95 % or higher. 100 -300 5 - 15 5 - 15 ESP or FF in combination FGD (wet, sd or dsi) Continuous New and existing plants >300 5 - 10 5 - 10 ESP or FF in combination with FGD (wet) Continuous New and existing plants
the reduction rate associated with the use of an ESP is considered to be 99.5% or higher
the reduction rate associated with the use of a fabric filter is
considered to be 99.95% or higher
a wet scrubber used for desulphurization also reduces dust.
Notes :
ESP ( Electrostatic precipitator) FF (Fabric filter) FGD (wet) (Wet flue gas desulphurization)
FGD (sds) ( Flue-gas desulphurization by using a spray dryer)
FGD (dsi) ( Flue-gas desulphurization by dry sorbent injection)
For very high dust concentration in the raw gas, which might be the case when low calorific lignite is used as a fuel, the reduction rate of 99.95 % for the ESP or 99.99% for fabric filters is considered to be the BAT associated level, rather than the dust concentration levels mentioned in this table.
7.1.7 SO2 Emissions
The BAT for desulphurization and the associated emission levels are given in Table 12. The emission levels are based on a daily average, standard conditions and an O2 level of 6 %.
7.1.8 NOx Emissions
The BAT for the control of NOx emissions and the associated emission levels
are given in Table 13. The emission levels are based on a daily average, standard conditions and an O2 level of 6 %.
7.1.9 Carbon Monoxide
BAT for the control of CO emissions is complete combustion, which can be achieved by good furnace design, the use high performance monitoring and process control techniques, and maintenance of the combustion system. A well-optimised system to reduce emissions of NOx will also keep the CO level
down.
CO level should not exceed 30 mg/Nm3 for pulverized combustion and 100 mg/Nm3 for fluidized bed combustion. For lignite-fired combustion plants the CO levels should be in the range of 100-200 mg/Nm3.
Table 12: BAT for the Prevention and Control of Sulphur Dioxide from Coal- And Lignite-Fired Combustion Plants
Capacity (MWth)
Combustion technique
SO2 emission level associated with BAT
(mg/Nm3) BAT options to reach these levels Applicability Monitoring New plant Retrofitted plants 50 -100 PC 200-300 200-300
Low sulphur fuel and FGD (dsi) or
FGD (sds)
New and
retrofitted plants Continuous CFBC and PFBC 150-300 200-300 Limestone injection New and
retrofitted plants Continuous
BFBC
150-300 200-300
Low sulphur fuel and FGD (dsi),
FGD (sds)
New and
retrofitted plants Continuous
100-300 PC 100-200 100-250 FGD (wet) FGD (sds) FGD (dsi, up to about 200 MWth), Seawater scrubbing Combined techniques for the
reduction of NOx and SO2
New and
retrofitted plants Continuous
CFBC and PFBC 100-200 150-250 Limestone injection New and
retrofitted plants Continuous
BFBC
100-200 150-250
FGD (wet) FGD (sds)
New and
retrofitted plants Continuous >300 PC 20 -100 50 -150 FGD (wet) FGD (sds) Seawater scrubbing Combined techniques for the
reduction of NOx and SO2
New and
retrofitted plants Continuous
CFBC and PFBC 100 -200 100-200 Limestone injection New and retrofitted plants Continuous BFBC 20 -100 50 -150 FGD (wet) New and
retrofitted plants Continuous Notes :
PC (Pulverised combustion) BFBC (Bubbling fluidized bed combustion) CFBC ( Circulating fluidized bed combustion) PFBC (Pressurized fluidized bed combustion) FGD (wet) (wet flue gas desulphurization)
FGD (sds) (Flue gas desulphurization by using a spray drier) FGD(dsi) (Flue gas desulphurization by dry sorbent injection)