C
HAPTER
6:
R
ODENT
M
ANAGEMENT
6.1
SUMMARY OF OANRP RODENT CONTROL PROGRAM
Since 1997, OANRP has managed MIP and OIP species that are subject to rodent predation with various strategies. Some species are managed seasonally, such as during the Elepaio nesting season, while others are protected year-round, such as Achatinella spp. Methods have included using Ramik® mini-bars (rodenticide with 0.005% diphacinone) in small-scale bait station grids in combination with traps, bait station grids without traps, traps only in small grids, large-scale trapping grids, predator exclusion fences, and a recently deployed grid of automatic self-resetting rat traps (see section 6.4). OANRP is continually researching and assessing rat control methods to determine the most effective strategies for the protection of natural resources. Table 1 summarizes OANRP’s current rat control methods.
Table 1. Current rat control strategies utilized by OANRP as of October 2012. The number of traps in SBW, Moanalua, and Palehua are estimates for the 2013 Elepaio season. OANRP contracts Pono Pacific to conduct rat control and Elepaio monitoring at several sites.
6.2
RODENTICIDE CONCERNS AND CHANGING RODENT CONTROL STRATEGIES
In 2012, OANRP reviewed the effectiveness of rodenticide bait station grids program-wide andimplemented many changes in the overall rat control strategy. In consultation with the U.S. Fish and Wildlife Service, OANRP decided to significantly reduce the use of Ramik® as a management tool. This has led to a shift towards the use of rat trap only grids, both small and large. In this section, concerns with bait station grids are discussed first and then the changes in rat control program that OANRP instituted in 2012 are presented.
MU/Area Primary Threatened Spp. Rat Control Method # Bait Stations # Traps Type of Trap Deployment Period Baiting Interval
Ekahanui A. mustelina Bait Stations and Traps 27 47 Victor Year-round 6 weeks
Waieli- Hapapa A. mustelina Bait Stations and Traps 19 38 Victor Year-round 6 weeks
Ohikilolo A. mustelina, P. Kaalae Bait Stations and Traps 43 47 Victor w/ boxes Year-round 6 weeks
Opaeula Cabin None Bait Stations and Traps 4 6 Victor Year-round 6 weeks
Kahanahaiki A. mustelina Predator Exclosure N/A N/A N/A Year-round N/A
Palikea A. mustelina Predator Exclosure N/A N/A N/A Year-round N/A
Waieli- Hapapa A. mustelina Predator Exclosure N/A N/A N/A Year-round N/A
Koloa A. livida Trapping Grid 0 76 Victor w/ boxes Year-round 6 weeks
Makaha A. mustelina Trapping Grid 0 30 Victor Year-round 6 weeks
Kamaohanui- Skeet Pass A. mustelina Trapping Grid 0 60 Ka Mate Year-round 6 weeks
Kahanahaiki† A. mustelina, C. superba Trapping Grid 0 465 Victor w/ boxes Year-round 2 weeks
Palikea† A. mustelina Trapping Grid 0 189 Ka Mate Year-round 2 weeks
Palikea- Mauna Kapu A. mustelina Trapping Grid 0 15 Victor w/ boxes Year-round 6 weeks
Opaeula A. sowerbyana Trapping Grid 0 91 Victor w/ boxes Year-round 6 weeks
Poamoho A. sowerbyana Trapping Grid 0 16 Victor w/ boxes Year-round 6 weeks
W. Makaleha C. grimsiana Trapping Grid 0 28 Victor Year-round 6 weeks
Pahole** C. superba Trapping Grid 0 45 Automatic traps TBA- trial period TBA- trial period
SBW- N. Haleauau‡ A. mustelina Trapping Grid 0 28 Victor Year-round 6 weeks
SBW† Elepaio Trapping Grid 0 372* Victor Annual: Dec-June 2 weeks
Ekahanui† Elepaio Trapping Grid 0 619 Victor w/ boxes Annual: Dec-June 2 weeks
Moanalua† Elepaio Trapping Grid 0 312* Victor Annual: Dec-June 2 weeks
Palehua† Elepaio Trapping Grid 0 180* Victor Annual: Dec-June 2 weeks
Total: 93 2664
* Estimated # of traps. Each managed Elepaio territory will have 12 traps installed ~12 m apart in trees. All bait stations have been removed.
** Grid consists of new automatic self-resetting traps and are being tested at Pahole
† Contracted Pono Pacific to maintain rat grids during Elepaio nesting season
from rodent damage. In drier habitats, the Ramik® bait may persist for several weeks and still be palatable to rats. Bait station grids with snap traps at remote and relatively dry MUs, such as Ohikilolo MU, have shown to be a very useful management tool for protecting resources. Additionally, the dual method approach of using bait stations and snap traps together may kill more rats. For example, some rats may be more likely to consume Ramik® bait than trigger a snap trap.
However, there are many issues with rodenticide use that gave rise to questions about its use as a primary method for rat control in some areas. These issues include: Ramik® bait efficacy and dynamics,
palatability/longevity, and expense. These concerns are discussed below.
Ramik
®Bait Efficacy and Dynamics Concerns
The only rodenticide that is registered in Hawaii for conservation use is Ramik®, a restricted use pesticide in Hawaii that requires a Certified Pesticide Applicator permit to use. The active ingredient of Ramik® is diphacinone, an anticoagulant. Research has shown that a black rat, the most common species in some of Oahu’s mesic forests (Shiels 2010), must feed on the bait for approximately seven consecutive days to reach a lethal dose. However, the poisoned rat may persist for up to seven more days before succumbing to the poison (Swift, pers. comm.). Because of this information, there is concern that rat baiting with Ramik® around rare resources may cause rats to actually frequent the area more due to the bait being a perceived food source. This may actually increase the risk of predation on the rare resources because rats are known to diversify their diets and may consume both the bait and the resources that are being
managed.
The lethal dose for a rat varies widely for individual rats depending on factors such as age, size, sex, and species. It has been documented that some black rats can consume as little as 15.5 grams (half a bait block) and die in three days while others can survive for ten or more days while consuming 90 grams (over 3 bait blocks) a day. Furthermore, some rats may consume much more than the lethal dose of the bait before they stop feeding while others may sample the bait a few times and then either get scared away by a more dominant rat or simply find an alternate food elsewhere and not return (Swift, pers. comm.). Clearly, it is difficult to determine how many rats can be killed from 16 bait blocks in a bait station; therefore, it is more difficult to determine how effective baiting grids are at controlling rat populations than with rat traps where the number of rats killed is known.
Additionally, many areas where rat bait stations have been deployed by OANRP in the past are relatively small and are concentrated right around the rare resources. There is concern that such small baiting grids are insufficient to control rat populations to the level necessary to adequately protect the resource. With up to nine black rats per hectare in Oahu’s mesic forests (Shiels 2010), there will always be rats eager to move into an area that was previously occupied by another rat.
Ramik
®Bait Palatability/Longevity Concerns
The Ramik® pesticide label states that there must be a fresh supply of bait available at all times when using the bait for rat control. OANRP’s baiting grids have typically been maintained at 2-6 week intervals. However, in wet habitats the bait has been observed to be moldy after only one week (see Figure 1). It is likely that rats would not be strongly attracted to the bait toward the end of the baiting interval or even sooner depending on the amount of mold. Not only is this not effective rat control, there is concern about compliance with the Ramik® label specification.
Figure 1. Ramik® bait with mold growth seven days after bait stations were restocked. Photos taken on 5 April 2012, at Northern LZ, Koloa MU, Ko’olau Mountains.
Expense Concerns
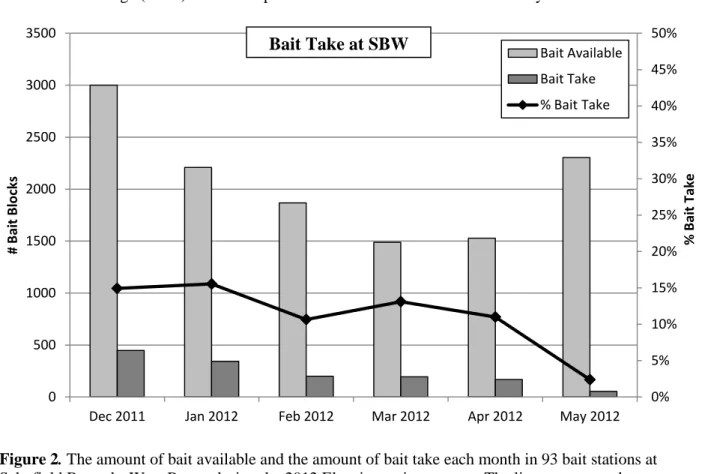
The data from the 2012 Elepaio season indicate that the majority of Ramik® applied is not eaten by rats and is disposed of according to label specifications. See Figure 2, below, for data from 2012 at Schofield Barrack West Range (SBW) as an example of the amount of bait that is essentially wasted.
Figure 2. The amount of bait available and the amount of bait take each month in 93 bait stations at
0% 5% 10% 15% 20% 25% 30% 35% 40% 45% 50% 0 500 1000 1500 2000 2500 3000 3500
Dec 2011 Jan 2012 Feb 2012 Mar 2012 Apr 2012 May 2012
% B ai t Take # B ai t B lo cks Bait Available Bait Take % Bait Take
Bait Take at SBW
The bait take is fairly low in the beginning of the season and remains low. Note the difference between bait available and bait take. Over the season there were approximately 11,000 bait blocks wasted at SBW, equivilant to over $1,900 worth of bait. At the end of the season there is a noticeable decline in bait take; this may be related to seasonal fluctuations in rat populations as often rat catches in traps are low in the spring/summer.
It is noteworthy to mention that a portion of the bait that is reported as “bait take” may actually be lost to slugs, insects, and mold. There is no way to determine what percentage of bait is lost to these non-rodent factors but it is suspected to be significant. Field crews working in various MUs have continually reported this concern along with an overall concern with the efficacy of baits.
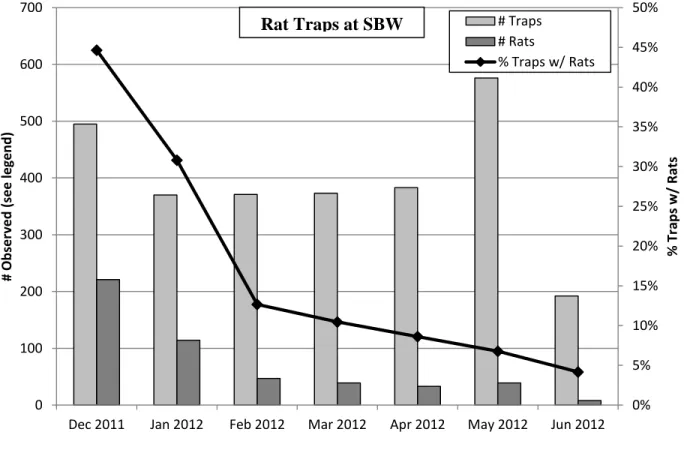
In contrast to bait take, data from rat trap kills over the same time period at SBW show a more dramatic decline (Figure 3).
Figure 3. The total number of rat traps checked and total number of rats killed in traps each month at Schofield Barracks West Range during the 2012 Elepaio nesting season. There were 192 traps total at SBW. The amount of traps observed each month varies according to how many times the sites were visited. The line represents the percentage of traps checked each month with rat kills.
As expected when rat control is first implemented, in the beginning of the nesting season a high percentage of traps caught rats but as rats were removed from the area, fewer and fewer of the traps caught rats. This indicates an initial “knockdown” in rat numbers at the beginning of the trapping. Declining rat numbers in traps could also be related to seasonal fluctuations in rat populations; rat catches in other trapping grids are often low in the spring/summer months.
0% 5% 10% 15% 20% 25% 30% 35% 40% 45% 50% 0 100 200 300 400 500 600 700
Dec 2011 Jan 2012 Feb 2012 Mar 2012 Apr 2012 May 2012 Jun 2012
% Tr ap s w/ R ats # Ob ser ve d ( see leg e n d ) # Traps # Rats % Traps w/ Rats
Rat Traps at SBW
These trends in bait take out of bait available and in trapping data were observed at all Elepaio areas in 2012 (see Elepaio Chapter 4 for more details).
Changes to Rodent Control Strategies in 2012
After consultation with partner agencies and discussing the aforementioned concerns, OANRP has removed 76% of existing bait stations across many MUs over the last year. These changes are in compliance with the Army’s initiative to reduce pesticide use by 55% since 1993. See Table 2 below for details.
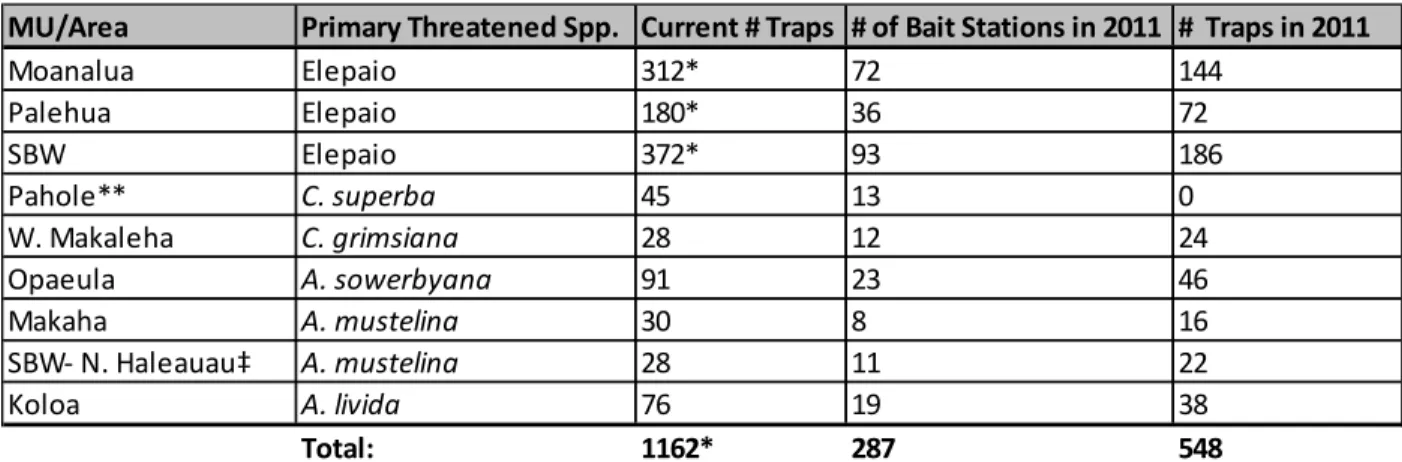
Table 2.Rat control sites that have switched from small bait station grids and rat traps to rat trap only grids. Rat control for next year’s Elepaio nesting season has not yet commenced so exact numbers of traps installed are not yet available. Also note that in Pahole the trapping grid consists of automatic traps (see section 6.4).
* Estimated # of traps. Each managed Elepaio territory will have 12 traps installed ~12 m apart in trees.
** Grid consists of new automatic self-resetting traps and are being tested at Pahole
‡ N. Haleauau snail sites are included during Elepaio nesting season
Bait station grids that were small (fewer than 10 stations) and in very wet habitats have all been switched to snap trap only grids. For every bait station that was removed from an area, 1-2 snap traps were installed. These traps are in addition to the traps that previously existed. Additionally, all Elepaio territories that were previously managed with small baiting grids will be transitioned to snap trap only grids for the upcoming 2013 Elepaio nesting season. Each territory will have a small grid of 12 traps spaced around the core area used for nesting. Most territories are adjacent to one another therefore the small grids may create continuous grids in some areas. Note that the re-visitation interval for all grids has not changed; labor costs will be the same or less for all areas that have recently transitioned to traps only.
OANRP is confident that snap trap only grids can be effective at protecting resources. MUs with large scale trapping grids to control rats have shown positive ecosystem responses. These include: increased native invertebrate abundances, reduced fruit predation on Cyanea superba subsp. superba, and increased native seed rain (Diospyros hillebrandii) and common native seedlings (see OANRP 2010, 2011 for details). These results indicate that using rat traps without deploying rodenticide can be effective at managing rat populations. Furthermore, after installation of the trapping grid at Ekahanui in 2010, the Elepaio nesting season was the most successful nesting season ever recorded which indicates that
MU/Area Primary Threatened Spp. Current # Traps # of Bait Stations in 2011 # Traps in 2011
Moanalua Elepaio 312* 72 144 Palehua Elepaio 180* 36 72 SBW Elepaio 372* 93 186 Pahole** C. superba 45 13 0 W. Makaleha C. grimsiana 28 12 24 Opaeula A. sowerbyana 91 23 46 Makaha A. mustelina 30 8 16 SBW- N. Haleauau‡ A. mustelina 28 11 22 Koloa A. livida 76 19 38 Total: 1162* 287 548
bait stations when maintained at the same interval, allow for detection of rat kills, and kill the rat immediately so that it cannot continue to damage resources.
In summary, at $56per 5 gallon bucket (or 320 bait blocks), program wide use of Ramik® can be very costly and may not be the most effective tool for rat control, especially in wet habitats or when only a few bait stations are deployed. With the development of a more persistent bait than peanut butter alone (see section 6.3), snap trap grids are a promising management tool. OANRP is optimistic about the changes made to the rat control program in 2012 and expects that rat control in 2013 will prove to be more effective and cheaper.
6.3
BAIT PERSISTENCE TRIALS FOR RAT TRAPS
One of the main obstacles with snap traps is bait persistence in the field; slugs/ants remove bait often within 24 hours. Finding bait that persists in the field and is attractive to rats for a longer duration is crucial, especially with the increased reliance of OANRP on trapping grids alone for rat control. Many types of potential baits have been trialed including: peanut butter, Nutella®, liquid scents on sponges, dog treats, tootsie rolls, nuts, homemade scented wax concoctions, peanut butter inside plastic tubing, peanut butter wrapped in metal mesh, coconut, chocolate chips, various scented commercial waxes, commercial baits for squirrels, and more. OANRP has had very little success in deterring slugs with zinc tape, salt or by elevating traps. Ants are also very problematic. Bait trials for some substances were discontinued for reasons such as lack of persistence in the field, attractiveness to rats, and difficulty of use. Several trials are ongoing; finding better bait is a never-ending endeavor.
Other types of lures for rats currently being investigated in New Zealand include audio tones, visual cues, and various scents including rat odors and pheromones. The development of such tools is in the
preliminary stages; nevertheless it is promising that such alternative and high-tech attractants are being investigated.
Recently, NRS purchased a wax product from a New Zealand company (Pest Control Research
www.pestcontrolresearch.co.nz) that is scented with real peanut butter and has been molded to fit Victor® snap traps perfectly (Figure 4). Thus far, this peanut butter wax bait seems to be very promising and may greatly improve trapping efficacy.
Figure 4. Peanut butter scented wax bait for Victor® rat traps.
Preliminary experimentation with the peanut butter wax in the Kahanahaiki trapping grid indicate that approximately 50-60% of traps had wax present after two weeks. After four weeks, 25-30% of traps still
had wax present. In contrast, when peanut butter is used on traps in large-scale trapping grids, NRS often find that 80-100% of traps have no peanut butter after two weeks. These results suggest that the peanut butter wax may last significantly longer on traps than peanut butter. In a trial at Kahanahaiki where NRS alternated using peanut butter and peanut butter wax on every other trap, 39% of rat catches were from traps baited with peanut butter wax (16 out of 41) and the rest were from traps baited with peanut butter. It could be that rats are not as attracted to the peanut butter wax as they are to regular peanut butter. Nevertheless, since 39% of the total kills in that period were from traps baited with the wax alone, it indicates that the wax is indeed somewhat attractive to rats. In addition, the fact the wax persists in the field much longer than peanut butter, it is the most promising alternative trap bait discovered so far. Future trials will strengthen this assertion.
Over the next year, OANRP will begin using this wax more extensively at various sites, specifically in the trapping grids and in areas with Elepaio. To maximize bait attractiveness to rats and longevity, OANRP will use the wax as supplemental bait; all traps will be baited with the wax and also a fresh dab of peanut butter or another bait, such as Nutella®. This way, the traps will be highly attractive to rats while the first bait (i.e. peanut butter) is present and will remain baited with the wax after the peanut butter has been removed. Potentially, this baiting system could greatly reduce labor costs since the majority of traps will remain baited for longer periods and re-baiting intervals could be stretched at some sites. It is not clear what the long-term cost of using peanut butter wax in trapping grids will be as the amount used over time is yet to be determined; however, the first shipment of wax from New Zealand cost about $30 per pound including shipping. Even with the relative expense of the wax, this baiting system could also greatly increase the efficacy of rat control efforts and increase benefits to natural resources.
6.4
AUTOMATIC SELF-RESETTING RAT TRAP TRIAL
OANRP recently acquired over 50 automatically resetting rat traps that can reset up to 24 times. These traps are a new tool created by Goodnature® (www.goodnature.co.nz) in New Zealand to humanely kill rats of any species or age class. Each trap can kill up to 24 rats using a single CO2 cartridge and are
designed to be baited with a long-lasting attractant (see Figure 5). A trap costs $149.50 NZD or about $123 USD.
Figure 5. Goodnature® A24 Automatic Rat Trap with CO2 cartridge. Photo courtesy of
www.goodnature.co.nz.
There are possible advantages of using this new tool. Primarily, long-term rat control costs could be significantly reduced with the use of automatic traps because they don’t need to be serviced as often as traditional traps thereby reducing staff time spent re-baiting, fewer traps may be necessary for the same level of rat control, and helicopter time would be reduced due to less frequent servicing of traps in remote areas. Even with the high cost per trap, the automatic traps could save a significant amount of money in long-term labor costs.
For example, in Kahanahaiki, typically four staff reset 464 snap traps twice a month and typically fewer than 60 rats are killed each month. Since 2009, the average labor cost for installing and maintaining the grid each year has been over $40,000. If automatic traps were used in a grid layout of 100 meters by 50 meters (as suggested by D. Peters, pers. comm.), there would be 54 traps. At the highest catch rate generally seen of 60 rats per month, it would be 21 months before all traps would need new CO2
cartridges. In reality, the traps could probably be checked 2-4 times a year by fewer staff to refresh the
bait and replace CO2. This roughly equates to less than 20% of the labor currently required for grid maintenance. Finding bait that lasts as long as possible is crucial to maximize the utility of the traps. In collaboration with Kalaupapa National Park and the State of Hawaii, OANRP has commenced a trial in Pahole Natural Area Reserve to investigate the use and efficacy of the automatic traps in Hawaii. Forty five traps have been deployed in a 200 meter circular buffer around the outplanted population of Cyanea superba in Pahole (Figure 6).Figure 6. Map of the automatic trap grid layout at Pahole NAR that is centered around the C. superba
population (indicated by stars). The trap lines are labeled A, B, C, D, E with eight additional traps around the perimeter. Each black symbol represents one trap. The circle represents a 200 meter buffer around the C. superba plants; the squares are an example of the home-range size of a black rat (~4 ha, Shiels 2010).
The grid was laid out in accordance with the New Zealand Department of Conservation’s
recommendation for trap placement. Trap lines are spaced 100 meters apart with traps installed 50 meters apart on the trap lines. Eight additional traps are deployed on the perimeter between trap lines for a total of 45 traps.
This project is the first attempt at systematically collecting data on the application, effectiveness, and cost of using these traps for natural resource management in remote Hawaiian forest settings. The overall goal of this study is to begin the process of collecting data on the utility of these traps to become more
knowledgeable regarding how they function and whether or not they reduce rat activity enough to protect natural resources. OANRP hopes to learn about the functionality of these traps so that future decisions regarding the use of these traps will be more informed.
This project will be conducted in two phases: Phase 1 will include preliminary data collection on a subset of traps. Cameras will record animal (rat, cat, mongoose) activity at the traps and the number of kills will
activity. C. superba have been shown to be heavily predated upon by rats (Pender et al. 2012) and these plants will provide a reference for how the automatic traps affect rat predation on natural resources. Preliminary data from this project indicate that the traps are very effective at attracting and killing rats. Three days after installation on 26 October 2012, 12 traps had killed 19 rats. By 31 October 2012, 14 more rat carcasses were found beneath 12 traps; several traps had three carcasses below them. The traps already appear to be a very promising management tool.
For more details, please see Appendix 6-1 for a full project overview.
References
OANRP (Oahu Army Natural Resources Program) (2010) Status Report for the Makua and Oahu Implementation Plans. Oahu Army Natural Resource Program, U.S. Army Garrison, Hawaii and Pacific Cooperative Studies Unit, Schofield Barracks, Oahu, HI.
OANRP (Oahu Army Natural Resources Program) (2011) Status Report for the Makua and Oahu Implementation Plans. Oahu Army Natural Resource Program, U.S. Army Garrison, Hawaii and Pacific Cooperative Studies Unit, Schofield Barracks, Oahu, HI.
Pender, RJ, Shiels AB, Bialic-Murphy L, Mosher SM (2012) Large-scale rodent control reduces pre- and post-dispersal seed predation of the endangered Hawaiian lobeliad, Cyanea superba subsp. superba
(Campanulaceae). Biol Invasions, Pub. Online: 25 July 2012
Peters, D (2012) Personal Communication. National Predator Control, Research, Development and Improvement, Department of Conservation, New Zealand
Shiels AB (2010) Ecology and impacts of introduced rodents (Rattus spp. and Mus musculus) in the Hawaiian Islands. Dissertation, Department of Botany, University of Hawaii at Manoa
Swift, K (2012) Personal Communication. Predator Control/Toxicant Registration Specialist, US Fish and Wildlife Service.