DOCUMENT
DE TRAVAIL
N° 242
STRESS TESTING FRENCH BANKS' INCOME
SUBCOMPONENTS
Jérome Coffinet, Surong Lin and Clément Martin
DIRECTION GÉNÉRALE DES ÉTUDES ET DES RELATIONS INTERNATIONALES
STRESS TESTING FRENCH BANKS' INCOME
SUBCOMPONENTS
Jérome Coffinet, Surong Lin and Clément Martin
August 2009
Les Documents de Travail reflètent les idées personnelles de leurs auteurs et n'expriment pas nécessairement la position de la Banque de France. Ce document est disponible sur le site internet de la Banque de France « www.banque-france.fr ».
Working Papers reflect the opinions of the authors and do not necessarily express the views of the Banque de France. This document is available on the Banque de France Website “www.banque-france.fr”.
Stress testing French banks' income subcomponents
* J. Coffinet†, S. Lin‡ and C. Martin§
*
Many thanks to Jézabel Couppey-Soubeyran, Enisse Kharroubi, Guy Lévy-Rueff, Adrian Pop, Muriel Tiesset and participants to an internal seminar for their valuable advices on a former version of that project. We also would like to thank our colleagues from the DG Economics who provided us with the various scenarios founding the macroeconomic stress tests. All errors remain ours. The opinions expressed are not necessarily those of the Banque de France.
†
Banque de France, 115 rue Réaumur 75002 PARIS. Email: [email protected]. Tel: +33 1 42 92 60 18.
‡
Banque de France, 115 rue Réaumur 75002 PARIS. Email: [email protected]. Tel: +33 1 42 92 60
Abstract
Using a broad dataset of individual consolidated data of French banks over the period 1993-2007, we seek to evaluate the sensitivity to adverse macroeconomic scenarios of the three main sources of banking income, namely interest margins, fees and commissions, and trading income. First, we show that the determinants of banking income subcomponents are highly specific: whereas interest rates spread plays a significant role in determining net interest income, stock market measures are significant determinants of trading income. GDP growth impacts significantly on fees and commissions. Second, our macroeconomic stress testing exercises tend to show that fees and commission and to a lesser extent trading incomes are much more sensitive to some adverse macroeconomic shocks than interest income. This could support the view that income diversification is associated with higher banking revenue resilience.
JEL classification: C23; G21; L2.
Keywords: banking income, interest margins, fees and commissions, trading income,
Résumé
A partir de données individuelles consolidées portant sur les banques françaises au cours de la période 1993-2007, nous évaluons la sensibilité des trois principales sources de revenus bancaires – revenus d’intérêt, revenus de commissions, revenus de transaction – à divers scénarios macroéconomiques adverses. Premièrement, nous montrons que les déterminants des revenus bancaires sont fortement spécifiques : alors que l’écart de taux joue un rôle important sur les revenus d’intérêt, l’évolution des marchés boursiers est un déterminant significatif des revenus de transaction. Le taux de croissance du PIB a un impact significatif sur les revenus de commissions. Deuxièmement, nos exercices de stress tests macroéconomiques montrent que les revenus de commissions et dans une moindre mesure de transaction sont plus sensibles à certains chocs macroéconomiques adverses que les revenus d’intérêt. Ces résultats sont en accord avec l’idée selon laquelle la diversification est associée à une plus forte résilience des revenus bancaires face à des situations de stress.
Codes JEL: C23; G21; L2.
Mots-clés: revenus bancaires, marges d’intérêt, commissions, revenues de transaction,
Non technical summary
Over the recent decade, financial innovation and liberalisation triggered important changes as regards the sources of banking income: initially based on income revenues, banking income came increasingly from fees and commissions, as well as trading revenues. As a consequence, identifying the factors that drive banks’ income subcomponents is important to obtain a good understanding of the main sources of risk for the banking sector.
A useful tool for assessing the resilience of banking income subcomponents to macroeconomic and financial shocks relies on stress test methodologies. Stress test exercises prove to be of particular interest, as they make possible to study the effects of various macroeconomic scenarios on banking income subcomponents.
The present paper identifies the determinants of the three main subcomponents of banking income i.e. net interest margins, fees and commissions and trading income, for a large dataset of French banks on a consolidated basis over the period 1993-2007. We also assess French banks’ income structure resilience to macroeconomic and financial shocks using stress tests.
Our results are as follows. First, we show that the determinants of banking income subcomponents are highly specific: whereas interest rates spread plays a significant role in determining net interest income, stock market measures are significant determinants of trading income. GDP growth impacts significantly on fees and commissions. Second, our macroeconomic stress testing exercises tend to show that fees and commission and to a lesser extent trading incomes are much more sensitive to some adverse macroeconomic shocks than interest income.
As a consequence, our results support the view that income diversification is associated with higher banking revenue resilience to stress.
1. Introduction
Since the early nineties, technological innovation and financial liberalisation triggered important changes in the banking system, including increased competition and restructuring. These changes also overturned the traditional vision of the banking sector. A noticeable effect is the disintermediation process accompanied by an increase in the diversity of savings products and the emergence of non-bank financial actors. As the ECB (2000) points out, markets can now perform tasks which were previously reserved for banks. Owing to the inception of the euro and financial liberalisation, money and capital markets have become deeper and more liquid, explaining also why banks are more market-oriented than they were before. Banks have reacted to this changing environment by implementing proactive strategies to remain competitive in their traditional activities of lending but they have also engaged in new or partly new businesses, such as fees and commissions and trading activities, to diversify their income sources and expand both their balance sheets and their revenues.
Identifying the factors that drive banks’ income is important to obtain a good understanding of the sources of risk in the banking sector. Moreover, as the breakdown of the various subcomponents of banking income has changed over the recent years, modelling the links between the macroeconomic and market environment on the one hand and the income subcomponents on the other hand is particularly useful to test the resilience of the banking system. Indeed, banks whose revenues rely on specific income sources such as trading income, for instance, are much more likely to suffer from severe shocks stemming from the financial markets, compared to banks whose revenues come mainly from interest income.
This diversification of banking income is of particular interest for supervisory authorities. More specifically, studying the impact of various shocks on banking income subcomponents is likely to shed new light on the issue whether income diversification is a source of stability. A useful tool for assessing the resilience of banking income subcomponents to macroeconomic and financial shocks relies on stress test, which has received a great audience in the recent years. Stress test exercises prove to be of particular interest, as they make possible to study the effects of various macroeconomic scenarios on banking income subcomponents.
The present paper aims at identifying the determinants of the three main subcomponents of banking income i.e. net interest margins, fees and commissions and trading income, for a large dataset of French banks over the period 1993-2007. We also propose to assess French banks’ income structure resilience to macroeconomic and financial shocks using stress tests.
Our results are the following. First, we show that the determinants of banking income are highly specific: whereas interest rates spread plays a significant role in determining net interest income, stock market measures are significant determinants of trading income. GDP growth impacts significantly on fees and commissions. Second, our macroeconomic stress testing exercises tend to show that fees and commission and to a lesser extent trading incomes are much more sensitive to adverse macroeconomic shocks than interest income. This supports the view that income diversification is associated with higher banking revenue resilience to stress.
The study is structured as follows. Section 2 reviews the literature on recent banks’ income structure developments and their impact on profitability and banks' risk profile. Section 3 presents the data and the model estimated in the paper. In the section 4, we present the results of the estimations. Section 5 applies those results to stress tests exercises. Finally, section 6 concludes.
2. A literature review on banks' income sources
The increased diversification of banking income sources is a structural trend observed over several years. Moreover, regarding the process of disintermediation, the literature considers the income sources diversification as the substitution of interest income by non-interest income. This definition might be not precise enough as many market-oriented banks’ income sources are essentially based on non-interest components such as commissions and fees or revenues from trading activities, whose determinants might fundamentally differ.
In the same time, one challenging issue is to define the different income subcomponents where country- or even bank-specific factors (accounting standards) make comparisons quite difficult. This observation is particularly true for the distinction between interest and non-interest income. The disintermediation process makes the distinction quite elusive: for
instance, the interest rates play an important role in different income subcomponents (the intermediation margin in retail activities, trading profits on fixed income securities, etc.).
Finally, the main concern for banking supervisors behind the income source diversification is the definition of income subcomponents and their impact on financial stability and more precisely, how the changing income structure may affect banking risk profile.
Considering the effects of income diversification on banks' profitability, the results of existing literature are quite contradictory and largely depend on the period analyzed and dataset used. Davis and Tuori (2000) find no evidence of a positive relationship between activities generating non-interest income and profitability. They only observe a positive correlation between non- interest income and the cost-to-income ratio. De Vincenzo and Quagliariello (2005) show a positive correlation between non-interest income and the ratio of net operating income to total assets for Italian banks. Stiroh (2004) concludes that diversification benefits are likely to be small. Banks' strategic choices tend to offset these gains as risks increase with leverage, corporate lending and dependency on financial market evolutions. At this stage, a first conclusion to be drawn is that the assessment of a relationship between banks’ profitability and the increase in non-interest income is likely to be (i) subject to the definition of interest versus non-interest income and (ii) deeply interrelated with the risk assessment of the banking activity under consideration.
Both cost and risk effects are likely to be significant for banks' earning volatility and risk profile. On this issue, empirical results also diverge. Smith et al. (2003) confirm a negative correlation between interest income and non-interest income. They observe that profits are more stable through income diversification. By contrast Stiroh (2004) finds a positive correlation on US banks between 1984 and 2001. It is then difficult to conclude that non-interest income is more volatile than non-interest revenues. The ECB (2000) report notes differences among European countries and shows that some types of accounting standards - especially as regards provisioning – may exacerbate the interest income volatility. Alternatively, some studies bring to the fore the volatility of non-interest income components. ECB (2000) points out that profits from trading activities (financial operations in securities, foreign exchanges and derivatives) are the most volatile. By contrast, fees and commissions appear to be the most stable component of the non-interest income. This last observation is confirmed by several studies on US banks. For instance, Saunders and Walters (1994) and
Kwan and Laderman (1999) find that fees and commissions from non-bank activities (e.g. insurance) provided by banks stabilize the profitability with a significant decrease of the cost of risk, relatively to trading activities.
Most studies looking at the diversification effects on bank's risk profile, such as Stiroh (2004), conclude that a significant reliance on commissions and fees may increase bank's idiosyncratic risk. ECB (2000) and Smith et al. (2003) discuss this reliance within the context of operational, reputational or strategic risk. As ECB (2000) points out, the diversification of income sources (by product and by geographical area) has to go hand in hand with increased and more complex internal controls. More recently, Lepetit et al. (2006) find that banks with higher commission- and fee-based activities may have a higher risk profile by underpricing their loans. Banks generally adopt this type of strategy to capture their clients and then sell them complementary non-interest based products, such as life insurance.
More generally, bank supervisors are concerned about the potential effect of the diversification of income sources on the stability of the banking and financial system. The literature on this related topic is quite recent and most of the research papers deal with systemic risk. The results are somewhat counter-intuitive as several studies conclude that income diversification tends to raise systemic risk. Baele et al. (2007) and Stiroh (2004) measure banks' market beta5 for European and US banks respectively and find that businesses generating non-interest income are more sensitive to market movements or economic shocks. Using the tail-beta6 as a systemic measure, ECB (2007) reveals that size and non-interest activities contribute to increase banks’ risk profile, whereas the level of capital and the interest income reduce it.
Papers investigating the specific drivers of income subcomponents are relatively scarce. Following Pain (2003) for the major UK banks, Lehmann and Manz (2006) and Rouabah (2006) deal with this issue respectively for Swiss banks and for credit institutions headquartered in Luxembourg. They find statistically significant relationships between various macroeconomic variables on the one hand and interest and non-interest earnings on the other hand. Their find some common features as regards trading income, which are likely to increase with stock market return and decrease with short-term interest rates. Surprisingly,
5
Beta is a measure of the systematic risk of an asset. It is the key parameter of the CAPM (Capital Asset Pricing Model), which measures the sensitivity of the return of a specific asset to the return of the market.
6
Swiss banks’ trading income is likely to decrease with the volatility of the stock market. As regards income stemming from commissions and fees, it may increase with stock market return in both countries, but decrease with its volatility in Switzerland. Finally, as regards the net interest income, these authors find a positive impact of the spread between long-term and short-term interest rate in Switzerland, and a negative effect of the short-term financing conditions in Luxemburg. These papers are also original in that they evaluate the impact of external shocks on banks' income. They conclude that the shocks on profits are relatively modest in terms of excess capital. In this regard, a profitable and well capitalized banking sector is quite resilient and able to absorb losses from global market shocks without jeopardising the financial system.
Assessing the impact of the macroeconomic environment on the banking system has become an increasingly important issue on the research agenda, in particular within central banks. Macroeconomic stress tests have also been included in the International Monetary Fund’s Financial Sector Assessment Program (FSAP). Surveys on financial stress testing are provided by Sorge (2004) and Jones, Hilbers and Slack (2004). Stress tests can be divided into two major categories: in a bottom up approach, banks themselves carry out individual stress tests for given scenarios and report them to regulators or central banks for aggregation. By contrast, in a top down approach, the analysis is carried out at a centralized level and relies on data available to regulators or central banks. One approach, adopted by Virolainen (2004), is to postulate corporate defaults as a function of macroeconomic influencing factors, modelled as a probit or logit process. Alternatively, Drehmann (2005) uses equity data and a Merton model to derive default probabilities of firms. Based on predicted corporate sector default rates, this approach typically proceeds to assess the impact of selected scenarios on bank credit portfolios. Unfortunately, it is not straightforward to link corporate sector default rates to individual bank credit portfolios, in particular if detailed data on individual bank credit portfolios are missing. Therefore, a second approach, which we follow in this paper, is to estimate directly the impact of macroeconomic events on banks. A number of studies explore loan loss provisions, non-performing loans or profitability measures as a function of macroeconomic variables. Examples in an aggregate time series context include Hoggarth, Sorensen and Zicchino (2005), Kalirai and Scheicher (2002) and Delgado and Saurina (2004). There exist also a few panel studies for individual countries as e.g. Salas and Saurina (2002), Pesola (2001) and Pain (2003). In a related paper, Elsinger, Lehar and Summer (2002) explore the role of mutual credit exposures in the Austrian banking system, which may
reinforce the impact of an initial shock. The authors conclude that interbank linkages play a minor role. The approach taken in the present paper is most closely related to the panel study of Pain (2003), though we use a much larger data set which includes large international banks, but also many regional, private and other banks. A key advantage of using individual bank data is the possibility to control for individual bank characteristics affecting profitability.
Our paper follows the same approach as that of Lehmann and Manz (2006) and Rouabah (2006), focusing rather on the subcomponents of French banks’ income. Our goal is thus to assess the relative importance of the different shocks on each component. Furthermore, in addition to those papers, we run some comprehensive stress test exercises based on a macroeconometric model, rather than a crude sensitivity analysis.
3. Data and methodology
3.1 Description of the data
3.1.1 The endogenous variables: the banking income subcomponents
Our dataset7 consists of consolidated accounting data extracted from the year-end banking statistics collected by the General Secretariat of the Banking Commission. Our sample spans the period from 1993 to 2007. Moreover, our database encompasses the whole French banking sector. Other available dataset (that are not based on supervisory data) suffer from a narrow time-window as concerns fees and commissions and trading income and few observations in the cross-section dimension (only 30 banks in 2007 in Bankscope, for instance). By contrast, our consolidated database includes more than 200 individuals (banks). It should be noted as well that income from insurance activities are not captured in this study.
The three main components of total banking income (the net banking income) are interest income, fees and commissions and trading income. In the period 1993-2007, these components account for about 90% of total income, 45%, 25% and 20% respectively. The figure 1 below shows the development in those various income subcomponents as a share of total banking income. It is easily remarkable that net interest income is on a downwards trend,
7
The database from which we collect the data is usually known as the ‘Bafi’ database. French banks' income components are based either on unconsolidated data or on consolidated data. In the present study, we make use of consolidated data.
as commissions and fees income and trading income tend to increase but with a high volatility. However, it could be argued that the increase in net interest income in 2005 was due to the implementation of IFRS, which may have given incentive to add accrued interests from hedging derivatives to interest income.
Figure 1: breakdown of French banks’ income (1993-2007)
0% 20% 40% 60% 80% 100% 1993 1994 1995 1996 1997 1998 1999 2000 2001 2002 2003 2004 2005 2006 2007
Net interest income Commissions and fees trading income Other non-interest income
Our endogenous variables are the ratios of banking income components to the total banking assets. The following figure 2 shows the evolution of those variables on an aggregated basis. Once again, the general trend is that the interest income decreases from 1993 to 2000, at least, and then fluctuates. Other incomes tend to increase but they appear rather volatile.
Figure 2: developments in income subcomponents
0,0% 0,2% 0,4% 0,6% 0,8% 1,0% 1,2% 1,4% 1,6% 1,8% 199 3 199 4 199 5 199 6 199 7 199 8 199 9 200 0 200 1 200 2 200 3 200 4 200 5 200 6 200 7
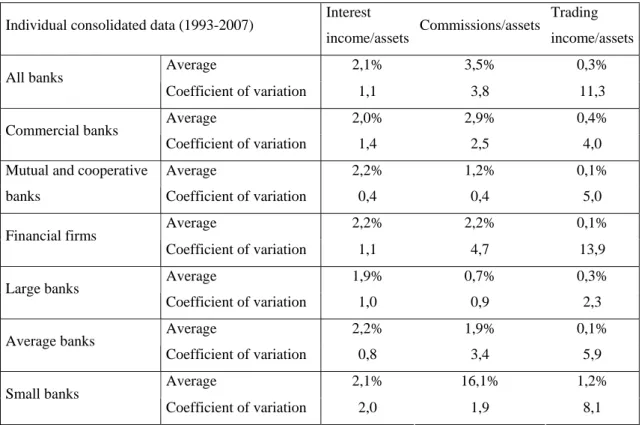
The following table 1 displays descriptive statistics about endogenous variables: their mean and their coefficient of variation. Firstly, banks are classified according to their juridical form: we distinguish commercial banks, mutual and cooperative banks, and financial firms. Secondly, we differentiate banks according their balance-sheet’s size: banks that are in the 75%-100% percentile region of the largest balance-sheet are classified as large banks, and banks in the bottom 25% percentile region are classified as small banks. One finding is that the most volatile income component seems to come from trading activities: the coefficient of variation of trading income of each bank is significantly higher than that of the other components. It is also observed that mutual and cooperative banks have the most stable income as they have the smallest coefficients of variation among all bank categories.
Table 1: descriptive statistics of endogenous data Individual consolidated data (1993-2007) Interest
income/assets Commissions/assets Trading income/assets Average 2,1% 3,5% 0,3% All banks Coefficient of variation 1,1 3,8 11,3 Average 2,0% 2,9% 0,4% Commercial banks Coefficient of variation 1,4 2,5 4,0 Average 2,2% 1,2% 0,1%
Mutual and cooperative
banks Coefficient of variation 0,4 0,4 5,0
Average 2,2% 2,2% 0,1% Financial firms Coefficient of variation 1,1 4,7 13,9 Average 1,9% 0,7% 0,3% Large banks Coefficient of variation 1,0 0,9 2,3 Average 2,2% 1,9% 0,1% Average banks Coefficient of variation 0,8 3,4 5,9 Average 2,1% 16,1% 1,2% Small banks Coefficient of variation 2,0 1,9 8,1
3.1.2 Explanatory variables: macroeconomic and financial variables
We use the following common explanatory variables for the three subcomponents of banking revenue:
- GDP growth is defined as the year-on-year change in the real GDP in volume extracted from the OECD database. This variable is able to capture the relationship between bank revenues and the business cycle (Athanasoglou et al., 2008). Banking
income might be procyclical: during economic booms, demand for credit and stock market transactions could be strengthened substantially. Nevertheless, it is rather difficult to guess which of the three components is likely to be the most influenced by the business cycle;
- Spread is the difference between 10-year Treasury bonds’ interest rate and 3- month Euribor rate. The short-term interest rate is the average 3-month Euribor rate over one year stemming from the IMF database. A rise in short-term interest rate is expected to reduce the net interest margin, since such an increase, which makes the short-term issuance short-term liabilities more expensive, is typically accompanied by a less than proportional increase in long-term interest rate. The long-term rate is the yield on 10-year Treasury bonds (Obligation Assimilables du Trésor 10 ans). Let us recall that the traditional interest-differential business of banks rely on their ability to earn higher interest rates on their assets than they have to pay on their liabilities, and might depend on the evolution of interest rates. In that respect, given that banks issue short-term liabilities to finance long term loans, we expect that the long-term interest rate has a positive impact on net interest income. Similarly to short-term interest rate, it is rather difficult to anticipate the effect of the long-term interest rate on non-interest income. Overall, we expect a positive impact of the interest rate spread on banking income subcomponents, especially the net interest income;
- SBF250 is the stock market average return stemming from an internal Banque de France’s database. The impact of the evolution of stock market prices on trading income seems rather obvious, in contrast with the other subcomponents for which no intuition can be put in evidence.
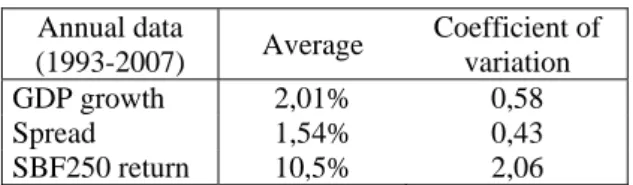
The table 2 below summaries the average values and coefficient of variation for these variables in the period of 1993-2007.
Table 2: descriptive statistics on macroeconomic and financial variables Annual data (1993-2007) Average Coefficient of variation GDP growth 2,01% 0,58 Spread 1,54% 0,43 SBF250 return 10,5% 2,06
3.1.3 The control variables: banking variables
The individual characteristics of banks (for e.g. banks’ capital, their degree of credit risk and etc.) have direct influence on the results. Consequently, we have to take into account some additional variables as controls:
- Expenditure is the ratio of expenditure to total assets. It is expected to be negatively related to profitability, since improved management of these expenses increases their efficiency and therefore raise profits. But the effect on the various subcomponents is not that intuitive;
- Capital is defined as the ratio of equity to total assets. As this variable denotes more opportunities for banks, its impact is likely to be positive;
- Risk is defined as the ratio of loan loss provisions to total loans. Theory suggests that increased exposure to risk is associated with lower revenues. Banks could, nevertheless, improve revenues by screening and monitoring credit risk, improving the forecasts of future levels of risk. The sign of the impact on revenues is thus ambiguous;
- Market share is a variable capturing the share of each bank in each of the three markets (net interest income, fees and commissions, trading income), defined as the share of individual bank’s credit to aggregated banking system’s credit for income revenue and fees and commissions, and as the share of individual bank’s trading portfolio to aggregated banking system’s trading portfolio for trading activities. As market share increases the market power of a specific bank, the impact of this variable is expected to be positive.
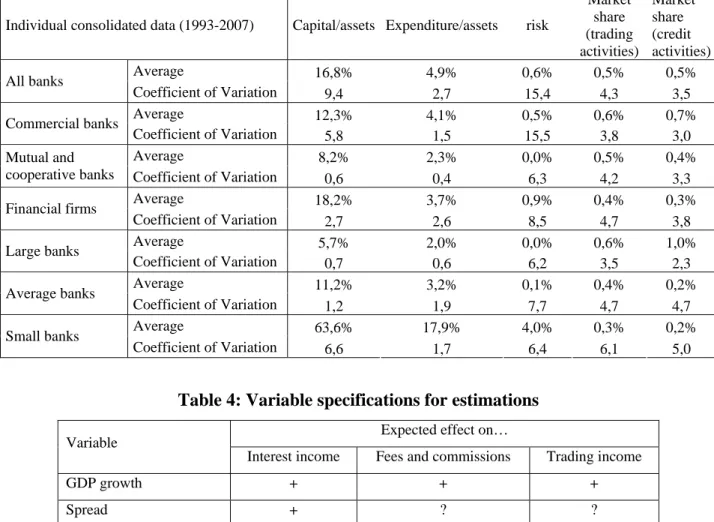
The table 3 provides some descriptive statistics for the banking variables and table 4 recapitulates the expected effects of explanatory variables on the various income subcomponents.
Table 3: descriptive statistics of banking variables
Individual consolidated data (1993-2007) Capital/assets Expenditure/assets risk
Market share (trading activities) Market share (credit activities) Average 16,8% 4,9% 0,6% 0,5% 0,5% All banks Coefficient of Variation 9,4 2,7 15,4 4,3 3,5 Average 12,3% 4,1% 0,5% 0,6% 0,7% Commercial banks Coefficient of Variation 5,8 1,5 15,5 3,8 3,0 Average 8,2% 2,3% 0,0% 0,5% 0,4% Mutual and
cooperative banks Coefficient of Variation 0,6 0,4 6,3 4,2 3,3
Average 18,2% 3,7% 0,9% 0,4% 0,3% Financial firms Coefficient of Variation 2,7 2,6 8,5 4,7 3,8 Average 5,7% 2,0% 0,0% 0,6% 1,0% Large banks Coefficient of Variation 0,7 0,6 6,2 3,5 2,3 Average 11,2% 3,2% 0,1% 0,4% 0,2% Average banks Coefficient of Variation 1,2 1,9 7,7 4,7 4,7 Average 63,6% 17,9% 4,0% 0,3% 0,2% Small banks Coefficient of Variation 6,6 1,7 6,4 6,1 5,0
Table 4: Variable specifications for estimations Expected effect on… Variable
Interest income Fees and commissions Trading income
GDP growth + + + Spread + ? ? SBF250 ? ? + Expenditure ? ? ? Capital + + + Risk ? ? ? Market share + + +
3.2 Methodology
We compute panel regressions on the set of macroeconomic and bank-specific variables. In particular, in the regression related to one income component, besides the first lagged dependent variable (πih ,t−1), we add the first lag of other income components (
h t i − −1 , π ) as
exogenous variables in order to take into account the possible dependence among income components (e.g. portfolio reallocation). The equation to be estimated looks like:
h t i k t i k k h j t j j h h t i h h h t i h h t i , φ1π, 1 α π, 1 β X θ Z , ε , π = + − +
∑
+∑
+ − − − (1)h: h-th income component (interest income, commissions or trading income) i: bank i
t: at the time t
-h: income components besides the h-th component Xj: j-th macroeconomic variable
Zk: k-th bank-specific variable
We use the Arellano-Bond (Arellano and Bond, 1991) two step estimator for our dynamic panel-data model and robust option to report standard error, under STATA using command xtdpd. We use two types of instruments for our difference equation: lagged endogenous variables (πh,π−h) as GMM-type instruments and all exogenous variables (X and Z) as additional standard instruments. The difference equation used in our model is also:
h t i k t i k k h j t j j h h t i h h h t i h h t i , φ1 π , 1 α π , 1 β X θ Z , ε , π = Δ + Δ + Δ + Δ +Δ Δ −
∑
∑
− − − (2)We modify the above models by adding macroeconomic variables adjusted by indicators (XlIq). These indicators (Iq)are dummy variables on banks’ juridical form or banks’ size. The aim is to test the differentiated effects of banks’ juridical form or banks’ balance-sheet size in events of macroeconomic shocks.
h t i l q l t l h k t i k k h j t j j h h t i h h h t i h h t i , φ1π, 1 α π , 1 β X θ Z, δ X I ε, π = + − +
∑
+∑
+∑
+ − − − (2) lX : l-th significant macroeconomic variables in model 1 q
I : q-th dummy variable; for example,Ibmc=1 for mutual and cooperative banks, 0 otherwise.
4. Results
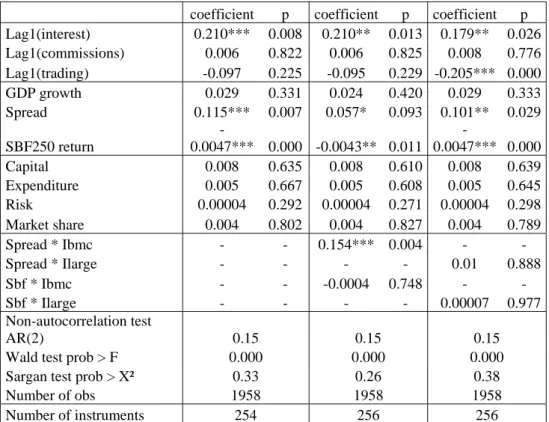
The table 5 below shows that the main macroeconomic and financial explanatory variables of net interest income are in line with what could be expected from the intuition.
First, the coefficient of the interest rate spread is significant and positive. This result shows that a higher refinancing source for banks is likely to weight on their interest income and that conversely, a higher long-term interest rate may positively affect the revenues of the banks. The traditional banking activity of transformation seems to play an important role as regards the income revenues. Looking at the dummy variables counting for differentiated effects concerning the type of banks, we find unsurprisingly that the spread as explanatory variable for interest income is all the more important than it is linked to cooperative and mutual institutions, which are supposed to rely more on traditional banking activity. Shocks on the yield curve have a particularly significant impact on those banks’ interest income, with an overall sensitivity coefficient of 0.211 (0.057+0.154) against 0.115 for all banks. On the other hand, shocks on financial market generally have similar impacts on all banks.
Second, the lagged endogenous variable proves to be positive and significant. This tends to attest the dynamic character of the specification. The coefficient of the lagged endogenous variable takes a value of approximately 0.21, which means that profits seem to persist to a moderate extent.
Table 5: results for the net interest income
coefficient p coefficient p coefficient p
Lag1(interest) 0.210*** 0.008 0.210** 0.013 0.179** 0.026 Lag1(commissions) 0.006 0.822 0.006 0.825 0.008 0.776 Lag1(trading) -0.097 0.225 -0.095 0.229 -0.205*** 0.000 GDP growth 0.029 0.331 0.024 0.420 0.029 0.333 Spread 0.115*** 0.007 0.057* 0.093 0.101** 0.029 SBF250 return -0.0047*** 0.000 -0.0043** 0.011 -0.0047*** 0.000 Capital 0.008 0.635 0.008 0.610 0.008 0.639 Expenditure 0.005 0.667 0.005 0.608 0.005 0.645 Risk 0.00004 0.292 0.00004 0.271 0.00004 0.298 Market share 0.004 0.802 0.004 0.827 0.004 0.789 Spread * Ibmc - - 0.154*** 0.004 - - Spread * Ilarge - - - - 0.01 0.888 Sbf * Ibmc - - -0.0004 0.748 - - Sbf * Ilarge - - - - 0.00007 0.977 Non-autocorrelation test AR(2) 0.15 0.15 0.15
Wald test prob > F 0.000 0.000 0.000
Sargan test prob > X² 0.33 0.26 0.38
Number of obs 1958 1958 1958
4.2 Parts of fees and commissions linked to market and cyclical evolution
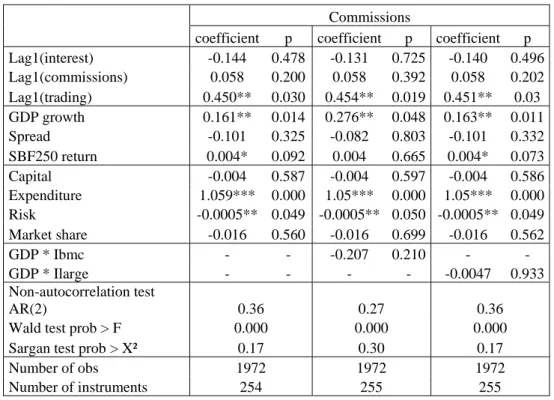
Our estimation results (table 6) suggest that cyclical variables are statistically significant. In particular, stock market returns as well as GDP growth have a positive impact on the dynamics of commissions and fees. A first explanation is related to the fact that fees and commissions are generated by activities that are linked with market or economic conditions. Those activities include underwriting, financial services, M&A or securities brokerage. A second reason is that banks have developed an expertise in extracting information from the stock market in order to generate profits. In that respect, the higher the SBF250 returns, the more numerous the arbitrage opportunities and thus the higher the revenue generated by these activities.
A large part of commissions and fees is mainly structural and depends on the functioning of the banking system (payment transactions, safe custody administration account etc.) and on banks’ competitiveness. Hence, regarding bank-specific variables, several variables prove to be significant. Contrary to interest income, banking commissions are directly influenced by banking structure, such as strategies on expenditure and credit risk: more specifically, the higher the risk, the smaller the revenue stemming from fees and commissions. On the other hand, the higher the expenditures, the higher the revenues coming from fees and commissions (recall that this variable was not significant for interest income): fees and commissions seem very much related to other products, and if it is often considered as a burden for the overall profitability, it proves to improve fees and commissions revenues.
Interestingly, the lagged trading income is significantly positive, showing that products linked to past profits on trading activities are likely to generate positive fees and commissions incomes.
Table 6: results for fees and commissions
Commissions
coefficient p coefficient p coefficient p
Lag1(interest) -0.144 0.478 -0.131 0.725 -0.140 0.496 Lag1(commissions) 0.058 0.200 0.058 0.392 0.058 0.202 Lag1(trading) 0.450** 0.030 0.454** 0.019 0.451** 0.03 GDP growth 0.161** 0.014 0.276** 0.048 0.163** 0.011 Spread -0.101 0.325 -0.082 0.803 -0.101 0.332 SBF250 return 0.004* 0.092 0.004 0.665 0.004* 0.073 Capital -0.004 0.587 -0.004 0.597 -0.004 0.586 Expenditure 1.059*** 0.000 1.05*** 0.000 1.05*** 0.000 Risk -0.0005** 0.049 -0.0005** 0.050 -0.0005** 0.049 Market share -0.016 0.560 -0.016 0.699 -0.016 0.562 GDP * Ibmc - - -0.207 0.210 - - GDP * Ilarge - - - - -0.0047 0.933 Non-autocorrelation test AR(2) 0.36 0.27 0.36
Wald test prob > F 0.000 0.000 0.000
Sargan test prob > X² 0.17 0.30 0.17
Number of obs 1972 1972 1972
Number of instruments 254 255 255
4.3 Trading income related to the financial market performance
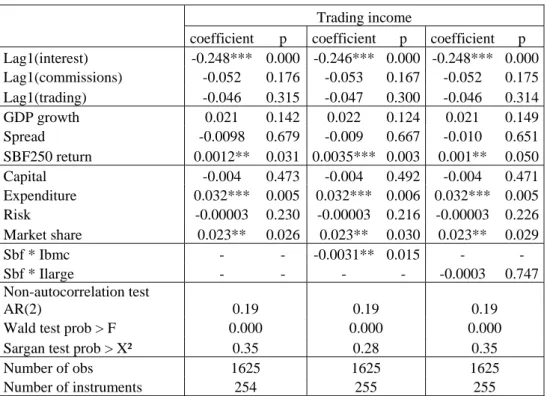
The lagged interest rate income exhibits a clear negative coefficient, indicating that past decreases in profits in traditional incomes are followed by increases in revenues stemming from trading activities. This sheds a new light on the portfolio reallocation behaviour by banks, showing that this behaviour cannot be ignored from a modelling point of view, and that not taking that effect into account would be likely to overestimate the effect of unfavourable conditions on the trading income.
As regards the macroeconomic and financial determinants, one may notice that trading income benefits from favourable market and economic conditions. Not surprisingly, the regression results imply that higher stock returns tend to increase trading income. GDP growth is close to significance, showing that better macroeconomic conditions would increase trading revenues. As a result, financial market shocks would strongly affect banks’ trading income. However, recession shock would have lesser impact on trading income in comparison to other incomes, as the coefficient of GDP growth is less high in the first equation (0.021) than in the others (respectively 0.161 and 0.047).
We also observe that banking expenditure and market shares have strong influence on banks’ trading income as their coefficient is both highly significant.
Table 7: results for trading income
Trading income
coefficient p coefficient p coefficient p
Lag1(interest) -0.248*** 0.000 -0.246*** 0.000 -0.248*** 0.000 Lag1(commissions) -0.052 0.176 -0.053 0.167 -0.052 0.175 Lag1(trading) -0.046 0.315 -0.047 0.300 -0.046 0.314 GDP growth 0.021 0.142 0.022 0.124 0.021 0.149 Spread -0.0098 0.679 -0.009 0.667 -0.010 0.651 SBF250 return 0.0012** 0.031 0.0035*** 0.003 0.001** 0.050 Capital -0.004 0.473 -0.004 0.492 -0.004 0.471 Expenditure 0.032*** 0.005 0.032*** 0.006 0.032*** 0.005 Risk -0.00003 0.230 -0.00003 0.216 -0.00003 0.226 Market share 0.023** 0.026 0.023** 0.030 0.023** 0.029 Sbf * Ibmc - - -0.0031** 0.015 - - Sbf * Ilarge - - - - -0.0003 0.747 Non-autocorrelation test AR(2) 0.19 0.19 0.19
Wald test prob > F 0.000 0.000 0.000
Sargan test prob > X² 0.35 0.28 0.35
Number of obs 1625 1625 1625
Number of instruments 254 255 255
5. Stress testing French banks’ income subcomponents
Stress-tests identify most important economic and financial channels of contagion of an initial shock that may affect the stability of the banking sector. Indeed, as the precedent section showed, market and economic environment may affect banks' profitability subcomponents. The aim of stress test exercises is to study the effects of some predetermined macroeconomic or financial scenarios on relevant banking variables, such as profitability as a whole or its subcomponents.
5.1 Stress-testing banks' income subcomponents
Several studies explore the impact of interest rate risk on banks’ profitability through interest margins. Brunn et al. (2005) explain the interest income thanks to GDP growth; Drehmann (2005) develops a balance-sheet approach to take into account the interest rate effects on the banks' economic value. De Bandt and Oung (2004) specify a reduced form interest rate model estimated on a panel dataset of French banks. The explanatory variables are the yield spread, its volatility, the loan growth and the cost of risk. Van den End et al. (2006) specify a similar
model for the net interest income growth of Dutch banks, where the net interest income growth is mainly explained by GDP growth and lending rates.
Papers focusing on non-interest income in the context of stress tests are relatively rare and recent in the literature. The approaches by Lehmann and Manz (2006) and Rouabah (2006), focusing on Swiss and Luxemburg respectively, conclude that the impact of macroeconomic and financial shocks on banks' profits is relatively modest, showing that the two banking sectors are resilient. They particularly focus on the banks’ earning structure (interest income, provisions, revenues from trading activities and commissions) and the risk that can potentially emerge from that structure facing macro or financial shocks.
Here it is very important to notice that our aim is not to only study the impact of one shock of one specific explanatory variable on the income subcomponents, regardless of the impact of such a shock on the other variables. On the contrary, the impact of stress scenarios on the relevant risk factors for the year 2009-2010 is consistently determined with the Banque de France's macroeconometric models (Mascotte and Nigem). This means that, conditionally on a specific scenario, we get some “stressed” output variables of the macroeconometric model (our “stressed” explanatory variables), which are then used as “stressed” inputs in our banking models for the three revenues subcomponents. Hence, we get some “stressed” revenues components, which are compared to the variables got without any stress (ie. in line with the basis line of the macroeconomic forecast).
More precisely, the interest rates are provided by the ECB: the short rate is 3 month forward rate and the long rate is obtained by pricing a 10 year government bond based on an estimated term structure of the interest rates8. A limitation to this approach relies in the feature of traditional macroeconometric model. Even though it provides an integrated and consistent framework to link the different effects of exogenous shocks on key macro variables such as GDP growth, loans or interest rates, the model is not clearly devoted to analyse financial relationships and how different agents in the system may be financially constrained. In other words, in such models, there is no limit to credit demand from households, which is in turn always satisfied. However, we try to estimate a relationship between CAC 40 stock return and volatility on the one hand and the Mascotte macroeconomic outputs on the other hand using a basic linear multi-factor model approach.
Another limitation is related to the fact that our model does not aim at taking into account of “second round” effects, as it only captures the effect of macroeconomic shocks on banking variables and not directly that of banking variables on macroeconomic and financial ones. In addition, our stress test exercises are carried out all other things being equal: in particular, we do not model any portfolio reallocation, leading to a shift from interest income to trading income, in case of, for instance, a negative shock on the spread, leading to a decrease of net interest revenues. For those reasons, it seems much more relevant to restrict our stress test exercise to the first year of shock, given that it is likely to avoid any unreliable result.
5.2 Model specification choice and stress-testing banks’ earning structure
We design and test five (severe but plausible) hypothetical stress scenarios:
- Internal demand shocks: - 1% GDP growth; - 2% GDP growth; - 3% GDP growth - Financial shocks: a 25% depreciation of the dollar against the euro; a flattening of the
yield curve (- 200 bp decrease of the Euribor 3M and – 400 bp OAT 10Y)
The Table 8 presents the effects of those scenarios on our variables of interest (the variables that are used as inputs in our banking income subcomponents models), figures 3 and 4 the impacts of those scenarios on our variables.
Table 8: design of scenarios
GDP growth Yield curve SBF 250’s return In deviation from the basis line
T+1 T+2 T+1 T+2 T+1 T+2
1 - 1% GDP growth -0,7 -2,1 0,0 0,0 -1,9 -4,4
2 - 2% GDP growth -2,1 -3,0 0,0 0,0 -4,4 -6,9
3 - 3% GDP growth -2,7 -4,0 0,0 0,0 -5,5 -9,0
4 - 25% depreciation of USD/EUR -1,0 -0,5 0,0 0,0 -1,7 -1,8
5 Flattening of the yield curve 0,0 0,4 -2,0 -2,0 0,2 0,7
Note: the forecast for the baseline scenario for GDP growth. Loan growth and interest rates is as of January 2008.
Figure 3
Impact on income components compared to the baseline scenario -70 -60 -50 -40 -30 -20 -10 0 10 - 1% GDP grow th - 2% GDP grow th - 3% GDP grow th -25% depreciation of USD/EUR Flattening of the yield curve (+ 100bp ST)
Interest (T+1) Commissions (T+1) Trading (T+1)
BP Figure 4 Baseline scenario -0,5% 0,0% 0,5% 1,0% 1,5% 2,0% T-2 T-1 T T+1 T+2
interest income / assets commissions / assets trading income / assets
- 1% GDP growth -0,5% 0,0% 0,5% 1,0% 1,5% 2,0% T-2 T-1 T T+1 T+2
interest income / assets commissions / assets trading income / assets
- 2 % GDP growth -0,5% 0,0% 0,5% 1,0% 1,5% 2,0% T-2 T-1 T T+1 T+2
interest income / assets commissions / assets trading income / assets
- 3 % GDP growth -0,5% 0,0% 0,5% 1,0% 1,5% 2,0% T-2 T-1 T T+1 T+2
interest income / assets commissions / assets trading income / assets
- 25% depreciation of USD/EUR -0,5% 0,0% 0,5% 1,0% 1,5% 2,0% T-2 T-1 T T+1 T+2
interest income / assets commissions / assets trading income / assets
Flattening of the yield curve (+ 100bp ST)
-0,5% 0,0% 0,5% 1,0% 1,5% 2,0% T-2 T-1 T T+1 T+2
A first conclusion to be drawn from figures 3 and 4 is that regardless of the scenario that we consider, fees and commissions revenues are much more impacted by adverse shocks than trading incomes, and than net interest income, that seems the most resilient. It is then straightforward to conclude that a higher share of fees and commissions and trading income in total banking revenues is likely to impend on the resilience of financial institutions. However, the spread flattening shock is likely to impact essentially on the interest revenues. Those results have nevertheless to be taken with high caution, given the high uncertainty surrounding the macroeconomic modelling.
Scenarios 1/ to 3/ (recession shocks)
The recession shocks lead to the biggest negative effects on income subcomponents. A 1% recession shock would decrease the interest income by less than 10 bp, the trading income by about 10bp and the fees and commissions by about 20bp. This is essentially due to the high significant coefficient related to GDP growth in the commissions and fees equation results. With a recession of 3%, the effects would be more spectacular, but the qualitative results would remain the same: an ample effect on commissions and fees, which would go through the GDP growth and the trading stock market channels. In this extreme case, about 70 bp of commissions and fees revenues would be offset.
Scenarios 4/ and 5/
Those scenarios (especially the exchange rate scenario) are the least unfavourable among all adverse shocks tested. In particular, as regards the income revenue, the effect of a flattening yield curve would be compensated by the corresponding increase in the stock market: the effect of that scenario on the income revenue would be paradoxically rather limited. On the contrary, as regards the net interest income, that particular adverse scenario gives the highest effect.
A conclusion to be drawn from those exercises is that in general net interest income is more stable than trading income and much more stable than fees and commissions. In particular scenarios, such as a flattening of the yield curve, the net interest income could be more impacted than other incomes – but to a lesser extent.
6. Conclusion
The evolution of the French banking industry, in the same vein as in other countries, increased supervisors’ monitoring of the diversification of banks’ income sources, and analyses of changes in banks’ income structure as a potential vulnerability. Income sources diversification raises indeed several questions, especially related to the (in)stability of the financial system. The literature on this field has become relatively large and the results are quite divergent.
Globally, the literature tends to show that income source diversification has a positive impact on banks’ profitability and seems to provide some stabilisation effects on earnings volatility. From a supervisory point of view, income diversification may therefore strengthen financial stability as more profitable banks are more likely to absorb losses in stress situations. However, the corollary seems to be that the more banks are profitable, the more they take excessive risks. One challenge for bank supervisors is then to gauge the additional risk taking taken along with additional profitability earned in normal times.
On the other hand, it is important to recognize that any scenario analysis is subject to a number of limitations. On the one hand, in case of an extreme event, correlation among variables and the impact of macroeconomic shocks may deviate from the pattern we observed in the past. Since France never experienced very extreme combinations of adverse shocks in the period used for estimation, one might therefore argue that the model underestimates the effects of extreme scenarios. On the other hand, scenario analysis typically assumes that banks cannot adjust their exposure before they are hit by a severe shock. If they could react quickly enough, the damage resulting from adverse events might be smaller than suggested.
References
Arellano M., Bond S., 1991. Some tests of specification for panel data: Monte-Carlo evidence and an application to employment equations. Review of Economic Studies, n°58, p. 277-297. Athanasoglou P., Brissimis S., Delis M., 2008. Bank-specific, industry-specific and macroeconomic determinants of bank profitability. Journal of International Financial Markets, Institutions and Money, Elsevier, vol. 18(2), pages 121-136, April.
Baele L., Jonghe O., Vennet R., 2007. Does the stock market value bank diversification? Journal of Banking & Finance, vol. 31(7), p. 1999-2023.
Davis P., Tuori K., 2000. The changing structure of banks' income -an empirical investigation. Economics and Finance Working Papers, Brunel University, 00-12.
De Vincenzo A., Quagliariello M., 2005. Redditività e Diversificazione dei ricavi delle banche italiane negli ultimi dieci anni. Studi e Note di Economia 2-2005.
Delgado J., Saurina J., 2004. Credit risk and loan loss provisions: an analysis with macroeconomic variables. Working Paper, Banco de Espana.
De Bandt O., Oung. V., 2004. Bilan des `stress tests' menés sur le système bancaire français. Revue de la Stabilité Financière, n° 5, November.
Drehmann M., 2005. A Market Based Macro Stress Test for the Corporate Credit Exposures of UK Banks. Working Paper, Bank of England.
Elsinger H., A. Lehar and M. Summer 2002. A New Approach to Assessing the Risk of Interbank Loans, Financial Stability Review 3, Oesterreichische Nationalbank
End van de J., Hoeberichts M., Tabhae M., 2006. Modelling Scenario Analysis and Macro Stress-testing. DNB Working Paper, n°119-Nov. 06.
European Central Bank, 2000. EU Banks' Income Structure. April.
European Central Bank, 2007. EU Banking Sector Stability. November 2007.
Hilbers, P., Jones M., Slack G., 2004. Stress Testing Financial Systems: What to Do When the Governor Calls. IMF Working Paper 04/127
Hoggarth, G., Sorensen S., Zicchino L., 2005. Stress tests of UK banks using a VAR approach. Working Paper No 282, Bank of England.
Kalirai H., Scheicher M., 2002. Macroeconomic Stress Testing: Preliminary evidence for Austria. Financial Stability Report 3, Österreichische Nationalbank.
Lehmann H., Manz M., 2006. The exposure of Swiss banks to Macroeconomic Shocks: an Empirical Investigation. Swiss National Banks Working Papers, 2006-4.
Lepetit L., Rous P., Tarazi A., 2006. Bank income structure and risk: An empirical analysis of European banks. Journal of Banking and Finance.
Kwan S., Laderman E., 1999. On the portfolio effects of financial convergence -- A review of the literature. Economic Review, Federal Reserve Bank of San Francisco, 1999, n°.2.
Pain D., 2003. The provisioning experience of the major UK banks: a small panel investigation. Bank of England Working Paper, No. 177.
Pesola J., 2001. The role of macroeconomic shocks in banking crises. Bank of Finland Discussion Paper 6/2001.
Rouabah A., 2006. La sensibilité de l'activité bancaire aux chocs macroéconomiques : une analyse en panel sur des données des banques Luxembourgeoises. Cahier d'études, Banque Centrale du Luxembourg, n°21.
Salas V., Saurina J., 2002. Credit risks in to institutional regimes: Spanish commercial and savings banks. Journal of Financial Services Research, 22(3): 203-224.
Saunders, Walters I., 1994. Universal Banking in the United States: What Could We Gain? What Could We Lose?. Oxford University Press, New York, NY.
Smith R, Staikouras C., Wood G., 2003. Non-interest income and total income stability. Bank of England Working Paper, n°198.
Sorge M., 2004. Stress testing financial systems: an overview of current methodologies. BIS Working Papers, No. 165.
Stiroh K., 2004. Diversification in Banking: is non-interest income the answer? Journal of Money, Credit and Banking, Vol. 36, n°5,p. 1351-1361.
Virolainen K., 2004. Macro Stress-testing with a Macroeconomic Credit Risk Model for Finland. Bank of Finland Discussion Papers, 18.
Documents de Travail
229. Ph. Aghion, Ph. Askenazy, R. Bourlès, G. Cette and N. Dromel, “Education, Market Rigidities and Growth,” January 2009
230. G. Cette and M. de Jong, “The Rocky Ride of Break-even-inflation rates,” January 2009
231. E. Gautier and H. Le Bihan, “Time-varying (S,s) band models: empirical properties and interpretation,” January 2009
232. K. Barhoumi, O. Darné and L. Ferrara, “Are disaggregate data useful for factor analysis in forecasting French GDP ? ” February 2009
233. R. Cooper, H. Kempf and D. Peled, “Monetary rules and the spillover of regional fiscal policies in a federation” February 2009
234. C. Jardet, A. Monfort, and F. Pegoraro, “No-arbitrage Near-Cointegrated VAR(p) Term Structure Models, Term Premia and GDP Growth” June 2009
235. C. Jardet, A. Monfort, and F. Pegoraro, “New Information Response Functions,” June 2009
236. S. Adjemian, C. Cahn, A. Devulder et N. Maggiar, « Variantes en Univers Incertain », Juin 2009
237. P-A. Chevalier, R. Lecat et N. Oulton, « Convergence de la productivité des entreprises, mondialisation, technologies de l’information et conccurence », Juin 2009
238. S. Avouyi-Dovi, M. Bardos, C. Jardet, L. Kendaoui and J. Moquet, “Macro stress testing with a macroeconomic credit risk model: Application to the French manufacturing sector,” June 2009
239. O. Darné and L. Ferrara, “Identification of slowdowns and accelerations for the euro area economy,” June 2009
240. H. Kempf and G. Rota Graziosi, “Leadership in Public Good Provision: a Timing Game Perspective”, July 2009
241. S. Avouyi-Dovi et J.G Sahuc, « Comportement du banquier central en environnement incertain », Juillet 2009
242. J. Coffinet, S. Lin and C. Martin, “Stress testing French banks' income subcomponents,” August 2009
Pour accéder à la liste complète des Documents de Travail publiés par la Banque de France veuillez consulter le site :
http://www.banque-france.fr/fr/publications/documents_de_travail/documents_de_travail_09.htm
For a complete list of Working Papers published by the Banque de France, please visit the website:
http://www.banque-france.fr/fr/publications/documents_de_travail/documents_de_travail_09.htm
Pour tous commentaires ou demandes sur les Documents de Travail, contacter la bibliothèque de la Direction Générale des Études et des Relations Internationales à l'adresse suivante :
For any comment or enquiries on the Working Papers, contact the library of the Directorate General Economics and International Relations at the following address :
BANQUE DE FRANCE 49- 1404 Labolog 75049 Paris Cedex 01 tél : 0033 (0)1 42 92 49 55 ou 62 65 ou 48 90 ou 69 81 fax :0033 (0)1 42 92 62 92 email : [email protected] [email protected] [email protected] [email protected]