Oliver Walter
Reinhold Haeb-Umbach
Bassam Mokbel
Benjamin Paassen
Barbara Hammer
(This is a preprint of the publication [54], as provided by the authors.)
Abstract
Besides the core learning algorithm itself, one major question in ma-chine learning is how to best encode given training data such that the learning technology can efficiently learn based thereon and generalize to novel data. While classical approaches often rely on a hand coded data representation, the topic of autonomous representation or feature learning plays a major role in modern learning architectures. The goal of this con-tribution is to give an overview about different principles of autonomous feature learning, and to exemplify two principles based on two recent examples: autonomous metric learning for sequences, and autonomous learning of a deep representation for spoken language, respectively.
1
Introduction
The ability of animate beings to autonomously learn complex models and non-trivial behaviour based on examples only has fascinated researchers right from the beginnings of machine learning and artificial intelligence. One of the strik-ing observations which contributed to the success of early learnstrik-ing models such as the perceptron consisted in the fact that simple, biologically plausible princi-ples such as Hebbian learning enable systems to provably infer a correct model from given data only. The question how neural networks internally represent these data has been a central issue: the perceptron represents information in a distributed way by encoding relevant aspects in the weights, rather than an explicit symbolic modelling. This enables a high error tolerance, taking into account multiple aspects of the data. However, the fact that the mere per-ceptron has very limited representation capabilities, it can represent linearly separable data only, has severely contributed to its abandoning around 1970. Back-propagation, by providing an efficient mechanism to learn a suitable dis-tributed representation of data in one or more hidden layers, caused a neural renaissance around 1986 [58]. Multilayer networks enable a very rich internal
∗The work was in part supported by Deutsche Forschungsgemeinschaft under contract
no. Ha 3455/9-1 and no. Ha 2719/6-1 within the Priority Program SPP1527 ”Autonomous Learning”.
representation, but sometimes at the costs of difficult optimisation problems for neural network training.
Interestingly, this training complexity, among other problems, accounted for the fact that the last decades have been dominated by powerful models such as the support vector machine (SVM) which is, essentially, a generalized linear map: the perceptron is enhanced by a kernel, i.e. an implicit fixed nonlinear preprocessing [12]. This avoids cumbersome training with local optima and numerical problems, since it enables a formalization of model optimization in terms of convex quadratic programming. This approach is very successful be-cause universal kernels exist for standard vectorial data [48, 21]; still, the choice of a suitable kernel and its parametrization for a given task can be tricky – even more so, if data are complex such as non-vectorial or symbolic data [37]. The idea of a kernel representation can be put into a line with the recent success of extreme learning or reservoir computing [16, 29, 36]. In their original form, these approaches, albeit yielding remarkable results, rely on a priorly fixed, albeit usually rich choice of a suitable data representation.
A kernel representation or nonlinear preprocessing enables highly nonlinear models as compared to the simple perceptron – still such representation has to be designed by humans, who often rely on rich universal representations such as Gaussian kernels or even random mapping rather than representations tailored for the problem at hand. Domain specific invariances such as e.g. different light-ning conditions for image recognition tasks or auxiliary semantic information are usually not taken into account in this universal representation.
Since about 2006, deep neural networks with multiple stacked hidden lay-ers started another renaissance of highly nonlinear data representation tailored for a specific domain under the umbrella term ‘deep learning’ [27, 6]. Essen-tially, deep learning refers to stacked nonlinear models such as neural networks or probabilistic counterparts which are characterized by a high degree of non-linearity due to the hierarchical composition of a large number of nonlinear elements, and all elements are adaptive. It has been known since a while that such stacked systems have beneficial mathematical properties as concerns their representation ability [9, 24], however, efficient training of deep networks has long constituted a problem [7]. Novel training paradigms such as efficient un-supervised pre-training of architectures with restricted Boltzmann machines as well as a high degree of architectural regularization have recently turned such networks into efficient models. Interestingly, these models often automatically arrive at powerful internal representations of information within hidden layers, where relevant characteristics such as invariance against certain changes can be inferred based on the given data only [6, 38].
Still, the autonomous inference of a rich data representation which facili-tates the design of learning systems constitutes one of the central questions in machine learning. In this contribution, we will give an overview about a num-ber of different approaches for autonomous feature learning in the context of supervised machine learning tasks (as opposed to reinforcement learning, which is addressed in the contribution from W. B¨ohmer et al. in this volume). After-wards, we will address two specific approaches which accompany two relevant
application scenarios: (1) How to autonomously adjust the metric in distance based approaches if non-vectorial data, in this case sequences, are present? An approach which extends metric learning to this setting will be presented. (2) How to infer a deep hierarchical model to represent spoken language in the case that the basic constituents such as words and phonemes are not known? We show how a Bayesian formalisation of the hierarchical concept enables the unsupervised inference of entities such as words from raw data.
2
Representation learning
There exists a variety of different principles based on which a suitable feature representation can be extracted from given data. The article [6] provides a recent review of different principles of representation learning; it summarizes diverse technologies such as the following:
(1) Deep learning has its counterparts in biological systems [34, 6, 27, 37]; deep learning essentially processes signals by means of stacked, highly regular, nonlinear transformations, which are trained to optimally represent given data sets. It turns out that the architectural constraints often enable the autonomous learning of invariances such as rotation or translation invariance and robustness to partial occlusion and lightning conditions for image recognition. Deep learn-ing requires a sufficient number of trainlearn-ing data, and trainlearn-ing can be quite time consuming due to the underlying complex architectures.
(2) Sparse coding aims at efficient, meaningful representations of high dimen-sional signals relying on the natural bias of sparsity [28, 14, 1]; this principle make use of the fact that many real valued signals can be represented as lin-ear combination of few basic motifs, such as sound which can be decomposed into a sparse combination of oscillations. Sparse coding provides means to find a sparse decomposition of given signals, if existing, and to learn suitable dic-tionaries from observed data. Naturally, the technique is restricted to settings where such sparse approximations exist.
(3) Nonlinear dimensionality reduction formalizes the aim to represent high dimensional signals efficiently in low dimensions relying on different invariances, such as metric preservation, preservation of the probability distribution, etc. [52, 18]; dimensionality reduction plays a role as soon as data are visualized, since this requires an embedding of data in two or three dimensions. The chal-lenge is to unravel characteristics from the data, i.e. to find a low-dimensional representation which is still meaningful. Since this problem is ill-posed unless data are intrinsically low-dimensional itself, one of the challenges of dimensional-ity reduction is to find suitable regularizations for the projection; at present, no clear guidelines which dimensionality reduction technique is suitable for which data set and task exist.
(4) Highly regularized signal extraction technologies such as slow feature analysis (SFA) for the autonomous extraction of meaningful semantic entities from temporal data [59], or independent component analysis (ICA) for the ex-traction of independent semantically meaningful sources from mixed data [30];
both techniques put a suitable prior to the data to solve an otherwise ill-posed problem. These priors seem particularly suitable for some type of real-world data, such as the analysis of brain signals.
Besides their different objectives and application scenarios, these principles can be stratified according to different fundamental criteria, such as the follow-ing:
• Are the techniques supervised, taking into account label information for a classification task or similar, or unsupervised? Unsupervised techniques have the benefit that their results are often more general, i.e. they gener-ate codes which can be transferred across tasks within the same domain. One interesting example for this principle are generative models such as hierarchical restricted Boltzmann machines, which can be used as excel-lent dimensionality reduction techniques e.g. for the visual domain [6, 27]. On the contrary, supervised approaches guarantee that the information which is used to represent the data is relevant for the task, suppressing irrelevant aspects and noise. This is particularly relevant if only few data points are available since the problem would be ill-defined without shaping it according to such auxiliary knowledge [19].
• Are the techniques linear or nonlinear; the latter can further be differen-tiated according to the degree of nonlinearity, ranging from generalized linear models such as kernel mappings up to deep or hierarchical models. Linear techniques have the benefit of a better efficiency, interpretabil-ity, and generalization ability; deep models, on the contrary, can easily represent topologically complex manifolds such as arise due to complex invariances in the data, for example. Interestingly, stacking networks of similar shape and parameterization leads to topological objects which re-semble a fractal nature and self-similarity, a principle which is well known in the context of recurrent networks [51].
• Which type of data can the techniques deal with? Which type of repre-sentation is extracted? So far, most methods deal with vectorial signals or time series for both, input data and learned representation. Only few ap-proaches address a richer representation or more complex data structures auch as discrete sequences or graph structures [37].
• What is the degree of autonomy for representation learning? How much training data, user interaction, and prior knowledge in terms of a Bayesian prior or the specification of an exact objective are required? Some pop-ular representation learning techniques are fully unsupervised e.g. aiming for the most likely data representation in a probabilistic treatment such as present for deep belief networks; these methods usually require lots of given data to extract meaningful regularities. Alternatively, some ap-proaches are fully supervised and coupled to a concrete learning task, such as feature selection for classification. Methods which display a certain degree of autonomy, which require neither big data sets nor supervised
objectives, often rely on ingenious mathematical realizations of what can be seen as natural priors, such as e.g. the slowness principle in slow feature analysis, sparsity in data representation, or independence of signals in in-dependent component analysis [59, 30, 28, 14, 1]. These priors are hand designed, and hardly any techniques exist to autonomously infer natural priors from an interaction with the environment.
3
Metric learning for sequential data
Metric learning essentially deals with the question of how to choose a metric in popular distance-based machine learning technologies such as k-nearest neighbor classifiers in an optimum way. Since an adaptation of the metric used for pair-wise data comparison directly corresponds to a transformation of the data space, metric learning can be seen as one instance of representation learning. Since about 2000, metric learning rapidly advanced along different lines of research and, currently, can be considered a matured field of research for the vectorial case as summarized e.g. in the overview articles [35, 5]. Two of the earliest ap-proaches introduce metric learning in prototype based methods: an enrichment of the unsupervised self-organizing map by a metric adjusted according to aux-iliary information [32], and an enhancement of learning vector quanitzation to a general quadratic form which is autonomously adapted according to the clas-sification task at hand [23]. While the former relies on the local Fisher metric and hence displays a rich capacity but also very high computational complexity, the latter restricts to a simple parameterized quadratic form. Interestingly, it can easily be generalized to local metrics, i.e. a globally nonlinear forms, and it can be accompanied by strong learning theoretical guarantees [43].
Due to its computational simplicity, quite a few techniques of how to adapt quadratic forms have been proposed in the literature afterwards; a few popular ones include the following: The approaches [60, 45] rely on side information for clustering which specifies sets of data assigned to the same cluster. Then effi-cient adaptation mechanisms which realise these constraints by an adjustment of a quadratic form can be derived. Popular metric learners which are based on the classification error of a k nearest neighbor classifier have been proposed in the approaches [57, 20]. A proposal which couples metric learning to the observed regression error has recently been published in the article [2]. Besides computational efficiency, the latter can also be accompanied by formal guar-antees. Similar learning theoretical guarantees are available for metric learning within the family of vector quantization techniques [43]. Besides the local metric learning techniques as proposed in this approach [43], quite a few metric learn-ing techniques lend itself towards kernelization, resultlearn-ing in globally nonlinear data transformations [5].
While advancing the question of how to autonomously determine a good data representation in the context of diverse side information, these approaches have in common that they are restricted to vectorial data, i.e. restricted ap-plication scenarios only. First techniques extend these methods to richer data
structures, in particular strings, sequences, and trees. A few proposals in this frame are covered in the publications [46, 3, 8, 5]. These techniques often rely on a generative approach and determine metric parameters by a data likelihood optimization. Hence they are restricted to learning from positive examples only, not taking into account prior labels or dissimilar pairs. Exceptions are the pro-posals [3, 4, 40] which refer to a regression task similar to [2] or a classification task similar to [43], respectively. In the following, we will focus on the latter approach which has been developed within the frame of the priority program ‘Autonomous Learning ’ of the DFG. Essentially, it introduces a framework for autonomous metric learning for sequence data in the context of prototype based classification. As an alternative, it would be possible to test the approach [4] for sequence metric adaptation for classification, which is based on a formal notion which quantifies that the neighbors of the given data points are, on average, good as regards the relevant classification, a setting which is particularly suited for a k-nearest neighbor classifier or a representation of sequential data in terms of distances to a set of landmarks. Here, we will focus on a prototype-based representation instead.
3.1
Relational LVQ for sequence data
Learning vector quantization (LVQ) refers to a family of intuitive classification schemes, which have recently attracted increased attention in particular in the context of interpretable models e.g. in biomedical data analysis, on the one side, and life-long learning, on the other side [42, 10, 17, 13, 33, 61]. This is caused by the fact that LVQ inherently relies on a representation of the model in terms of typical prototypes such that an intutitive model inspection as well as a compact data description is delivered by the technique; when referring to a probabilistic formalization of LVQ techniques, this corresponds to data being represented by a mixture of Gaussians – however, unlike classical Gaussian mixture models, the parameters are optimized according to the conditional likelihood of the output label rather than the data itself [44]. Deterministic counterparts such as generalized LVQ (GLVQ) can be designed in such a way that they additionally focus on a good generalization ability in terms of margin maximization.
These approaches have recently been generalized to nonvectorial data struc-tures which are described in terms of pairwise similarities or dissimilarities only, see the article [22] for a general framework. Here, we will exemplarily focus on only one possibility, relational GLVQ (RGLVQ). RGLVQ relies on train-ing data which are characterized by pairwise dissimilarities dij only, where i, j∈ {1, . . . , n}. These measurements could be the result of an edit distance of sequence data, an alignment for DNA or protein sequences, or pairwise graph distances, for example, depending on the area of application. RGLVQ relies on the assumption of symmetry dij =dji and zero diagonal dii = 0. In such
cases, there always exists a vectorial embedding of the data such that these distances are induced by a symmetric quadratic form, which is not necessarily positive definite, i.e. a so-called pseudo-euclidean space is present [43]. Within this space, vectorial operations are possible, i.e. we can represent data by vectors
~xiand distances by a quadratic formdij =d(x~i, ~xj). Assume data~xiare labeled c(~xi). Then, a protoype-based classification model in pseudo-euclidean space is
given by representative positionsw~1, . . . , w~k with labels c(w~j). It induces the
classification
~
x7→c(w~j) whered(~x, ~wj) is minimum (1)
of a given point~x(where we refer to its position in the pseudo-euclidean em-bedding). The aim of a prototype-based classifier is the minimization of the classification error, i.e. the termP
iH(d +(~x
i)−d−(~xi)) whereH refers to the
Heaviside function, d+ to the distance of ~x
i from the closest prototype with
correct label, andd− to the distance from the closest prototype with incorrect label. Since an optimization of the classification error itself is NP hard, GLVQ resorts to an approximation X i Φ d+(~x i)−d−(~xi) d+(~x i) +d−(~xi) (2)
Here, the sigmoidal function Φ is used as approximation for H. In addition, since this form would yield to divergence due to its summands being unlimited, a normalization of the summands by the sum of distances is introduced. It can be shown that this term relates to the hypothesis margin of a classifier, i.e. its minimization accounts for a robust result [43].
This model, however, refers to an explicit pseudo-euclidean embedding of data, which is usually not present. Rather data are characterized by the terms dij, resulting in the distance matrix D of pairwise distances only. It is always
possible to compute an explicit pseudo-euclidean embedding from D, but at cubic costs. RGLVQ offers a way to avoid this explicit embedding, resulting in an equivalent formalization at quadratic costs only. For this purpose, prototype locations are restricted to linear combinations of the form
~ wj = X αji~xi with X i αji= 1 (3)
Based on this assumption, pairwise distances can be expressed as d(~xi, ~wj) = [Dαj]i−
1 2 ·α
t
jDαj (4)
whereαj = (αj1, . . . , αjn). This results in the costs
X i Φ d(~xi, ~w+)−d(~xi, ~w−) d(~xi, ~w+) +d(~xi, ~w−) (5) with d(~xi, ~w±) = [Dα±]i− 1 2 ·(α ±)tDα± (6)
These costs do no longer depend on an explicit vectorial embedding. Hence this formalization allows an optimization of prototype parameters αj based on D
only. Typically, gradient techniques are used in this frame. See the publication [22] for details.
3.2
Autonomous adaptation of sequence metrics within
LVQ
While resulting in an efficient classifier for dissimilarity data, the accuracy cru-cially depends on the quality of the chosen dissimilarity measure and its param-eterization. Autonomous metric learning in parallel to prototype adaptation has proved a central ingredient of state-of-the-art LVQ techniques for vectorial data; in the following, we briefly discuss how this principle can be transferred to discrete symbolic data, i.e. relational LVQ as well. We assume that sequential data are given, i.e. data have the formY=y1, . . . , yK with lengthKand entries ylin some suitable data space Σ, e.g. a real-vector space for sensor signals or a
discrete alphabet for bioinformatics sequences.
The alignment distance constitutes one of the most common measures to compare two such sequences with possibly different length: An alignment of two sequencesYandZis an extension of these two sequences by gaps, referenced by −, such that the resulting sequencesY∗ andZ∗ have the same length. Having fixed a dissimilarity measure of how to compare sequence entries enriched by the symbol−
dλ: (Σ∪ {−})×(Σ∪ {−})→R (7)
which may depend on parametersλ, two aligned sequencesY∗andZ∗can easily be compared by summing the distances of all sequence entriesyi∗ andzi∗. The alignment distanced∗(Y,Z) of two sequences is then defined as the minimum distance of all possible alignments of these sequences.
Usually, the outcome crucially depends on the parameterization λ. Similar to the vectorial case, the optimization of the prototypes in the costs 5 can be accompanied by an adaptation of the parameters λ: the basic idea is to optimize these parameters simultaneously to the model parametersαjlby means
of a gradient technique. Hence autonomous metric learning boils down to the question of how to efficiently compute derivatives of the alignment distance with respect to its basic parameters λ. In general, this is not possible since the alignment distance is discontinuous, hence a derivative does not exist. It has been proposed in the recent work [40] to use an efficient approximation of a dynamic programming scheme, instead, as follows: an optimum alignment can easily be computed based on the Bellman optimality principle by dynamic programming, resulting in the central recursion formula
d∗(Y(0),Z(0)) = 0, (8) d∗(Y(0),Z(J)) = J X j=1 dλ(−, zj), d∗(Y(I),Z(0)) = I X i=1 dλ(yi,−),
d∗(Y(I+ 1),Z(J+ 1)) = minnd∗(Y(I),Z(J)) +dλ(yI+1, zJ+1), d∗(Y(I+ 1),Z(J)) +dλ(−, zJ+1), d∗(Y(I),Z(J + 1)) +dλ(yI+1,−) o .
where Y(I) and Z(J)refers to the first I orJ entries of the sequence Y or Z. The latter three choices refer to an optimal alignment by one of the three possibilities, a match of the last sequence entries, an insert or a delete. This recursion formula can be computed in quadratic time. When we substitute the discrete operator min by the smooth function
softmin(x1, x2, x3) = X i xi exp(−βxi) P jexp(−βxj) (9) with β > 0, we arrive at an approximation which allows us to compute the derivative of the alignment distance by means of exactly the same Bellmann principle in quadratic time. This can easily be inserted into a gradient scheme for the costs 5. See [40] for details.
3.3
Experiments
We shortly elucidate the results obtained by autonomous structure metric learn-ing for sequences in two important cases: a discrete symbol alphabet and con-tinuous sequence entries. For this purpose, we consider the following two data sets: e d c b a = A B C D E − e d c b a = A B C D E − 0.00 0.25 0.50 0.75 1.00 e d c b a = A B C D E − e d c b a = A B C D E − 0.00 0.25 0.50 0.75 1.00
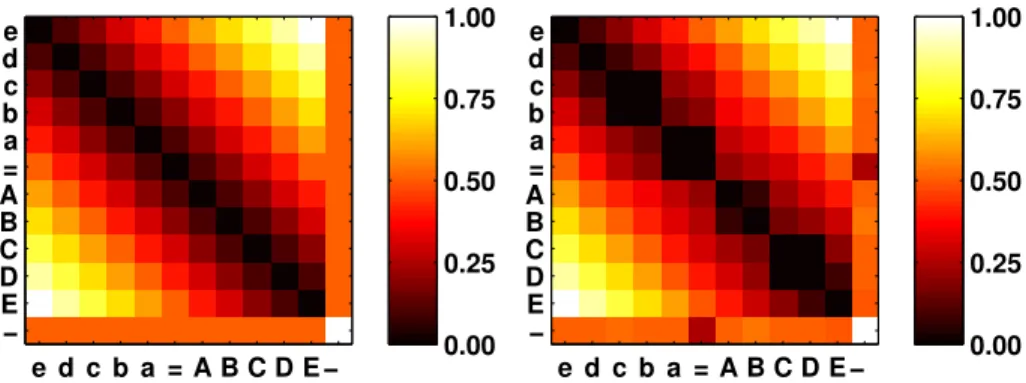
Figure 1: Left: prior scoring matrix used for sequence comparison; right: pos-terior scoring matrix optimized according to the given classification task.
Copenhagen Chromosomes:
The data set consists of images of two different chomosomes which are encoded by the differential change of the thickness of the silhouette. The differences
are encoded via the discrete alphabet Σ ={f, . . . , a,=, A, . . ., F}, with lower / upper cases encoding negative / positive changes, respectively. Hence every data point corresponds to a sequence with entries in the discrete alphabet Σ.
A comparison of such sequences depends on the local scoring matrix which compares these letters, i.e. a scoring matrix of size (|Σ∪ {−}|)2which indicates the costs of substituting one symbol by another (or a gap). This matrix is as-sumed to be symmetric to account for symmetric dissimilaritiesD. A reasonable prior assumption is to put a larger weight on large changes within the alpha-bet, taking into account the differential encoding of the thickness, as shown in Fig.1(left). However, it is not clear whether such prior weighting is optimal for the task.
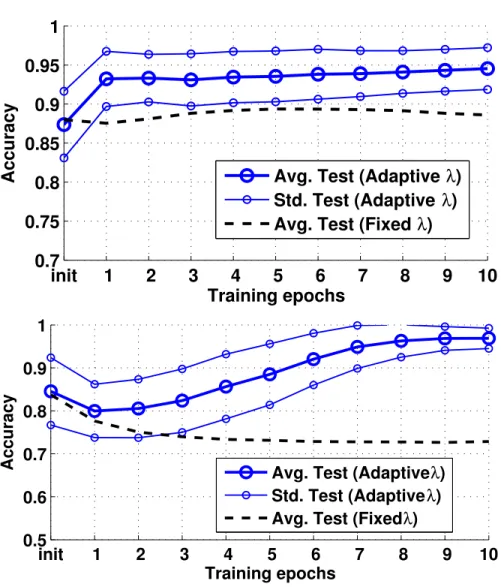
Online learning of these scores confirms a prior which assigns higher scores to off-diagonals, however a more subtle structure is obtained, see Fig.1(right). The obtained structure is almost independent of the initialization of the scoring matrix. The accuracy obtained when adapting the scoring matrix in addition to the prototypes is presented in Fig.2(top) when initializing scores with the unit matrix and Fig.2(bottom) when initializing with a diagonal weight prior. In both cases, the obtained accuracy approaches 0.95 in a cross-validation. In-terestingly, albeit the diagonal weight prior is closer in characteristics to the learned scoring metric than the unit matrix, the latter displays a higher accu-racy. This clearly demonstrates the potential of an autonomous metric learning which can take into account subtle differences indicated by the data. See [40] for details as regards the training set and parameters of the algorithm.
Java programs:
The data set consists of java code corresponding to implementations of sorting programs according to the two different strategies Bubblesort and Insertionsort (programs are taken from the internet). Programs are represented as sequences as follows: the Oracle Java Compiler API transforms every program into a syntax tree where every node is described by a number of characteristics (such as return type, type, or scope). These trees are transferred to sequences by prefix notation.
An alignment distance can be rooted in a pairwise comparison of entries which essentially, for every characteristics, tests a match versus mismatch. The challenge is then how to weight the relevance of these single characteristics; a good prior is to use a uniform weighting of every component. In general, a weighted distance measure which assigns the weightλlto the similarity of the lth characteristic of a node is taken. Metric learning enables an automated adaptation of these weighting terms λl. The result of such relevance learning
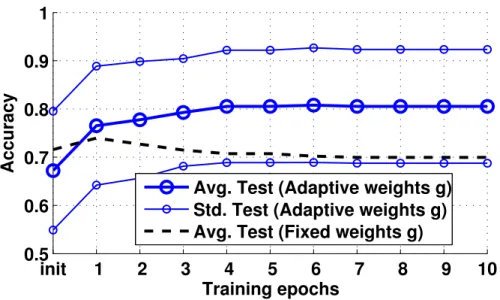
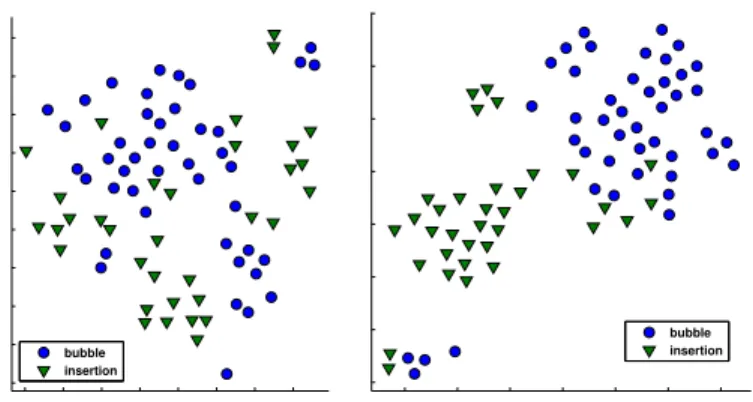
is depicted in Fig.4 for the sorting data set (see [40] for details of the setup). Interestingly, the relevance weighting emphasizes the relevance of a node type as compared to e.g. code position, the latter being not useful for a class dis-crimination. The classification accuracy can be improved to an average .8 when using the adapted metric (see Fig.3). The metric adaptation corresponds to a different data representation, as can be seen in Fig.5. While classes overlap for
init
1
2
3
4
5
6
7
8
9
10
0.7
0.75
0.8
0.85
0.9
0.95
1
Training epochs
Accuracy
Avg. Test (Adaptive
λ
)
Std. Test (Adaptive
λ
)
Avg. Test (Fixed
λ
)
init
1
2
3
4
5
6
7
8
9
10
0.5
0.6
0.7
0.8
0.9
1
Training epochs
Accuracy
Avg. Test (Adaptive
λ
)
Std. Test (Adaptive
λ
)
Avg. Test (Fixed
λ
)
Figure 2: Accuracy of the chromosome data set with matrix learning when initializing with default values (top) or a bandpattern (bottom).
the default weighting which assignes the same relevance to every node entry, a task-adapted relevance weighting clearly emphasizes class-separability.
3.4
Software
An efficient realization of differentiable approximations of local and global align-ment distances as well as their derivatives and diverse visual inspection technol-ogy can be found at http://openresearch.cit-ec.de/projects/tcs. These metrics can directly be plugged into relational LVQ, see e.g. http://www.techfak.uni-bielefeld.de/∼xzhu /ijcnn14 tutorial.html
3.5
Outlook
We have discussed that the principle of metric learning can be transferred to structured data such as sequences, by means of a seamless integration of re-lational LVQ and gradient based schemes for the optimization of metric and prototype parameters. While the results are very promising, the approach suf-fers from a high computational load: the full dissimilarity matrixD has to be computed after every optimization step. In [40], diverse approximation schemes have been proposed, however, it might be worthwhile to also think about an alternative characterization of the distance measure in terms of a linear combi-nation of dissimilarity matrices, for example.
4
Representation learning from sequential data
Conventional automatic speech recognition (ASR) systems rely on supervised learning, where an acoustic model is trained from transcribed speech, and a language model, i.e., the a priori probabilities of the words, from large text corpora. Both, the inventory of word, i.e., the vocabulary, and the inventory of phonemes are fixed and known. Furthermore, a lexicon is given which contains for each word its pronunciation in terms of a phoneme sequence.
Here we consider an unsupervised setting, where neither the pronunciation lexicon nor the vocabulary and the phoneme inventory are known in advance, and the acoustic training data come without labels. Referring to the hierarchical nature of speech, we are therefore concerned with the task of unsupervised learn-ing of a deep representation from sensory input, the discovery of the phonetic and lexical inventory.
For speech recognition, an audio recording is typically represented as a time series of real valued vectors of frequency or cepstral coefficients. A symbolic rep-resentation is learned by discovering repeated sequences of vectors and assigning the same labels to similar sequences. On this label sequence again similar se-quences can be discovered and given labels from another label set, thus arriving at representations at different levels of hierarchy. Figure 6 shows an example of a two level hierarchical representation of a speech signal.
init
1
2
3
4
5
6
7
8
9
10
0.5
0.6
0.7
0.8
0.9
1
Training epochs
Accuracy
Avg. Test (Adaptive weights g)
Std. Test (Adaptive weights g)
Avg. Test (Fixed weights g)
Figure 3: Accuracy on the sorting data set for an adapted structure metric obtained via cross-validation.
0 0.1 0.2 scope codePosition name externalDependencies parent className type returnType
bubble insertion
bubble insertion
Figure 5: t-SNE projection of the data based on the standard alignment distance (left) and the adapted metric (right).
TURN
ON
THE
LIGHT
Phonemes
Words
Audio Signal
...
...
T
ER
N OH N DH AX
L
AY
T
G
W
Y
X
Lexicon Acoustic model
Pitman-Yor process
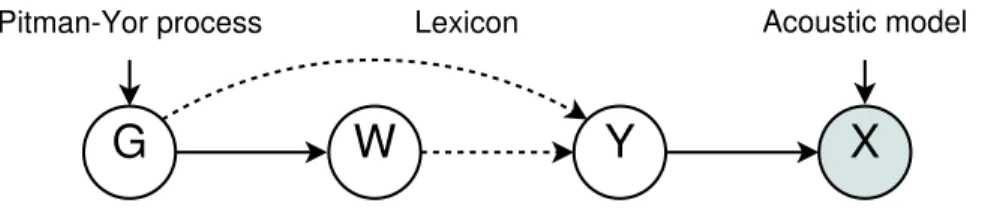
Figure 7: Graphical model with random variables dependencies for the language ModelG, words W, phonemesY and acoustic feature vectorsX. The shaded circle denotes the observations, solid lines probabilistic dependencies and dashed lines deterministic dependencies.
On the first hierarchical level the aim is to discover the acoustic building blocks of speech, the phonemes, and to learn a statistical model for each of them, the acoustic model [11, 56, 53, 47]. In speech recognition, the acoustic model usually consists of Hidden Markov Models (HMMs), where each HMM emits a time series of vectors of cepstral coefficients.
The second level is targeted at the discovery of the lexical units, the words, and learning their probabilities, the language model, from the phoneme se-quences of the first level [55, 41, 25, 26, 39]. In speech recognition, the mapping of words to phoneme sequences is typically determined by a pronunication lexi-con. So calledn-gram language models are used to calculate the probabilities of words, depending on their context, which is given by then−1 preceding words. They usually consist of categorical distributions over words for each context.
Figure 7 shows a graphical model for the dependencies between the random variables. The language Model Gand the lexicon are generated from a prior process, the Pitman-Yor process. Then wordsWare generated using the lan-guage model and mapped to phonemesY using the lexicon. Acoustic feature vectorsXare finally generated employing an acoustic model.
In this article we will focus on the autonomous learning of representations on the second level, the discovery of words from phoneme sequences, where the phoneme sequences have been generated by a phoneme recognizer in a super-vised fashion, i.e. by the recognition of the speech signal, assuming the phoneme set and acoustic models for each of the phonemes to be known.
Since phoneme recognition from recordings of continuous speech is a difficult task, even if the phoneme inventory is known and their models are trained in advance, the recognized phoneme sequences will be error-prone. To cater for recognition errors we are going to operate on phoneme lattices. A phoneme lattice is a directed acyclic graph, which contains not only a single recgonized phoneme sequence, but also alternatiaves, in the hope that the correct phoneme sequence is among them. Standard ASR phoneme recognizers are able to output a phoneme lattice together with probabilities for each phoneme in the lattice.
4.1
Word recognition from sequential data
We first consider a supervised scenario, where the pronuncation lexicon and the language model are known. The objective of word recognition, given a phoneme sequenceY=y1, . . . , yK of lengthK, is to segment the phoneme sequence into
the most probable word sequence: ˆ
W= arg max
W
P(W|Y) = arg max
W
P(Y|W)P(W), (10)
where both ˆW= ˆw1, . . . ,wˆL, the identity of the words, and the numberL of
words in the sequence are determined in the course of the maximization. Here P(Y|W) is given by the lexicon and equals one if the character sequenceY is a concatenation of the words in W, and zero else. The probability of a word sequence is calculated employing ann-gram language model, with
P(W)≈ L Y l=1 P(wl|wl−1, . . . wl−n+1) =: L Y l=1 P(wl|u). (11)
Here, P(wl|u) is the probability of the l-th word wl, given its context u = wl−1, . . . wl−n+1. It can be estimated on training data. In Bayesian language
modeling, additionally a prior probability is incorporated.
4.2
Unsupervised learning from sequential data
We now turn to the case where neither the pronunciation lexicon nor the lan-guage model are known, and where we are still left with the task to segment a phoneme string into the most probable word sequence. Here we have to learn the language model together with the words. We use the nested hierarchical Pitman-Yor language model (NHPYLM), denoted by G, which is a Bayesian language model and allows new, previously unseen words, to evolve and as-signs probabilities to them. It is based on the Pitman-Yor process prior, which produces power-law distributions that resemble the statistics found in natural languages [49, 50, 39].
An n-gram language model Gu is a categorical distribution of
probabili-ties for theN words of the vocabulary: Gu= {P(w1|u), . . . , P(wN|u)}. In a
hierarchical Pitman-Yor process,Gu is modeled as a draw
Gu∼P Y(d|u|, θ|u|, Gπ(u)) (12)
from a Pitman-Yor process with base measure Gπ(u), strength parameterd|u| and discount parameter Θ|u|[50]. The base measure corresponds to the expected probability distribution of the draws and is set to the language modelGπ(u)of
the parent (n−1)-gram. This process is repeated until the parent LM is a zerogram. Since in the unsupervised setting the vocabulary size is not known in advance, the zerogram cannot be specified. It is therefore replaced by the likelihood for the word being a phoneme sequence, calculated by a hierarchical Pitman-Yor language model (HPYLM) of phonemesH0, similar to (11), where
again a hierarchy of phoneme language models is built up to some order m, similar to (12). The phoneme zerogram is finally set to a uniform distribution over the phoneme set. The resulting structure is the NHPYLM, which consists of a HPYLM for words and a HPYLM for phonemes.
Since we now have to learn the NHPYLM along with the words, the maxi-mization problem becomes:
( ˆW,Gˆ) = arg max W,G P(W,G|Y) = arg max W,G P(Y|W,G)P(W|G)P(G) = arg max W,G P(Y|W)P(W|G)P(G) (13) Here we exploited the fact thatY is independent ofGifWis given, since Y is the concatenation of the phoneme sequences of the words inW. P(Y|W) is again either one or zero as before. The difference to equation (10) is, that the nested hierarchical Pitman-Yor process prior P(G) over the language model is introduced. Instead of having one particular language model, we have to find that pair of language model and word sequence which maximizes the joint probability. The maximization is carried out by Gibbs sampling, first sampling the word sequence from P(W|Y,G), calculated similar to (10), by keeping G constant in (13) and then the language model from P(G|W) [39] in an alternating and iterative fashion.
The previous formulation can be extended to acoustic features Xas input [41]. The maximization problem then becomes
( ˆW,Gˆ,Yˆ) = arg max W,G,Y P(W,G,Y|X) = arg max W,G,Y P(X|Y,W,G)P(Y|W,G)P(W|G)P(G) = arg max W,G,Y P(X|Y)P(Y|W)P(W|G)P(G). (14)
Here,P(X|Y) is calculated by an acoustic model, which we assume to be known and fixed. For the maximization we now jointly sample a word and phoneme sequence from P(W,Y|X,G), by keepingG constant in (14) and then again proceed by sampling the NHPYLM fromP(G|W). To avoid the recomputation of the acoustic model scores with every iteration, we use a speech recognizer to produce a phoneme lattice, containing the most likely phoneme sequences.
Joint sampling of the word and phoneme sequence can be very costly. For every possible phoneme sequence, the probabilities of every possible word se-quence has to be calculated. To reduce the computational demand, the phoneme sequence is first sampled from the speech input and then a word sequence from that phoneme sequence [26, 25]. For the sampling of the phoneme sequence, an additional phoneme HPYLMH, which includes the word end symbol, is em-ployed. To incorporate knowledge of the learned words, the phoneme HPYLM is sampled fromP(H|W) using the sampled word sequence.
Starting with low language model orders and increasing the orders afterksw
iterations leads to convergence to a better optimum. Higher-order LMs deliver better segmentation results than low-order LMs if the input sequence is noisefree [25]. On the other hand initialization of higher-order LMs from noisy input is more difficult and is likely to lead to convergence to a local optimum.
Algorithm 1 summarizes the iterative approach to vocabulary discovery from raw speech. The first step in the repeat loop is carried out by a phoneme rec-Algorithm 1Iterative vocabulary discovery from raw speech
Input: X,ksw
Output: Y,W,G,H
Initialization: SetG,Hto phoneme zerograms,k= 1 whilek≤kmax do
1) Transcribe each speech utterance X into phoneme sequence Y using HPYLMH, resulting in a corpusYof phoneme strings: X→H Y
2a) Carry out word recognition on the phoneme sequences, using the NPYLMG, resulting in a corpusWof words sequences: Y→G W
2b) Re-estimate the word NPYLMGand the phoneme HPYLMH using the word sequences: W→G,H
if k=ksw then
Increase language model orders end if
k=k+ 1 end while
ognizer. However, to save the computational effort of repeated phoneme recog-nition, a phoneme lattice is produced by the ASR engine in the first iteration, and the updated HPYLMH is applied by rescoring in later iterations. Then the most probable phoneme string is extracted from the lattice using Viterbi decoding. Tasks 2a) and 2b), i.e., word recognition and language model estima-tion, are carried out on the currently most probable phoneme sequence using the algorithm of [39].
4.3
Experimental results
Experimental results were obtained using the training speech data from the Cambridge version of the Wall Street Journal corpus (WSJCAM0) [15], com-prised of 7861 sentences. The size of the vocabulary is about 10k words. A monophone HMM acoustic model was trained on the training set and decoding was carried out on a subset of the same set, consisting of 5628 sentences, using the monophone models and a zerogram phoneme LM, producing a lattice at the output. The phoneme error rate of the highest scoring path was about 33% and the segmentation algorithm was run for kmax = 100 iterations, switching the
word language model orders fromn= 1 ton= 2 and phoneme language model order fromm= 2 tom= 8 afterksw = 25 Iterations.
Rank cw Phonemes Characters 1 3489 dh ax THE 13 447 s eh d SAID 17 365 m ih s t ax MISTER 20 327 f ay v FIVE 23 279 p ax s eh n t PERCENT 25 268 m ih l ia n MILLION 26 267 s ah m SOME 27 263 k ah m p ax n iy COMPANY 29 259 d oh l ax z DOLLARS 33 235 hh ae v HAVE
Table 1: Most often found words with more than 3 characters
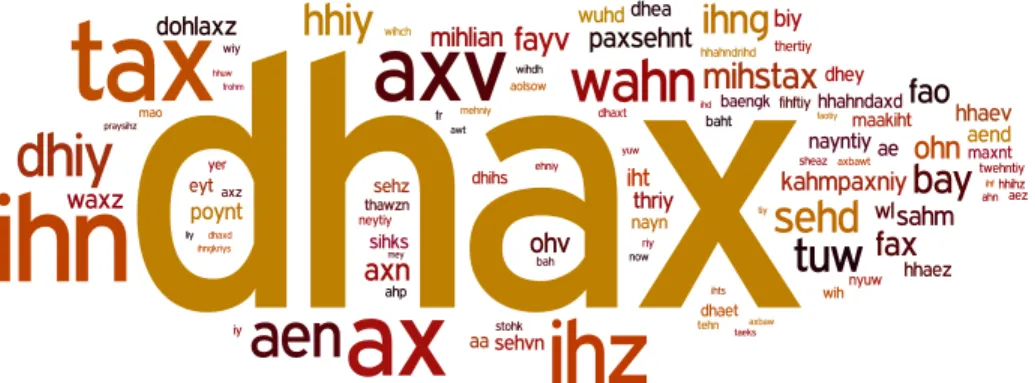
Figure 8 shows the 100 most often found phonetic words. The bigger a word is printed, the more often it was found in the data. Some words with more
Figure 8: 100 most often found phonetic words
than three characters and their corresponding phoneme based representations are listed in table 1, where cw is the number of times the word was found.
Additionally to the listed words, the numbers one to 10 (“w ah n”, “t uw”, “th r iy”, “f ao”, “f ay v”, “s ih k s”, “s eh v n”, “ey t”, “n ay n”, “t eh n”) as well as 20 (“t w eh n t iy”), 30 (“th er t iy”), 50 (“f ih f t iy”) and 90 (“n ay n t iy”) are amongst those words.
In total 28.6% of the words from the running text were correctly discovered (recall) where 32.2% of all the discovered words are correct (precision), resulting in an F-score of 30.3%. The phoneme error rate was reduced to 24.5%. The precision for the lexicon is 13.2% with a recall of 21.8%, resulting in a lexicon F-score of 16.4%. Out of the 100 most often found words, 80 were correct words. Our implementation needed a runtime of about 10 hours for the 100 iterations on a single core of an Intel(R) Xeon(R) E5-2640 at 2.50GHz resulting in a realtime factor of one.
dis-covery can be found in [31]. These algorithms, however, don’t consider recog-nition errors in the phoneme sequences as we do. Word discovery on noisy phoneme lattices was also considered in [41], using similar methods. A compar-ison in [26] showed greatly improved F-scores of our proposed method compared to [41] for wordn-grams greater than 1. This is due to a more consistent use of the language model hierarchy combined with our iterative approach, making it computationally feasible. For a more detailed analysis see [25].
4.4
Software
We implemented the algorithm using weighted finite state transducers (WF-STs) and the OpenFst library. A download is available at: http://nt.uni-paderborn.de/
mitarbeiter/oliver-walter/software/.
4.5
Outlook
Due to the high variability of speech within and especially across speakers, a single word can have different phoneme transcriptions. Recognition errors will also lead to different phoneme sequences. Two examples can be found in the 100 most often found words. The number 100 was discovered as “hh ah n d ax d” and “hh ah n d r ih d” and the number 90 as “n ay n t iy” and “n ey t iy”. A combination with metric learning and clustering of similar words with different pronunciations or spelling errors, could improve the learning result.
References
[1] M. Aharon, M. Elad, and A. Bruckstein. k -svd: An algorithm for design-ing overcomplete dictionaries for sparse representation. Signal Processing, IEEE Transactions on, 54(11):4311–4322, Nov 2006.
[2] A. Bellet and A. Habrard. Robustness and generalization for metric learn-ing. Neurocomputing, 151:259–267, 2015.
[3] A. Bellet, A. Habrard, and M. Sebban. Good edit similarity learning by loss minimization. Machine Learning, 89(1-2):5–35, 2012.
[4] A. Bellet, A. Habrard, and M. Sebban. Good edit similarity learning by loss minimization. Machine Learning, 89(1):5–35, 2012.
[5] A. Bellet, A. Habrard, and M. Sebban. A survey on metric learning for feature vectors and structured data. CoRR, abs/1306.6709, 2013.
[6] Y. Bengio, A. C. Courville, and P. Vincent. Representation learning: A review and new perspectives. IEEE Trans. Pattern Anal. Mach. Intell., 35(8):1798–1828, 2013.
[7] Y. Bengio, P. Simard, and P. Frasconi. Learning long-term dependencies with gradient descent is difficult. IEEE Transactions on Neural Networks, 5(2):157–166, 1994.
[8] M. Bernard, L. Boyer, A. Habrard, and M. Sebban. Learning probabilistic models of tree edit distance. Pattern Recognition, 41(8):2611–2629, 2008. [9] M. Bianchini and F. Scarselli. On the complexity of neural network
classi-fiers: A comparison between shallow and deep architectures. IEEE Trans. Neural Netw. Learning Syst., 25(8):1553–1565, 2014.
[10] M. Biehl, K. Bunte, and P. Schneider. Analysis of flow cytometry data by matrix relevance learning vector quantization. PLoS ONE, 8(3):e59401, 2013.
[11] S. Chaudhuri, M. Harvilla, and B. Raj. Unsupervised learning of acoustic unit descriptors for audio content representation and classification. InProc. of Interspeech, 2011.
[12] C. Cortes and V. Vapnik. Support-vector networks. Mach. Learn., 20(3):273–297, Sept. 1995.
[13] G. de Vries, S. C. Pauws, and M. Biehl. Insightful stress detection from physiology modalities using learning vector quantization. Neurocomputing, 151:873–882, 2015.
[14] P. Foldiak and D. Endres. Sparse coding. Scholarpedia, 3(1):2984, 2008. [15] J. Fransen, D. Pye, T. Robinson, P. Woodland, and S. Younge.WSJCAMO
corpus and recording description. Citeseer, 1994.
[16] B. Fr´enay and M. Verleysen. Parameter-insensitive kernel in extreme learn-ing for non-linear support vector regression. Neurocomputing, 74(16):2526– 2531, 2011.
[17] I. Giotis, K. Bunte, N. Petkov, and M. Biehl. Adaptive matrices and filters for color texture classification. Journal of Mathematical Imaging and Vision, 47:79–92, 2013.
[18] A. Gisbrecht and B. Hammer. Data visualization by nonlinear dimension-ality reduction. Wiley Interdisciplinary Reviews: Data Mining and Knowl-edge Discovery, 5(2):51–73, 2015.
[19] A. Gisbrecht, A. Schulz, and B. Hammer. Parametric nonlinear dimension-ality reduction using kernel t-sne. Neurocomputing, 147:71–82, 2015. [20] J. Goldberger, S. Roweis, G. Hinton, and R. Salakhutdinov. Neighborhood
[21] B. Hammer and K. Gersmann. A note on the universal approximation capability of support vector machines. Neural Processing Letters, 17(1):43– 53, 2003.
[22] B. Hammer, D. Hofmann, F. Schleif, and X. Zhu. Learning vector quanti-zation for (dis-)similarities. Neurocomputing, 131:43–51, 2014.
[23] B. Hammer and T. Villmann. Generalized relevance learning vector quan-tization. Neural Networks, 15(8-9):1059–1068, 2002.
[24] J. Hastad. Almost optimal lower bounds for small depth circuits. In Pro-ceedings of the Eighteenth Annual ACM Symposium on Theory of Comput-ing, STOC ’86, pages 6–20, New York, NY, USA, 1986. ACM.
[25] J. Heymann, O. Walter, R. Haeb-Umbach, and B. Raj. Unsupervised Word Segmentation from Noisy Input. InAutomatic Speech Recognition and Un-derstanding Workshop (ASRU), Dec. 2013.
[26] J. Heymann, O. Walter, R. Haeb-Umbach, and B. Raj. Iterative bayesian word segmentation for unspuervised vocabulary discovery from phoneme lattices. In39th International Conference on Acoustics, Speech and Signal Processing (ICASSP 2014), may 2014.
[27] G. E. Hinton. Learning multiple layers of representation. Trends in Cog-nitive Sciences, 11:428–434, 2007.
[28] J. Hocke, K. Labusch, E. Barth, and T. Martinetz. Sparse coding and selected applications. KI, 26(4):349–355, 2012.
[29] G. Huang, G. Huang, S. Song, and K. You. Trends in extreme learning machines: A review. Neural Networks, 61:32–48, 2015.
[30] A. Hyv¨arinen and E. Oja. Independent component analysis: algorithms and applications. Neural Networks, 13(4–5):411 – 430, 2000.
[31] A. Jansen, E. Dupoux, S. Goldwater, M. Johnson, S. Khudanpur, K. Church, N. Feldman, H. Hermansky, F. Metze, R. Rose, M. Seltzer, P. Clark, I. McGraw, B. Varadarajan, E. Bennett, B. B¨orschinger, J. Chiu, E. Dunbar, A. Fourtassi, D. Harwath, C.-y. Lee, K. Levin, A. Norouzian, V. Peddinti, R. Richardson, T. Schatz, and S. Thomas. A summary of the 2012 JHU CLSP workshop on Zero Resource speech technologies and mod-els of early language acquisition. In Proceedings of the 38th International Conference on Acoustics, Speech, and Signal Processing, 2013.
[32] S. Kaski, J. Sinkkonen, and J. Peltonen. Bankruptcy analysis with self-organizing maps in learning metrics. IEEE Transactions on Neural Net-works, 12(4):936–947, 2001.
[33] S. Kirstein, H. Wersing, H. Gross, and E. K¨orner. A life-long learning vector quantization approach for interactive learning of multiple categories.Neural Networks, 28:90–105, 2012.
[34] N. Kr¨uger, P. Janssen, S. Kalkan, M. Lappe, A. Leonardis, J. H. Piater, A. J. Rodr´ıguez-S´anchez, and L. Wiskott. Deep hierarchies in the primate visual cortex: What can we learn for computer vision? IEEE Trans. Pattern Anal. Mach. Intell., 35(8):1847–1871, 2013.
[35] B. Kulis. Metric learning: A survey. Foundations and Trends in Machine Learning, 5(4):287–364, 2013.
[36] M. Lukosevicius and H. Jaeger. Reservoir computing approaches to re-current neural network training. Computer Science Review, 3(3):127–149, 2009.
[37] G. D. S. Martino and A. Sperduti. Mining structured data.IEEE Compu-tational Intelligence Magazine, 5(1):42–49, 2010.
[38] V. Mnih, K. Kavukcuoglu, D. Silver, A. A. Rusu, J. Veness, M. G. Belle-mare, A. Graves, M. Riedmiller, A. K. Fidjeland, G. Ostrovski, S. Petersen, C. Beattie, A. Sadik, I. Antonoglou, H. King, D. Kumaran, D. Wierstra, S. Legg, and D. Hassabis. Human-level control through deep reinforcement learning. Nature, 518(7540):529–533, 02 2015.
[39] D. Mochihashi, T. Yamada, and N. Ueda. Bayesian unsupervised word segmentation with nested Pitman-Yor language modeling. In Proceedings of the Joint Conference of the 47th Annual Meeting of the ACL and the 4th International Joint Conference on Natural Language Processing of the AFNLP: Volume 1-Volume 1, 2009.
[40] B. Mokbel, B. Paassen, F.-M. Schleif, and B. Hammer. Metric learning for sequences in relational lvq. Neurocomputing, accepted, 2015.
[41] G. Neubig, M. Mimura, and T. Kawaharak. Bayesian learning of a language model from continuous speech. IEICE TRANSACTIONS on Information and Systems, 95(2), 2012.
[42] D. Nova and P. A. Est´evez. A review of learning vector quantization clas-sifiers. Neural Computing and Applications, 25(3-4):511–524, 2014. [43] P. Schneider, M. Biehl, and B. Hammer. Adaptive relevance matrices in
learning vector quantization.Neural Computation, 21(12):3532–3561, 2009. [44] S. Seo and K. Obermeyer. Soft learning vector quantization. Neural
Com-putation, 15:1589–1604, 2003.
[45] S. Shalev-shwartz, Y. Singer, and A. Y. Ng. Online and batch learning of pseudo-metrics. InIn ICML, pages 743–750. ACM Press, 2004.
[46] Y. Shi, A. Bellet, and F. Sha. Sparse compositional metric learning.CoRR, abs/1404.4105, 2014.
[47] M.-h. Siu, H. Gish, A. Chan, W. Belfield, and S. Lowe. Unsupervised training of an hmm-based self-organizing unit recognizer with applications to topic classification and keyword discovery.Computer Speech & Language, 28(1):210–223, 2014.
[48] I. Steinwart. Consistency of support vector machines and other regularized kernel classifiers. IEEE Transactions on Information Theory, 51(1):128– 142, 2005.
[49] Y. W. Teh. A Bayesian interpretation of interpolated Kneser-Ney. 2006. [50] Y. W. Teh. A hierarchical Bayesian language model based on Pitman-Yor
processes. InProceedings of the 21st International Conference on Computa-tional Linguistics and the 44th annual meeting of the Association for Com-putational Linguistics. Association for Computational Linguistics, 2006. [51] P. Ti˜no and B. Hammer. Architectural bias in recurrent neural networks:
Fractal analysis. Neural Computation, 15(8):1931–1957, 2003.
[52] L. Van der Maaten, E. Postma, and H. Van den Herik. Dimensionality reduction: A comparative review. Technical Report TiCC TR 2009-005, 2009.
[53] O. Walter, V. Despotovic, R. Haeb-Umbach, J. Gemmeke, B. Ons, and H. Van hamme. An evaluation of unsupervised acoustic model training for a dysarthric speech interface. In INTERSPEECH 2014, 2014.
[54] O. Walter, R. H¨ab-Umbach, B. Mokbel, B. Paaßen, and B. Hammer. Au-tonomous learning of representations. KI - K¨unstliche Intelligenz, pages 1–13, 2015.
[55] O. Walter, R. Haeb-Umbach, S. Chaudhuri, and B. Raj. Unsupervised Word Discovery from Phonetic Input Using Nested Pitman-Yor Language Modeling. ICRA Workshop on Autonomous Learning, 2013.
[56] O. Walter, T. Korthals, R. Haeb-Umbach, and B. Raj. A Hierarchical System For Word Discovery Exploiting DTW-Based Initialization. In Au-tomatic Speech Recognition and Understanding Workshop (ASRU), Dec. 2013.
[57] K. Q. Weinberger and L. K. Saul. Distance metric learning for large margin nearest neighbor classification. J. Mach. Learn. Res., 10:207–244, June 2009.
[58] B. Widrow and M. A. Lehr. 30 years of adaptive neural networks: Percep-tron, madaline, and backpropagation.Proceedings of the IEEE, 78(9):1415– 1442, 1990.
[59] L. Wiskott, P. Berkes, M. Franzius, H. Sprekeler, and N. Wilbert. Slow feature analysis. Scholarpedia, 6(4):5282, 2011.
[60] E. P. Xing, A. Y. Ng, M. I. Jordan, and S. Russell. Distance metric learning, with application to clustering with side-information. In ADVANCES IN NEURAL INFORMATION PROCESSING SYSTEMS 15, pages 505–512. MIT Press, 2003.
[61] X. Zhu, F. Schleif, and B. Hammer. Adaptive conformal semi-supervised vector quantization for dissimilarity data. Pattern Recognition Letters, 49:138–145, 2014.